Public Private Partnership and Foreign Direct
Investment: Case studies of four Asian
countries
著者
Naoya KAWAMURA
journal or
publication title
東洋大学PPP研究センター紀要
volume
11
page range
1-52
year
2020-03
URL
http://doi.org/10.34428/00011583
投稿論文/Contributions
Public Private Partnership and Foreign Direct Investment:
Case studies of four Asian countries
Naoya KAWAMURA
University College London, MSc Candidate in Infrastructure Investment and Finance
Abstract
The gap between need and provision of infrastructure is increasing in Asia. Due to the limitation of domestic financial resources, FDI can play an important role in providing the necessary finance for infrastructure in developing countries.
The case study of four different Asian countries revealed the importance of FDI in infrastructure provision. Vietnam and India achieved significant growth in private infrastructure investment, while the institutional and regulatory framework for PPP is relatively weaker than those of the Philippines and Malaysia, which private infrastructure investment was stagnant.
These results showed that the abolition of FDI restriction could promote private
infrastructure investment regardless of the quality of their regulatory and institutional framework for PPP.
Table of Contents
1. INTRODUCTION ... 3
2. LITERATURE REVIEW ... 4
2.1 THE INFRASTRUCTURE NEEDS IN ASIA ... 4
2.2 THE IMPORTANCE OF PRIVATE INVESTMENT ... 4
2.3 THE TYPES OF PRIVATE PARTICIPATION ... 5
2.4 CHALLENGES IN PROMOTING PRIVATE INVESTMENT ... 6
2.5 THE ROLE OF FDI ... 8
2.6 METHODOLOGY ... 10
3. STUDY OF SUCCESSFUL CASE (VIETNAM AND INDIA) ... 14
3.1 VIETNAM ... 14
3.2 INDIA ... 22
4. STUDY OF FAILURE CASES (PHILIPPINES AND MALAYSIA) ... 29
4.1 PHILIPPINES ... 29
4.2 MALAYSIA ... 34
5. CONCLUSION ... 40
List of illustrations
Figure 1. PPI in Vietnam (Source: Made by author from PPI Database by the
World Bank) ... 14
Figure 2. Infrastructure Financing for Vietnam (Source: Nhi 2014) ... 15
Figure 3. The share of each sectors in terms of number of project (% of total) 20
Figure 4. PPI in India (Source: Made by author from PPI Database by the World
Bank) ... 22
Figure 5. The share of each sectors in terms of number of project (% of total) 23
Figure 6. PPI in Philippines (Source: Made by author from PPI Database by the
World Bank) ... 30
Figure 7. The share of each sectors in terms of number of project (% of total) 30
Figure 8. PPI in Malaysia (Source: Made by author from PPI Database by the
World Bank) ... 35
Figure 9. The share of each sectors in terms of number of project (% of total) 35
Table 1. Comparison of challenges in private infrastructure investment ... 8
Table 2. The effects of FDI determinants ... 10
Table 3. PPI and Infrascope index ... 11
Table 4. Case comparison ... 12
Table 5. FDI restrictiveness index and FDI attractiveness index ... 13
Table 6. Total Investment (million US$) (and the number of project) of PPI ... 21
Table 7. FDI restrictiveness index in Vietnam ... 21
Table 8. FDI restrictiveness index in Vietnam ... 26
Table 9. Total Investment (million USD) (and the number of project) of PPI ... 27
Table 10. FDI restrictiveness index in Vietnam ... 33
Table 11. Total Investment (million US$) (and the number of project) of PPI ... 33
Table 12. FDI restrictiveness index in Malaysia ... 38
1. INTRODUCTION
Good and sufficient infrastructure is the key determinant to economic growth as well as social and ecological development in developing countries (Asian Development Bank 2017; DFID 2002; Ali and Pernia 2003). For example, infrastructure provides an enabling environment for business so that it provides people an opportunity to get jobs and gain income. Also, it increases accessibility to various services such as schools and hospitals (Seetanah et al. 2009; DFID 2002; Booth et al. 2000; Aschauer 1990).
However, some developing countries failed to improve their infrastructure while others succeeded to increase infrastructure investment and enhanced the quality and quantity of infrastructure. Especially, the gap between provision and need is significant in Asia, where its economy and population are growing rapidly (Nishizawa 2018; McKinsey 2016).
Many literatures point out that the lack of private infrastructure investment is one of the bottleneck of promoting infrastructure investment (Ra and Li 2018; Tyson 2018; Asian
Infrastructure Investment Bank 2018; Asian Development Bank 2017; McKinsey 2016). However, especially in developing countries, the size of the domestic financial market is too small to provide sufficient investment to fulfill its need. In those countries, Foreign Direct Investment (FDI) plays important role in promoting the infrastructure investment. This paper discusses the the role of foreign investors and how regulatory and institutional framework, and FDI restriction influence their behaviour through the case study. At first, the following section discusses the current study about infrastructure investment. After that, the section 3 and 4 analyze the importance of regulation and FDI on private infrastructure investment by using four case studies: Vietnam and India as successful cases and the Philippines and Malaysia as failure cases. By comparing the share of FDI in infrastructure investment and surrounding regulation on FDI as well as the institutional and regulatory framework for PPPs, this study shows how FDI and relaxed restriction on FDI contribute to the private infrastructure investment in these countries.
2. LITERATURE REVIEW
2.1 THE INFRASTRUCTURE NEEDS IN ASIA
The 21st century is predicted to become "Asian Century" due to its rapidly increasing population and economy (Asian Development Bank 2011). According to Asian Development Bank (2011), if it keeps growing on its recent trend, Asia will account for more than half of global GDP by 2050, nearly two-fold increase from today, as well as its per capita income also will reach the similar level to today's European country in 2050. Its population also is expected to increase up to about 5.2 billion in 2050, account for 54 % of the total population in the world (United Nations 2015). In terms of infrastructure investment, nearly half of the total investment on infrastructure goes to Asian countries today, moreover, its share will be expected to increase while that of developed countries is expected to decrease (McKinsey 2016).
The high economic growth and increasing population lead the high need for infrastructure investment in Asian country (Nishizawa 2018), and it leads deficits of infrastructure in Asian countries despite of aspirations for increasing infrastructure investment. The importance of promoting infrastructure investment is emphasized in various development plan and studies from the past (McKinsey 2016). For example, Asian Development Bank (2001)’s “The Long-term Strategic Framework of the Asian Development Bank (2001-2015)” emphasized infrastructure investment is necessary to achieve sustainable economic growth. However, these intentions and efforts to increase infrastructure investment did not achieve sufficient infrastructure provision in the region (McKinsey 2016). As a matter of fact, many literatures still point out that infrastructure provision in Asian countries is still not sufficient, and there is a huge gap between demands and supply.
Asian Development Bank (2017) estimated that it is necessary to invest 26 trillion US$ from 2016 to 2030 in Asia, which is equivalent to 1.7 trillion US$ per year. This enormous demand will create a massive gap between investment and demand for infrastructure. The region currently invests about 881 billion US$ per year in the infrastructure sector (Asian Development Bank 2017). Estimated by the current trends, the infrastructure investment gap will be 459 billion US$ - equal to 2.4% of GDP in the region (Asian Development Bank 2017). To make things worse, without the People's Republic of China (PRC), the gap will rise to higher than 5% of GDP of the remaining countries in Asia (Asian Development Bank 2017).
2.2 THE IMPORTANCE OF PRIVATE INVESTMENT
However, as discussed above, it is difficult for the public sector alone to provide sufficient infrastructure investment, therefore, private participation is necessary. In general, there are three types of financial sources of infrastructure investment; (a) national or local governments' budget, (b) an aid or a loan from bilateral or multilateral international agencies or (c) private finance (Kato 2016). Today, most developed countries except Japan have higher share of private finance but public finance is still major source of finance in Asian countries (Inderst 2016).
McKinsey (2016) estimated that Asian countries, except developed countries and China, had spent 3.6% of GDP on an average between 1992 to 2013. This means that these countries need
to increase its public finance about three-times larger in order to meet the 5% future infrastructure gap. However, It is difficult to make additional funds from former two public finance source to fulfil the enormous gap of infrastructure investment due to its limited capacity (Asian Development Bank 2017; Asian Development Bank 2011; Kato 2016). This is because it is difficult to make additional funds from limited government’s budget which is also necessary to implement other prioritized policies (Subhanij and Lin 2019; Tyson 2018; Kato 2016). In terms of increasing revenue, it is also difficult especially for developing countries to collect additional funds for infrastructure by establishing new tax or user fees (Estache et al. 2015). Also, the international aid cannot become a sufficient source of infrastructure investment considering the current trends1 (Kato 2016).
Due to the limited availability of public finance, many international organizations and academic literature emphasize the importance of private investment for filling the gap between the needs and the public investment (Asian Development Bank 2017; Asian Development Bank 2011; DFID 2007). In addition, private participation in infrastructure provision can expand accessibility of services, and provide its services more efficiently with better quality (Harris et al, 2003; Clark, 2006 cited in DFID, 2007)
However, private funding still remains a minor source of infrastructure investing (Tyson 2018); Estache (2006) estimates that 70% of total investment comes from the public sector, 20% from private funding and 10% from aid. According to these, it is important to think about how to promote private investment.
2.3 THE TYPES OF PRIVATE PARTICIPATION
PPP is a common form of private participation in infrastructure provision. According to the Private Participation in Infrastructure Database by World Bank, more than 80% of private
participation was implemented by the form of PPPs. International Monetary Fund defined PPP as;
“An arrangement where the private sector supplies assets and services that traditionally have been provided by the government.” (IMF 2004, pp.3) “In addition to private execution and financing of public investment, PPPs have two other important characteristics: there is an emphasis on service provision, as well as investment, by the private sector; and significant risk is transferred from the government to the private sector” (IMF 2004, pp.6).
PPP comes in many forms, such as BOT (Build Operate and Transfer), BOO (Build-Own-Operate), BOOT (Build-Own-Operate-Transfer), BOLT (Build-Operate-Lease-Transfer), LDO (Lease-Develop-Operate), ROT (Rehabilitate-Operate-Transfer) and so on. Each form of PPP is a slightly different arrangement or contract between the private sector and a government in terms of who is responsible designs, finances, builds, develops, owns, operates and manages an infrastructure.
1 For example, although it is increasing, net ODA to Asia was only about $49 billion and about 65% of
However, they all share the common features: private sectors participate in infrastructure provision, and they can have rights to acquire income from government or service user.
Although there are some critiques of PPP, claiming that PPP enable private firms to extract public wealth for private gain (Hildyard 2014), PPP gradually became a popular method to involve the private sector in order to increase infrastructure provision (Roehrich et al. 2014; Mahoney et al. 2009).
The nature of infrastructure project also has an effect on investors incentives to invest. Broadly speaking, there are two types of project in infrastructure investment: greenfield project and brownfield project. Greenfield project is the project which requires investors to design, develop, and construct infrastructure from the beginning, and its potential investment gains will come in later years. Brownfield project, on the other hand, refers to management or rehabilitation of existing assets, such as privatization of existing public services.
Greenfield projects may bring more profit; however, it is more difficult to attract private investment because it is riskier and require investors to design, develop, and construct
infrastructure from the beginning (Ra and Li 2018). Because of this, private investors often prefer to invest low-risk brownfield project (World Economic Forum 2014).
Nevertheless, 70% of the now available projects to private investors are greenfield projects (McKinsey 2016), which deprive private investors an opportunity for investing in infrastructure.
2.4 CHALLENGES IN PROMOTING PRIVATE INVESTMENT
Although the PPP is gradually becoming a more popular way of infrastructure provision, there is still a huge gap to be filled. Why the private investment is still lacking despite the fact that the importance of private participation was already recognized before? What makes it difficult? Is there any specific problem in Asia? Table 1 summarized the literature which argues the hindrance to private infrastructure investment from the two viewpoints, the argument for all over the world including Asia and the argument for Asia specifically. Among them, one of the issues commonly discussed in the literature is financial mobilization (lack of finance). The literature mainly suggested two aspects.
The first one is the heterogeneous distribution of private finance. Private finance is
concentrated on the middle-income countries and more attractive sectors such as electricity. Tyson (2018) estimated that middle-income countries, including Asian countries, attracted 98% of all private infrastructure financing between 2008 and 2017. Compared with this, low-income countries attract only a small portion of private finance (McKinsey 2016). This is because the private finance flows to the more commercially attractive project in middle-income countries (Tyson 2018).
Secondly, the amount of private finance itself is small both in the world and the Asian country. As discussed above, most of the provision of infrastructure are made by the public sector. Although Asian countries, especially East Asian countries, show a relatively high saving rate (World
Bank, 2019), Ra and Li (2018) estimated that the small portion of funds allocated to infrastructure investment2; that is, they failed to maximize the potential of private funds (Nishizawa 2018).
2 Nishizawa (2018) noted that many of emerging and developing Asian countries have shown excess
savings over investment. This means that the domestic savings have not been effectively and fully utilized as sources of infrastructure investment (Nishizawa 2018).
Table 1. Comparison of challenges in private infrastructure investment
(Made by author from Tyson 2018; Ra and Li 2018; Asian Infrastructure Investment Bank 2018; Asian Development Bank 2017; McKinsey 2016)
2.5 THE ROLE OF FDI
Considering an unmatured and limited financial market in developing countries, Foreign Direct Investment (FDI) can play an important role in providing infrastructure investment in those countries.
In general, FDI plays an important role in providing necessary finance, technology, knowledge, and jobs (Ghebrihiwet and Motchenkova 2017; Thomsen 2019). However, some government worries about its crowding-out effects and try to protect the domestic industry. One of the most common strategies is to impose restrictions on the activities of foreign investors
W O R L D W I D E V I E W A S I A N V I E W Private infrastructure financing in developing countries (Tyson 2018) Bridging Global Infrastructure Gaps (McKinsey 2016) Meeting Asia’s Infrastructure Needs (Asian Development Bank 2017)
Closing the Financial Gap in Asian Infrastructure (Ra and Li 2018) Mobilizing Private Capital for Infrastructure (Asian Infrastructure Investment Bank 2018) Environ mental Issue
• Various kinds of risks are an obstacle for investment (e.g. political, macroeconomics, interest rate and exchange rate)
• Regulation, risk and cross border investment rules
• High infrastructure investment risks (failure of payment/ higher country’s risk (regulatory, macroeconomic and political risk)) • Asymmetries of
information (e.g. its risk, demand and the return are not shared effectively) and the different regulation within the region (lack of
standardization) also also leads extra cost.
• Excessive perception of risk (political, currency, social and environmental risk)
Finance mobilizat ion
• Private infrastructure investment has been concentrated in countries with strong investment fundamentals so that investment to middle-income countries are biggest. • Mobilization of
private finance is still low level. • Low income countries attract small amount of finance • Mobilization of private finance is low • The infrastructure
equity market in Asia is relatively small compared to other areas
• Limited role of long-term investors (the scale of pension funds in the region except Japan is small / Funds allocated only 1% of their fund in infrastructure)
The character istics of projects
• The lack of bankable projects.
• A mismatch between demands and needs (such as minimum credit-rating and liquidity levels)
• The lack of bankable projects
• The difficulty of assessment
• A limited pipeline of bankable projects due to its complex procedure before investment.
• Weak preparation of
bankable projects • Difficulties to create bankable project
• The lack of standardization
Other
issues • the lack of a credible credit rating scheme for project bond, which is necessary for investment firms to determine the investment
• Its long-term and non-liquid nature hinder the investment
Risk
Lack of finance
(Thomsen 2019). For example, the limitation of foreign equity share is employed to protect local companies and require foreign investors to share its profits and technologies with local partners (Thomsen 2019).
Mistura and Roulet (2019) showed that foreign equity limitation is the strongest restriction and have greater importance for foreign investors. In most countries, foreign equity limits, which limit the extent of foreign ownership in the companies in a certain sector, is the common measure to restrict foreign investment (Mistura and Roulet 2019). The rationale for this restriction is to protect domestic investors, which is not matured and less competitive, from foreign competition and to promote linkages between foreign investors and the domestic economy for the purpose of pushing domestic investors to acquire foreign investor's technology and knowledge (Mistura and Roulet 2019).
However, many studies have suggested that the restrictions are often not only ineffective but also counterproductive (Mistura and Roulet 2019; Thomsen 2019). Also, Nicoletti et al. (2003) and Ghosh et al. (2012) examined the effects of restrictions on FDI in OECD countries and
concluded that there is a negative effect of restrictions on inward FDI stocks, depressing FDI by between 10% and 80% on average across countries. Conversely, OECD (2011) showed that a political shift from full restriction to full liberalization would improve FDI by about 25% in OECD countries. This is because, although some investors might be happy to work with local partners to handle local regulations and cultural customs, restriction on equity share will limit on a foreign investor's control of the company (Thomsen 2019).
However, although some studies like Nicoletti et al. (2003) focused on how infrastructure affects the inflow of FDI, no studies focused on how FDI restrictions affect the foreign investment on infrastructure. In addition, most studies analyzed the relationship between the restriction or environment and overall FDI, so it does not distinguish where FDI goes.
Besides the restriction on FDI, many determinants of FDI were discussed and analyzed. In most of the studies. For example, a market size and growth rate are the most commonly used indicators of locational determinants of FDI (Mitsura and Roulet 2019). Countries with larger markets tend to receive more FDI, due to higher demand potential and returns to scale. Another example is the taxation. Higher corporate taxation is expected to discourage FDI because foreign investors seek to maximize the return on their investment.
However, it is pointed out that the existing literature on the determinants of FDI inflow has been mixed and inconsistent (Hasli et al. 2015; Kok and Ersoy 2009). As shown in Table 2, a large number of studies on FDI determinants have been conducted, but their outcome is inconsistent and sometimes conflicting. On this point, Chakrabarti (2001) argued that "the relation between FDI and many of the controversial variables (namely, tax, wages, openness, exchange rate, tariffs, growth and trade balance) are highly sensitive to small alterations in the conditioning information set." Furthermore, this is because of the complexity of the economy and decision on investment, so FDI determinants and significance of each determinant could vary from country and country, sector by sector (Saini and Singhania 2018; Petrović-Ranđelović et al. 2013). According to these, it is
meaningful to analyze the relationship between FDI regulation and FDI investment through case study methodology.
Table 2. The effects of FDI determinants
(Source: Kok and Ersoy 2009)
2.6 METHODOLOGY
The purpose of this paper is to discuss the role of FDI in infrastructure investment and how regulatory and institutional framework determine the participation of foreign investors. For this purpose, this paper employed a case study analysis. The case study is an appropriate methodology when a holistic, in-depth investigation is needed (Orum et al. 1991; Yin 2014). In this sense, the case study analysis is an appropriate measure in order to research the causality between enabling environment and private infrastructure investment and the role of FDI.
Non-effect Negative effect Positive effect
Openness Schmitz and Bieri (1972), Wheeler and Mody (1992)
Kravis and Lipsey (1982), Culem (1988), Edwards (1990), Pistoresi (2000), De Mello (1999) Growth rates Tsai (1994) Lunn (1980), Schneider and Frey
(1985), De Long and Summers (1991), Levine and Renelt (1992), Culem (1988), Blomstrom et al. (1992), Borensztein et al. (1998), Billington (1999), Lim (2001), Durham (2002), Chakraborty and Basu (2002)
Exchange rates Blonigen (1997), Tuman and Emmert (1999)
Caves (1989), Froot and Stein (1991), Blonigen and Feenstra (1996),
Edwards (1990) Tax factors (national and local tax
rates; tax depreciation and tax credits at the national and at the local levels; tax holidays, dividend policy) and non-tax government incentives
Wheeler and Mody (1992), Jackson and Markowski (1995), Yulin and Reed (1995)
Hartman (1984), Grubert and Mutti (1991), Hines and Rice (1994), Loree and Guisinger (1995), Cassou (1997), Devereux and Griffith (1998), Billington (1999), Desai et al. (2002)
Swenson (1994)
Labor costs Owen (1982), Gupta (1983), Lucas (1990), Sader (1993), Tsai (1994)
Goldsbrough (1979), Flamm (1984), Culem (1988), Schneider and Frey (1985), Shamsuddin (1994), Pistoresi (2000)
Caves (1974), Swedenborg (1979), Wheeler and Mody (1992) Trade barriers Blonigen and Feenstra (1996) Culem (1988) Schmitz and Bieri (1972), Lunn
(1980) Gross domestic investment, gross
capital formation and infrastructures
Sun (1998) Technology gap Blomstrom (1989)
Economic Freedom De Haan and Sturm (2000), Bengoa and Sanchez-Robles (2003)
Market sizes Bandera and White (1968), Swedenborg (1979), Rott and Ahmed (1979), Lunn (1980), Kravis and Lipsey (1982), Nigh (1985), Culem (1988), Pearce (1990), Wheeler and Mody (1992), Dunning (1993), Tsai (1994), Loree and Guisinger (1995), Shamsuddin (1994), Dees (1998), Billington (1999), Pistoresi (2000),Shatz and Venables (2000), Fung et al.(2000) R&D (research and development) Ueng and Ojah (1997), Tomiura
(2003), Caves (1996) Corruption Drabek and Payne (1999),
Kaufmann and Wei (1999), Wei (1999), Smarzynska and Wei (2000)
Human capital Fosfuri et al. (2001), Glass and Saggi (2002)
In order to select countries to analyze, this paper considered the current trends of private infrastructure and their environment for PPP.
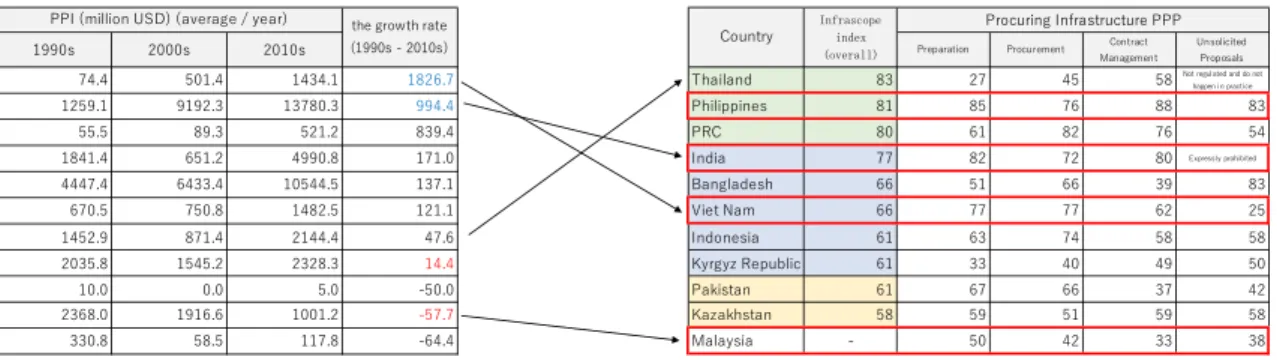
Table 3 shows the current trends of private infrastructure investment, Infrascope index, and score of Procuring Infrastructure PPPs in some Asian countries. The World Bank's Private Participation in Infrastructure (PPI) Database34 is used to measure private infrastructure
investment. On the other hand, two indexes are used to measure the enabling environment of PPP projects. Infrascope index by The Economist (2018) indicates the capacity of countries implement PPP by evaluating their regulations, institutions and investment climate. In addition, Procuring Infrastructure PPPs by World Bank (2018) also measures enabling environment of PPP project from different perspective. It measures 135 economies and scored from four perspectives: preparation, procurement, contract management, and a special module on unsolicited proposals (USP).
In table 3, PPI in Vietnam and India grew significantly from the 1990s to the 2010s, 1826.7% and 994.4% respectively. On the other hand, countries such as Philippines and Malaysia did not increase PPI in the same period. More interestingly, this does not correlate with the Infrascope index and Procuring Infrastructure PPPs scores.
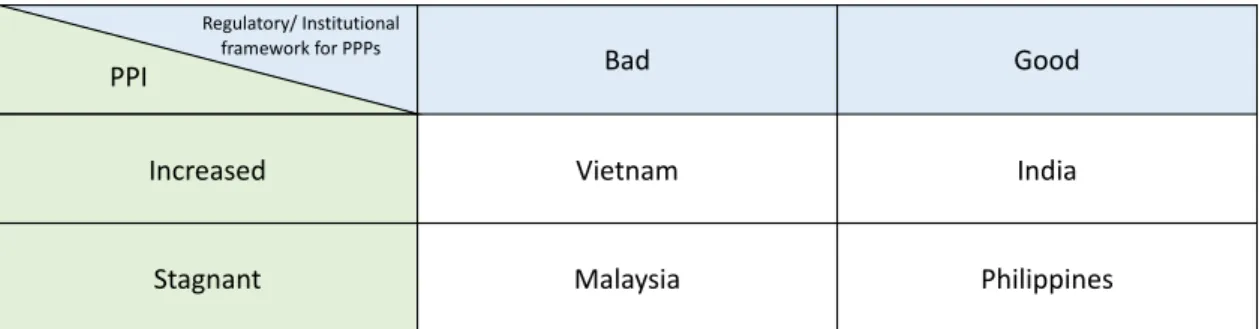
Considering these facts, the four countries were chosen for the case study; Vietnam, India, Philippines and Malaysia. These four countries were chosen in terms of their growth rate of PPI and whether their environment for PPP is good or bad (see Table 4)5.
Table 3. PPI and Infrascope index
(Source: made by author from The Economist (2018) and PPI database by World Bank)
3 The PPI Database is the comprehensive data set on infrastructure investment with private
participation, in low and middle countries. PPI data set collects data of infrastructure project with various kinds of private participation, mostly in the form of PPP.
4 Although PPI database is widely used for research on PPPs, it also contains some limitations, such as a
risk of inaccuracy due to the reliability of data sources and a risk of poor representation of small projects (The World Bank 2019; Kaminsky 2017). Also, the PPI database collects data using their own criteria, and it does not necessarily match the definitions of PPPs in each country.
5 Infrascope index of Malaysia is not available. However, the following section shows that the quality of
their institutional and regulation framework of PPP are weak.
-- 6K K MDI 6KI NK M /I MK M 4 B M I D DM 6KI I ( ( ) ( ( ( 9C D () ) 5IM K BN M I IM C DK MD )- - - --( ( 6CD D D ) )) ) - ) - ( 67/ )( ( ( ) (-- 2 D 1 K R KICD DM ((( ( ( ( )(( ) . B C ) -) ) ( ) D M 5 ) () - ( (( ( ( 2 I D ( ) ) ) )() ( ( 3RKBRS 7 N D ( (- ) ) ) 6 ED M ( - ) 3 S EC M ) )- ) )- ) ) ) ( ( 4 R D ) ( 6KI NKD B 2 K MKN MNK 666 /IN MKR ( ) ( ) 662 D DI 80 K B R K MC BKIPMC K M
--Table 4. Case comparison
(Source: made by author) In order to compare the situation surrounding FDI, this paper uses two index, FDI
restrictiveness index and FDI attractiveness index. FDI restrictiveness index is calculated by OECD, covering all OECD members and some non-OECD members. The index evaluates the four aspects of FDI regulation, equity restrictions, screening and approval requirements, restrictions on foreign key personnel, and other operational restrictions (such as limits on purchase of land or on repatriation of profits and capital) (OECD 2010). While FDI restrictiveness index measures the regulatory restriction on FDI, FDI attractiveness index by Riadh (n.a) considers more comprehensive factors, such as macroeconomics (i.e., Real GDP growth volatility, Inflation Rate), governance (i.e., Political Stability and Absence of Violence, Control of Corruption) and business environment (i.e., investor protection, contract enforcement). These indexes give us general trends of FDI in the four case study countries.
Table 5 shows a summary of the FDI indexes in each country. The total FDI restrictiveness index in India and Vietnam is relatively smaller than Malaysia and Philippines. This means that the former two countries have more lax regulation than latter countries. Sector-wise, the electricity and transport sector in India and the electricity sector in Vietnam have a very small restriction index (less than 0.1).
In terms of FDI attractiveness index, on the other hand, Malaysia has the highest score among the four countries due to the high score in the Prerequisites field6.
6 In the Prerequisites field, Malaysia has a higher score in the business environment. Especially, their
stability of electricity supply, investor protection, and smoothness of construction permits are evaluated well.
Bad Good
Increased Vietnam India
Stagnant Malaysia Philippines
Regulatory/ Institutional framework for PPPs
Table 5. FDI restrictiveness index and FDI attractiveness index
(Source: made by author from OECD (n.d.) and Riadh (n.d)) Based on these facts, the following sections discuss the trends of PPP infrastructure investment and the reasons why infrastructure investment in four countries was increased or stagnant.
FDI restrictiveness index (2018)
Sector / Industry Electricity 0.064 0.01 0.5 0.365 Transport 0.093 0.528 0.296 0.655 Communications 0.175 0.583 0.375 0.65 Primary 0.213 0.061 0.295 0.644 Secondary 0.041 0.022 0.112 0.164 Tertiary 0.314 0.225 0.326 0.409 Media 0.28 0.408 0.525 0.913
Real estate investment 0.95 0.237 0.3 0.525
Total FDI Index 0.209 0.13 0.252 0.374
FDI attractiveness index (2019)
Prerequisites 59.8 59.8 72.6 54.4
Underlying Factors 39.7 44.6 51.9 39
Agglomeration & Differentiation 30.1 32.5 38 29.5
Total FDI index 43.1 45.9 54.3 41.1
India Viet Nam Malaysia Philippines
3. STUDY OF SUCCESSFUL CASE (VIETNAM AND INDIA)
Section 3 focuses on the case of Vietnam and India. These two countries achieved significant growth from the 1990s to 2010s, respectively. On the other hand, these two countries have different quality of regulatory and institutional framework of PPP. India has a better
framework of PPP, while Vietnam has an inferior framework. By analysing these two countries, this chapter shows how important FDI is in infrastructure investment, and how regulatory and
institutional framework determines the participation of foreign investors.
3.1 VIETNAM
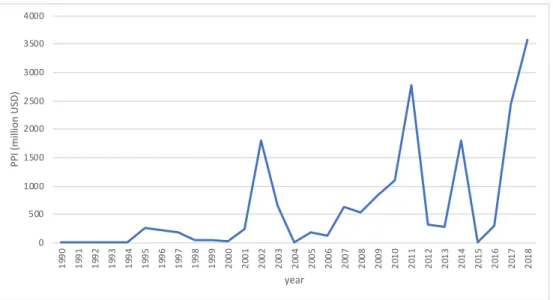
Private infrastructure investment in Vietnam was scarce in the 1990s; there was only 10 projects and 744 million US$ of investment in total in the decade of the 1990s. However, Vietnam reached its highest PPI (3.6 billion US$) in 2018, which is the third highest investment destination in Asia in 2018 (The World Bank 2019) (Figure 1). This rapid increase also contributed to the world's PPI growth in 2018 (The World Bank 2019).
According to this, the structure of the finance source for infrastructure changed over time. The share of financing from the Vietnamese government and ODA has decreased, while that of private investment increased (The Economist 2018; Nhi 2014)(Figure 2).
Figure 1. PPI in Vietnam (Source: Made by author from PPI Database by the World Bank)
0 500 1000 1500 2000 2500 3000 3500 4000 19 90 19 91 19 92 19 93 19 94 19 95 19 96 19 97 19 98 19 99 20 00 20 01 20 02 20 03 20 04 20 05 20 06 20 07 20 08 20 09 20 10 20 11 20 12 20 13 20 14 20 15 20 16 20 17 20 18 PP I (mi lli on U SD) year
Figure 2. Infrastructure Financing for Vietnam (Source: Nhi 2014) (Economic profile of Vietnam)
Over the past 30 years, Vietnam has had a remarkable economic development. After the Vietnam war, it was one of the poorest countries in the world, and its GDP per capita was stuck between 200 and 300 US$ (Nhi 2014). After the introduction of the economic and political reform, called Doi-Moi, in 1986, Vietnam's economy showed rapid growth with annual 6-7% growth rate (Vanham 2018).
Market liberalization is one of the main factors of rapid economic growth in Vietnam. One of their examples is SOEs reform. Historically, Vietnam was the centrally planned economic regime which State Owned Enterprises (SOEs) played a central role in the Vietnamese economy and exclusively dominated many industries, including the provision of infrastructure (Nguyen and van Dijk 2012). However, there are some drawbacks of SOEs in terms of efficient provision of
infrastructure. For example, SOEs had crowded out private investment because they deprived the opportunity and resource of private companies due to the favourable environment for them in terms of regulations and loan availabilities (The Economist 2018; Vu-Thanh 2017; Van Thang and Freeman 2009). Because of this, SOEs are regarded as the hindrance of economic growth.
From the 1990s, Vietnamese government started Doi-Moi, which means “renovation” in English, in order to open its economy to international trade and foreign investment (Dinh 2000). SOEs reform was part of Doi-Moi reform, and aimed to promote participation of more efficient and competitive private sector (Nguyen and van Dijk 2012). Along with SOEs reforms, FDI also increased from the 1990s. Its strategic location and rapid economic growth made Vietnam more attractive investment destination and the government had also introduced the Law of Foreign Investment in Vietnam in order to attract more foreign investment (Alfen et al. 2009). Because of this, annual FDI inflow into Vietnam was 0.32 billion US$ in 1988 but it has increased dramatically (Phi-lan 2006), and in 2018, Vietnam attracted 35.46 billion US$.
28 23 14 12 37 21 28 44 0% 10% 20% 30% 40% 50% 60% 70% 80% 90% 100% 2002 2010(estimates)
(Promotion of Private Participation in Vietnam)
Rapid economic growth in Vietnam led to an enormous demand for infrastructure (ESCAP, 2017). The national development plan, such as the Five-year socio-economic development plan in 2011 and the Socio-economic development plan for 2016-2020 in 2016 articulated the need to promote infrastructure investment (ESCAP 2017a; Nhi 2014). However, the financial capacity of the government is limited and ODA was also expected to decrease as Vietnam's economy grew, the government started to pay more attention to private participation in infrastructure investment (Vietnam Investment Review 2019; ESCAP 2017a).
In the early 1990s, the Vietnamese government had announced its desire to attract private investment in infrastructure, and tried to promote private participation in infrastructure projects (Alfen et al. 2009). For example, the government revised the Law on Foreign Investment to
promote Build Operate and Transfer (BOT)7 projects in 1992. Also, the BOT regulation was decreed
a year later (Baietti 2000).
However, private participation in infrastructure projects remained very low, and there was no evidence that the regulatory framework for BOT could promote private participation in the 1990s (Baietti 2000). In addition to there were no replicable models for PPI projects due to its limited number of PPI projects, there were three hinderances of private infrastructure investment in Vietnam (Baietti 2000);
1. Some sectors, such as airports, railway and telecommunications, were still restricted to private management and ownership
2. There are many other restrictions on foreign firms to invest in the Vietnamese infrastructure sector.
3. The general business environment was still not developed and made an investment in infrastructure risky for private sponsors.
In the 2000s, the Vietnamese government continued to make an effort to develop the environment for private investment in infrastructure and the current regulatory and institutional framework for PPP was established.
(Institutional framework)
Today, the institutional framework for PPP projects in Vietnam consists of;
§ PPP Steering Committee, which is established and managed by the initiative of the prime
minister
7BOT (Build-Operate-Transfer) is one of the forms of PPP. Private contractors are responsible for
the design, build, and operation as well as financing it on behalf of the government. The private firm can get revenue from user fees or payment by the government. On the end of the contract term, the infrastructure assets will be transferred to the government.
§ Government authorities, such as ministries and provincial committees, which sign contracts PPP projects
§ PPP units at the provincial and central government, which manage PPP operations
§ PPP Office under the Ministry of Planning and Investment (MPI), which provide overall
guidance and support for PPP.
The institutional framework in Vietnam regarded as matured in Infrascope index, which scored 84 in domain 2 (institution) (The Economist 2018). However, this should be interpreted carefully because most countries (11 out of 19) obtained over 80 in domain 2, and Vietnam ranked 10th among them. Furthermore, it is pointed out that, even though some PPP institutions were established, their capacity and institutional knowledge are low and are passive to play a coordinating role (the role is also unclear) (The Economist 2018; APEC 2018).
(Regulatory framework)
The regulatory framework in Vietnam also has many rooms to be improved even though the Vietnamese government put much effort into improving it, as explained below.
• The concept of PPP was included in Vietnamese 2013 Bidding Law, 2014 Construction Law, 2014 Public Investment Law, and 2014 Investment Law (APEC 2018).
§ In addition, Vietnam Decree 15 came into effect in 2015. It aimed to promote PPP project by replacing the largely unimplemented regulation for BOT, BTO and BT project under former Decree 108.19 (ESCAP 2017b). Decree 15 is currently replaced by Decree 63 in 2018, which aims to improve and simplify the investment procedures, as well as enhance the project's management and so on (Bang and Nghia 2018).
§ The government’s circular No.02 in 2016 provided guidance for project selection, appraisal of PPP.
§ In addition, the government of Vietnam provides various beneficial tax schemes to incentivize private participation; such as tax exemption and reduction for BOT companies (Alfen et al. 2009).
However, many pieces of literature point out the inefficiency of PPP regulatory framework in Vietnam (APEC 2018; The Economist 2018; Kim and Poensgen 2019; Foster 2019). For example, the complexity of the legal structure of PPP, which have many layers (such as laws, ordinances, decrees, circulars), make it difficult to fully understand the overall picture of the regulatory framework of PPP in Vietnam (The Economist 2018). The other problem is the inconsistency of regal framework. The PPP activities in Vietnam follows mainly the series of decrees. However, the lack of standalone PPP law causes the inconsistency of the regulatory framework, the contradiction between law and decrees. Because the individual laws take precedence the provisions in the PPP
decrees, this inconsistency hinders the efficient implementation of PPP regulatory framework (APEC 2018; The Economist 2018; Foster 2019)8.
Also, the risk-sharing scheme is not sufficient in Vietnam (The Economist 2018; Kim and Poensgen 2019). Although there are the scheme of government guarantee and undertakings (GGU) in Vietnam, the condition for it is getting stricter and risk-sharing mechanism is unclear (Ohya et al. 2019; Kim and Poensgen 2019). This unavailability of risk-sharing scheme is regarded as one of the major hindrances for investors to invest infrastructure project because it makes it difficult to establish the appropriate risk allocation between the public sector and the private sector (Ohya et al. 2019).
Overall, the institutional and regulatory framework in Vietnam are still weak. Especially, its regulatory framework has much room to be improved. Infrascope index in the regulatory domain is significantly small (regulatory domain 61: overall 66). Also, Procuring Infrastructure PPPs scores are relatively smaller compared to other higher scored countries, such as the Philippines and India. (What did bring the increase of PPI in Vietnam?)
There are two possible reasons why PPI in Vietnam increased despite its weak regulatory framework. One is an existence of matured institutional framework, and the other is the preferable environment for the electricity sector.
The presence of matured institutional framework is the premise of overall transparency, accountability, and appropriate implementation of PPP regulatory framework (The economist, 2018). In this sense, the strong institutional environment enables the country to seek successful PPP projects without having top-level regulation for PPP, in other words, institutional performance tends to be linked to overall PPP performance. However, this theory cannot explain why the countries, which have the same or higher Infrascope score, did not attract more PPI9.
The other explanation is that the reforms to provide favorable environment for promoting investment in electricity project attract FDI in Vietnam.
Historically, Electricity of Vietnam (EVN), which is a SOE in Vietnam, is the biggest buyer of electricity and have a monopoly on electricity distribution and transmission, under the supervision of the Ministry of Industry and Trade (MOIT) (ESCAP 2017a). However, Vietnam's rapid
industrialization required more electricity and EVN became not to be capable to provide sufficient electricity. As a matter of fact, Vietnam's energy consumption has increased at an average 15 percent in recent years, which is significantly higher than Vietnamese economic growth rate (Nhi 2014). The lack of electricity can be a significant hindrance to economic activities so that the
8 The Law on PPP is now being drafted and expected to be adopted in the near future (possibly in May
2020) to provide a comprehensive and consolidated PPP framework (Kim and Poensgen 2019; DFDL 2019).
9 For example, Thailand (97 in Infrascope domain 2) and Pakistan (88) have a higher score than
Vietnam (84), but less PPI in the average from 2006 to 2015 (1389 million USD for Thailand, 1000 for Pakistan, 837 for Vietnam).
Vietnamese government implemented a series of reforms in order to attract private investment in the electricity sector to expand its capacity.
Liberalization of electricity started in 2004 with the passing of the Electricity Law, intended to ensure the sustainable development of the sector to satisfy the growing electricity need (The World Bank 2018). The major reforms in electricity sector are;
• The restructuring of EVN
The restructuring of EVN is one of the main key steps towards a competitive electricity market. EVN is converted into a shareholding company which allows foreign private investors to become its shareholders, aiming to create business-oriented
enterprises and to attract private finance instead of government subsidies. (ESCAP 2017a). • Preferential treatment of GGU
Under the decision 2414/QD-TTg in December 2013, the thermal power plants can acquire preferential treatments, including government guarantee and undertakings (GGU) (Ohya et al. 2019). As discussed above, the risk-sharing scheme (GUU) does not work in other infrastructure sectors, but it is much easier for the electricity sector to receive GUU (Ohya et al. 2019; The World Bank 2018).
• Incentives of feed-in tariffs
In addition, renewable energy sector is also increasing with the Vietnamese government's strong support. For example, feed-in tariffs of renewable energy are relatively higher than other measures (0.0935 US$/kilowatt-hour for solar and 0.098 US$ for wind compared with 0.072 US$ for the average wholesale power generation cost) (The World Bank 2018).
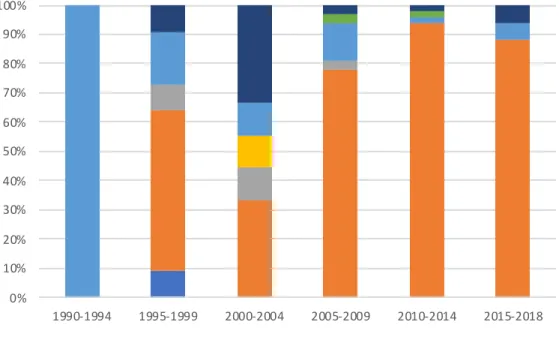
These reforms promoted private participation in the electricity sector. As shown in Figure 3, the share of electricity sector among PPI in Vietnam increased from the 2000s (33% in 2000-2004 to 88% in 2015-2018).
Figure 3. The share of each sectors in terms of number of project (% of total)
(Source: Made by author by using PPI Database by the World Bank) The rapid growth of electricity generation capacity was mainly due to large thermal power plants financed by international investors (The World Bank 2018). As shown in Table 6, foreign investment increased much larger than that of domestic investment. Also, the number of projects with foreign investment is small, meaning the scale of the project is large. As a matter of fact, the average scale of projects with foreign investment is larger than that of domestic (314 million USD per project and 63 million USD per project respectively). For example, Duyen Hai 2 Thermal Power Plant project in 2017, which Malakoff Corporation Berhad from Malaysia financed, require 2.4 billion US$10.
This rapid increase of foreign investment was made by the beneficial environment for electricity sector along with the surge of FDI due to Vietnam's attractive location and rapid
economic growth (Alfen et al. 2009). This surge of FDI also attributes to various measures to attract FDI carried out by the Vietnamese government, ranging from the provision of a legal framework to improving the investment environment as a whole (Vo and Nguyen 2012). For instance, the Law on Foreign Investment was first introduced in 1987 and has been amended several times, reflecting the improvement of the legal framework for FDI promotion in Vietnam. At the same period, the country gradually has relaxed regulations on registration procedures, restrictions on foreign trade, access to land, capital, and foreign exchanges, and initiated tax incentives to promote FDI (Vo and Nguyen 2012). For example, Vietnam does not have equity limit of foreign investment so that foreign investors are treated in the same way with domestic investors (JETRO 2019a).
10 This is the biggest project in Vietnam since PPI data collection started in 1990.
0% 10% 20% 30% 40% 50% 60% 70% 80% 90% 100% 1990-1994 1995-1999 2000-2004 2005-2009 2010-2014 2015-2018
In terms of FDI restrictiveness index and FDI attractiveness index, FDI restrictiveness index decreased, especially in electricity sector (0.01 in 2018) (Table 7). This is significantly small
compared to other four countries, while FDI attractiveness index is still smaller than Malaysia (Table 5).
Table 6. Total Investment (million US$) (and the number of project) of PPI11
(Source: Made by author by using PPI Database by the World Bank) Table 7. FDI restrictiveness index in Vietnam
(Source: made by author from OECD(n.d.)) Overall, Vietnam does not have a significant regulatory and institutional framework, and the risk-sharing scheme does not work. However, the rapid growth in PPI in electricity sector and relaxed restriction combined with various promotion policy suggest that preferable environment for the electricity sector attracts rapidly increasing FDI, resulting in a steady increase in overall PPI, regardless of poor regulatory and institutional framework for PPP.
11 Foreign investment means infrastructure project with participation of foreign firms so that part of
investment may come from domestic company. It means the whole investment is not necessarily comes from foreign firms.
1990-1994 1995-1999 2000-2004 2005-2009 2010-2014 2015-2018
Domestic 0 0 0 715 (11) 2180 (42) 686 (4)
Foreign 10 (1) 734 (11) 2710 (9) 1250 (9) 3937 (6) 5479 (9)
Not Mentioned 0 0 0 340 (10) 136 (2) 153 (3)
Total 10 (1) 734 (11) 2710 (9) 2304 (30) 6253 (50) 6318 (16)
FDI restrictiveness index
Sector / Industry 1997 2003 2010 2018 Primary 0.72 0.404 0.361 0.061 Secondary 0.576 0.286 0.099 0.022 Electricity 0.31 0.25 0.054 0.01 Tertiary 0.714 0.542 0.405 0.225 Transport 0.932 0.869 0.735 0.528 Media 0.62 0.55 0.52 0.408 Communications 0.62 0.55 0.633 0.583
Real estate investment 0.87 0.725 0.645 0.237
Total FDI Index 0.671 0.435 0.3 0.13
3.2 INDIA
Figure 4 shows the amount of PPI investment from 1990. PPI in the 1990s seems very small in the graph but the average PPI of the 1990s is relatively large in Asian countries because the average investment in the 1990s is 1259 million US$, which is close to that of Vietnam in the 2010s (1434 million US$). In the 2000s, India experienced tremendous growth in PPI. In 2010, India’s PPI reached its peak, about 50 billion US$. That investment is the highest level that any developing country invested in any giving year from 1990 (The World Bank 2011). As a matter of fact, India alone accounted for about 40% of the total PPI projects in developing countries in 2010 (The World Bank 2011). Since 2010, infrastructure investment with private participation dropped year by year. However, India still accounts for significant share of PPI in the world.
In terms of sector invested, although the road sector's share is increasing and accounts larger share, the electricity sector keeps a large share of investment, which accounts for 44% from 2015 to 2018 (Figure 5).
In terms of the share of private finance in infrastructure investment, the private sector still plays significant role despite its share is slightly decreasing (the share was highest in 2008 (37% of total investment), and currently 25% of total investment in 2018).
Figure 4. PPI in India (Source: Made by author from PPI Database by the World Bank) 0 10000 20000 30000 40000 50000 60000 19 90 19 91 19 92 19 93 19 94 19 95 19 96 19 97 19 98 19 99 20 00 20 01 20 02 20 03 20 04 20 05 20 06 20 07 20 08 20 09 20 10 20 11 20 12 20 13 20 14 20 15 20 16 20 17 20 18 PP I (mi lli on U SD)
Figure 5. The share of each sectors in terms of number of project (% of total) (Source: Made by author from PPI Database by the World Bank) (Economic profile of India)
India has been one of the fastest growing countries in the world. In the late 2000s, the growth rate in India reached 7.5%, which doubled the average income in India in a decade. Today, although per capita income is small, India has become a six-largest economy in the world. Also, there has been a positive improvement in most of the indicators such as domestic savings and domestic capital (Sahoo and Dash 2009).
Before 1991, the Indian economy was stagnant because of its centralized economic planning with extensive regulatory controls by the government over the economy, in other words, inward-looking import substitution model of development (Wadhva 2004).
However, since 1991, the series of reforms in India started to liberalize its economy and expand the role of private and foreign investment (Sahoo and Dash 2009). The reforms conducted in the area of trade, industry, infrastructure, finance, and FDI (Wadhva 2004). The aim of these reforms was to open India’s markets to international competition, encourage private investment and participation in various sectors including infrastructure, to admit access to foreign capital and attract them to promote economic growth (Wadhva 2004).
(Promotion of Private Participation in India)
As India continues its economic growth, they face large gaps in the supply and demand of its infrastructure (Asian Infrastructure Investment Bank 2006). Growing economy increased industrial activity, population growth and immigration to urban areas led to an enormous demand for better quality and coverage of infrastructure services (Asian Infrastructure Investment Bank 2006). 0% 10% 20% 30% 40% 50% 60% 70% 80% 90% 100% 1990-1994 1995-1999 2000-2004 2005-2009 2010-2014 2015-2018
The weak infrastructure is regarded as one of the hinderance of development in India (Sahoo and Dash 2009; Asian Infrastructure Investment Bank 2006). In almost all infrastructure indicator, such as electric power consumption per capita, paved roads, or rail route per sq.km, lag behind many of other developing countries in Asia (Sahoo and Dash 2009). (Asian Infrastructure Investment Bank 2006) estimated that these deficits of infrastructure cost India 1-2% growth in GDP every year.
In order to keep its growth, it is essential to strengthen infrastructure facilities (Sahoo and Dash 2009), however, there is a huge gap between the demand and the supply. For example, the government of India estimates that India needs 4.5 trillion US$ for necessary infrastructure
investment through 2040, which is considerably more than India's GDP of 2.6 trillion US$ in 2017 (S & P Global 2018). Another estimate by Sahoo and Dash (2009) suggested that infrastructure sector currently attracts investment of around 5% of the gross domestic product (GDP), but it needs to be increased up to 10% to meet its increasing infrastructure demand.
Because of this, it is very difficult to fill this gap by the public sector alone due to its limited capacity to increase infrastructure investment. In addition to limited government's revenue restriction, their borrowing has also been capped by the Fiscal Responsibility and Budgetary Management Act (Asian Infrastructure Investment Bank 2006). Because of this, the government emphasized private sector participation to fill the infrastructure gap.
Strictly speaking, the beginning of PPP in India goes back to around 1900s, when private firms already started to invest railroad and power sector (Singh 2017). However, the boom of private infrastructure investment started in the 2000s. The Committee on Infrastructure (currently the Cabinet Committee on Infrastructure (CCI)) was established in 2004, which conducted a series of reforms to promote private investment in infrastructure projects.
(Institutional framework)
There are several institutions which support and promote PPP projects in India. In 2005, the PPP Appraisal Committee was established. The PPP Appraisal Committee is in charge of the process of scrutinizing, appraisals and project approvals (The Economist 2018; Ramakrishnan 2014). After that, the PPP Cell was established in 2006. The PPP Cell is located in the Department of Economic Affairs (DEA) under the Ministry of Finance, plays a central role in coordinating PPP projects, examining agreement from financial aspects (The Economist 2018; ESCAP 2017b) This PPP cells are also established at the local level (ESCAP 2017b). In addition, the government established supplemental institutions such as Empowered Committee for speeding up the approval process for PPP projects, Committee on knowledge management and dissemination for expanding PPP knowledge and procedures (WSP 2010).
There is also a kind of public relation scheme in India. The website for promoting PPP and providing related information of PPP project was also established. A database of PPP project is also available, which enable users to access the essential information on PPP project, such as
(Regulatory Framework)
In terms of the regulatory framework, a series of the amendment of related Laws has already started from the 1990s. For example, the government allowed private participation in the power sector in 1991, and the National Highways Act was amended in 1995 to empower private support (Singh 2017). In addition to legal framework, the government of India published guidelines for PPP project to clarify the regulatory framework and streamline PPP process (ESCAP 2017b).The model agreement of concession has also been developed by different ministries to support contract negotiation (ESCAP 2017b; WSP 2010).
These institutional and regulatory frameworks are regarded developed well compared to other Asian countries. For example, in the Infrascope index, India have relatively good score than average, regulation scores 77 (developed) and institutions 94 (matured) which ranks 4 and 3 respectively (The Economist 2018). In addition, the scores of Procuring Infrastructure PPPs are relatively higher than other Asian countries: Preparation (82), Procurement (72), Contract Management (80).
(What did bring the increase of PPI in India? (Successful PPI improvement until 2010) )
According to the PPI Database, India attracted most PPI project from 2008 to 2012. Among developing countries, India accounted for almost half of the investment in PPI projects during 2011 (Saha 2017).
Many pieces of literature regard this success as the result of encouraging policy, and initiatives for regulatory and institution which discussed above (Saha 2017; Telang and Kutumbale 2014).
In addition, from foreign investors' point of view, India is an attractive destination for FDI. Since the 1980s, India conducted a series of reforms to liberalize its economy, including reforms in FDI restriction, foreign exchange regulation, and taxation system (Gautam and Gautam 2014). As shown in Table 8, the FDI restrictiveness index decreased gradually, and the electricity and transport sector show significantly lower scores among others. Thermal power plant, renewable plant and, road and highway sector does not have FDI investment cap, and can enjoy other incentives such as tax break (Invest India 2020; Sinha 2010).
Table 8. FDI restrictiveness index in Vietnam
(Source: made by author from OECD(n.d.)) Futhermore, the increase of PPP projects was promoted by the innovative financing support mechanism established by the government of India (Saha 2017). For example, the Viability Gap Funding (VGF) scheme was introduced in 2006. VGF is a special facility in order to sustain and enhance the financial viability of infrastructure projects which are justifiable economically but not viable commercially (Ramakrishnan 2014; WSP 2010; Asian Infrastructure Investment Bank 2006). It involves upfront grant aid of up to 20% of the project total cost for major PPP projects that are executed by a private sector developer who is chosen through competitive bidding (Ramakrishnan 2014; Asian Infrastructure Investment Bank 2006). In addition, India Infrastructure Finance Company Limited (IIFCL) was established in 2006 in order to provide long-term financial assistance to infrastructure projects, with either direct lending or refinance scheme. One of the objectives of IIFCL is to facilitate finance from long-term investors (such as pension funds and insurance
companies) and foreign investors (Chong and Poole 2013). IIFCL raises funds which are financed by both domestic and international investors and refinance these funds into the PPP projects. Also, IIFCL provides credit guarantee program to improve the credit rating of bonds issued by
infrastructure firms to AA or higher.Also, as with the case of Vietnam, India also does not
distinguish domestic and foreign investors so that foreign investor also can take advantage of these measures (JETRO 2019b).
Attractive environment for FDI accompanied with these incentive schemes successfully made infrastructure project attractive for private firms and contributed to the high competition in the PPP market in India (Verougstraete and Kang 2014). As depicted in Table 9, although domestic investment accounts for a large part of PPI, foreign investors also contributed to the increase of PPI until 2010. The PPI with foreign investors was 517 million US$ from 1990 to 1995, but increased dramatically to 18574 million from 2005 to 2009.
FDI restrictiveness index
Sector / Industry 1997 2003 2010 2018 Primary 0.488 0.463 0.313 0.213 Secondary 0.227 0.11 0.063 0.041 Electricity 0.15 0.13 0.05 0.064 Tertiary 0.638 0.597 0.412 0.314 Transport 0.45 0.37 0.271 0.093 Media 1 1 0.463 0.28 Communications 0.7 0.7 0.425 0.175
Real estate investment 1 1 1 0.95
Total FDI Index 0.48 0.418 0.283 0.209
Table 9. Total Investment (million USD) (and the number of project) of PPI
(Source: Made by author from PPI Database by the World Bank) (Some reasons for recent decline of PPI)
India experienced successful expansion of private investment in infrastructure in the 2000s, however, the amount of private investment began to decrease from 2010.
The limited financing capacity is one of the causes of the decline in infrastructure
investment in India. In terms of debt financing, Infrastructure Finance Company Limited (IIFCL) is an essential provider of finance of infrastructure projects (Verougstraete and Kang 2014; IDFC 2013). However, it has become difficult to obtain financial support from these facilities due to its bank balance sheets reaching its limit so that there is only little room left for them to provide additional financial investment in infrastructure (Verougstraete and Kang 2014).
There is also a limitation of availability of equity that has been providing the necessary finance for infrastructure project usually provided by the construction company (Verougstraete and Kang 2014). The government tightened its policy for equity requirement. For example, the
percentage of equity that developers need to invest before starting loan disbursement became 50% in most cases from 20-30% in the past, which brought additional financial cost on private firms12 (Verougstraete and Kang 2014; IDFC 2013).
These changes reduce the incentives of investment in infrastructure for private firms so that the amount of investment in infrastructure reduced.
An aggressive bidding also caused the decline of PPI. A lack of ability of forecasting and weaknesses in the process of bidding has resulted in aggressive bidding (The Economist 2018). Private firms bid aggressively on infrastructure project based on the overestimation of rapid traffic growth, and they avoid incorporating some risks to reduce cost (The Economist 2018). These create the loss of private firms. In addition, the lack of coordination within the government agencies leads to the delay in land acquisition, which causes delay of overall project implementation (The
Economist 2018). These increased risk of loss and private financing regarded infrastructure asset as risky asset and turned its funds into other sectors (Saha 2017).
12 In general, the finance structure of infrastructure projects consists of two main financial sources:
equity and debt. Debt generally requires lower returns than equity in the form of interest, so that investors prefer debt than equity (APMG 2016).
1990-1994 1995-1999 2000-2004 2005-2009 2010-2014 2015-2018 Domestic 1571 (7) 3168 (54) 6662 (71) 59751 (209) 113159 (391) 20224 (123) Foreign 517 (4) 6941 (28) 3622 (34) 18574 (50) 18451 (74) 3793 (41) Not Mentioned 125 (1) 269 (2) 1719 (4) 1596 (8) 2586 (4) 1000 (11) Total 2213 (12) 734 (84) 12002 (109) 79921 (267) 135195 (469) 25017 (175)
In summary, India experienced rapid expansion of PPI in the 2000s. In addition to the good institutional and regulatory framework, the financial support schemes such as IIFCL and VGF reduce the risk of investing infrastructure and relaxed FDI restriction promoted investment in
4. STUDY OF FAILURE CASES (PHILIPPINES AND MALAYSIA)
This section focuses on the case of Philippines and Malaysia. These two countries failed to increase PPI, 15% and - 58% growth from the 1990s to 2010s, respectively. As with the previous section, these two countries have different quality of regulatory and institutional framework of PPP. Philippines has a better framework of PPP, while Malaysia has an inferior framework.
The former chapter showed that the FDI is important in increasing PPI, and the example of Vietnam showed that the removing FDI restriction could promote infrastructure investment regardless of the country's quality of regulatory and institutional framework of PPP.On the other hand, Philippines and Malaysia were stagnant in PPP and showed higher FDI restriction in Table 5 compared to the former two countries. Following subsections discusses more detail about Philippine and Malaysia, focusing on PPP and FDI environment.
4.1 PHILIPPINES
Figure 6 depicts the amount of PPI investment in the Philippines from 1990 to 2018. The investment of PPI reaches its peak in 1997 and this is brought by two big water and sewage project; privatization of Manila water company and Maynilad Water Services. The PPI seems to be stagnant during the period, the average of PPI in the 1990s is 2036 million US$, 1545 million US$ in the 2000s, and 2328 million US$ in the 2010s. The growth rate of PPI from the 1990s to the 2010s is only 14%, significantly small compared to those of India (994%) and Vietnam (1827%).
Although the PPI was stagnant during the period, public expenditure on infrastructure increased. The government infrastructure investment was only 1.8% of GDP in 2010 (equivalent to 3.2 billion USD), but increased to 6.2% of GDP in 2018 (Padin 2019; Toledo 2016). This means the share of private investment is decreasing due to the growth of government expenditure on infrastructure. The estimation by Schuster et al. (2017) suggested that most of the funding for infrastructure comes from the government and only 27 % of them comes from private sector.
Figure 6. PPI in Philippines (Source: Made by author from PPI Database by the World Bank)
Figure 7. The share of each sectors in terms of number of project (% of total) (Source: Made by author from PPI Database by the World Bank) (Economic profile of Philippines)
The economy of the Philippines is growing rapidly these days. The average economic growth rate of the state is 6.2% per year from 2011 to 2017. According to the 2017 statistics by the International Monetary Fund, the nominal GDP of the country was the 34th largest in the world
0 2000 4000 6000 8000 10000 12000 19 90 19 91 19 92 19 93 19 94 19 95 19 96 19 97 19 98 19 99 20 00 20 01 20 02 20 03 20 04 20 05 20 06 20 07 20 08 20 09 20 10 20 11 20 12 20 13 20 14 20 15 20 16 20 17 20 18 PP I (mi lli on U SD) 0% 10% 20% 30% 40% 50% 60% 70% 80% 90% 100% 1990-1994 1995-1999 2000-2004 2005-2009 2010-2014 2015-2018
and 13th in Asia. The government of Philippine desires to keep this growth, and the strategic goal to continue its GDP growth of 7 to 8% per year and to reach the upper middle-income country group by 2022 was announced in the Philippine Development Plan 2017–2022.
(Insufficient infrastructure)
However, public investment, especially in infrastructure, is insufficient to meet these goals. Currently, the quantity and the quality of infrastructure are very poor compared to other Asian countries. In terms of the quantity, the government has underinvested in the infrastructure sector for decades (Schuster et al. 2017). The public capital stock of the Philippines at 35% of GDP, which is less than half of the average of the ASEAN countries (Schuster et al. 2017). In terms of the quality, the ranking of country’s infrastructure competitiveness was 97th place out of 137 countries, quite behind regional rivals such as Indonesia (52nd), Thailand (43th), and Malaysia (22nd) (World Economic Forum 2018).
This inferior infrastructure can be a bottleneck of the economic development and
considered as one of the top three “most problematic factors” in doing business in the Philippines (Schuster et al. 2017). These impede economic growth and it is necessary to ramp up infrastructure investment to achieve the targeted 7 to 8% economic growth which the government envisaged in the national development plan (Asian Development Bank 2018; Schuster et al. 2017). In addition, the country's expanding population, growing economy, and rapid urbanization accompanied by its archipelagic geography will require more infrastructure investment (Asian Development Bank 2018).
In order to address this challenge, Build, Build, Build (BBB) program was launched in 2017. This is a comprehensive infrastructure development program which aims to attract infrastructure investments, generate jobs, connect regions and promote economic growth (Schuster et al. 2017). Under the BBB program, the public infrastructure investment is required to increase up to 7.4 % of GDP by 2022 (Schuster et al. 2017).
However, it must be difficult to satisfy the massive need for infrastructure by public investment alone (Schuster et al. 2017). The additional revenue is necessary for the government to generate an extra budget to increase infrastructure investment, but this requires comprehensive tax reform (Schuster et al. 2017). Therefore, the need for private investment will be higher to ensure the achievement of BBB program (Schuster et al. 2017).
(Regulation and Institutional framework for Private participation)
After the collapse of the marital regime of the Marcos Administration, the privatization of public asset acquired during the martial regime and the movement of using the private sector has started. As a part of this process, a series of reforms to promote PPP also has started.
From the 1990s, the government of the Philippines recognized the importance and benefits of private participation in infrastructure investment across different sectors. So that the Philippines has more than 20 years experiences in PPP and the first country to give a legal framework to PPP in Asia (ESCAP 2017b).