Ef
ficacy of shear wave elastography for assessment of
liver function in patients with heart failure
Rie Nakayama
, Yoichi Takaya*, Kazufumi Nakamura, Norihisa Toh and Hiroshi Ito
Department of Cardiovascular Medicine, Okayama University Graduate School of Medicine, Dentistry and Pharmaceutical Science,2-5-1 Shikata-cho, Kita-ku, Okayama, 700-8558, Japan
Abstract
Aims Liver dysfunction is important for prognosis in heart failure (HF). Shear wave elastography (SWE), which is a novel ul-trasound technique for charactering tissues, has been used in liver diseases. However, clinical implication of SWE, including dispersion slope, remains unknown in heart diseases. This study aimed to evaluate the efficacy of SWE assessing liver function in the severity of HF.
Methods and results We enrolled 316 consecutive patients with or suspected heart diseases, who were classified according to the American College of Cardiology Foundation/American Heart Association stage of HF, including 37 with Stage A, 139 with Stage B, 114 with Stage C, and 26 with Stage D, and 45 normal subjects. Elasticity and dispersion slope of shear wave were assessed according to the HF stage. Elasticity and dispersion slope were not elevated in normal subjects and patients with Stage A. Elasticity was slightly increased from Stage A to Stage C and was remarkably elevated in Stage D (normal: 5.2 ± 1.1 kPa, Stage A: 5.4 ± 1.2 kPa, Stage B: 6.4 ± 1.8 kPa, Stage C: 7.8 ± 3.5 kPa, and Stage D: 17.7 ± 12.7 kPa), whereas dispersion slope was gradually increased from Stage A to Stage D (normal: 9.7 ± 1.7m/s/kHz, Stage A: 10.4 ± 1.6m/s/kHz, Stage B: 11.7 ± 2.4m/s/kHz, Stage C: 13.2 ± 3.4m/s/kHz, and Stage D: 17.6 ± 5.6 m/s/kHz). In the early HF stage, dispersion slope was elevated. In the advanced HF stage, both elasticity and dispersion slope were elevated. Liver function test abnormalities were observed only from Stage C or Stage D.
Conclusions Dispersion slope could detect early liver damage, and the combination of elasticity and dispersion slope could clarify the progression of liver dysfunction in HF. SWE may be valuable to manage therapeutic strategies in patients with HF.
Keywords Shear wave elastography; Elasticity; Dispersion slope; Liver dysfunction; Heart failure Received:14 December 2020; Revised: 11 February 2021; Accepted: 11 March 2021
*Correspondence to: Yoichi Takaya, Department of Cardiovascular Medicine, Okayama University Graduate School of Medicine, Dentistry and Pharmaceutical Science,2-5-1 Shikata-cho, Kita-ku, Okayama700-8558, Japan. Tel: +81-86-235-7351; Fax: +81-86-235-7353. Email: [email protected]
Introduction
Heart failure (HF) is a clinical syndrome that leads to multiple organ injuries, including liver dysfunction. Cardiohepatic in-teraction has been reported to associate with a poor progno-sis in patients with HF.1–3Passive hepatic congestion due to increased central venous pressure causes liver dysfunction, which presents as an abnormality called nutmeg liver on pathological examination.4–6The management of HF in the early stage, prior to the progression of liver dysfunction, is important to improve clinical outcomes.
Shear wave elastography (SWE) is a novel ultrasound tech-nique that is used to assess tissue characteristics based on
shear wave propagation velocity, which provides quantitative estimates of tissue elasticity and viscosity.7–10Shear wave is generated by inducing a push pulse of ultrasound wave, which deforms a part of the tissue. The velocity of shear wave within the tissue is detected by tracking pulse. SWE can be used to measure two parameters such as elasticity of shear wave, which is related to the tissue hardness, and dispersion slope of shear wave, which reflects the tissue viscosity.11,12
Shear wave elastography has been used to evaluate liver diseases, including fatty liver, hepatitis, and cirrhosis. Elastic-ity is correlated with the degree of fibrosis.13,14 Dispersion slope is associated with inflammation, necrosis, and
O R I G I N A L R E S E A R C H A R T I C L E
© 2021 The Authors. ESC Heart Failure published by John Wiley & Sons Ltd on behalf of European Society of Cardiology.
This is an open access article under the terms of the Creative Commons Attribution-NonCommercial License, which permits use, distribution and reproduction in any medium, provided the original work is properly cited and is not used for commercial purposes.
ESC Heart Failure (2021)
steatosis.15–17A few recent studies in thefield of heart dis-eases have reported that elasticity measured on the liver is related to adverse outcomes in patients with HF.18However, the clinical implication of SWE has not been well investigated in patients with HF. Especially, the clinical significance of dis-persion slope remains unknown.
Hepatic congestion results in compression of the bile can-aliculi and ductules, causing necrosis of liver cells. Persistence of HF extends the liver cells necrosis, contributing to liver fibrosis.19
Therefore, we hypothesized that dispersion slope, which reflects the viscosity, is sensitively elevated in the early stage of HF to reflect hepatic congestion and that the combi-nation of elasticity and dispersion slope is useful to clarify the progression of liver dysfunction in patients with HF. The aim of this study was to evaluate the efficacy of SWE for assess-ment of liver function in patients with different severities of HF.
Methods
Study population
We prospectively enrolled 316 consecutive patients with con-firmed or suspected heart diseases and 45 normal subjects who underwent SWE in Okayama University Hospital from March 2018 to May 2020. Patients were classified according to the American College of Cardiology Foundation/American
Heart Association stage of HF.20 The stage of HF was diagnosed based on medical history, symptoms, physical examinations, and clinical examinations, including electrocar-diogram, echocardiography, biomarker measurements, and chest X-ray. Normal subjects were defined as those with no history of heart diseases and no abnormalfindings on clinical examinations. Patients with a history or signs of liver diseases such as fatty liver, hepatitis, cirrhosis, and/or hepatic tumours and a history of alcohol abuse (≥20 g/day) were excluded. Pa-tients undergoing dialysis and those with congenital heart diseases were also excluded. All patients gave informed con-sent to undergo examination. The study was approved by the ethical committee of our institution.
Shear wave elastography
Shear wave elastography measurements for assessment of liver function were performed using Aplio i900 with a 3.5 to 5.0 MHz convex probe (Canon Medical Systems, Otawara, Japan) at the time of outpatient clinic or at discharge from HF treatment. SWE was obtained on the right lobe of the liver through the intercostal spaces at the end-expiratory period in the supine position. Patients were requested to hold their breath during the acquisition. The grey-scale image was opti-mized for the best acoustic window and best gain setting. A sample box of 2.0 × 2.0 cm was placed on the grey-scale im-age at a depth of 1.0 to 1.5 cm from the liver capsule to avoid reverberation artefacts and intrahepatic vessels. A
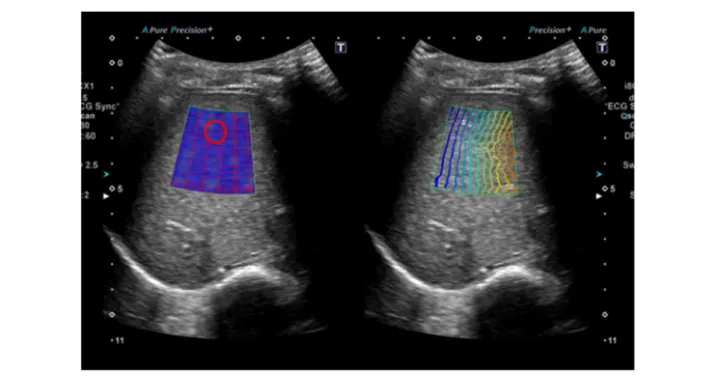
Figure 1 Shear wave elastography. Shear wave elastography was performed on the right lobe of the liver through intercostal spaces. A sample box of
1.0-cm-diameter circular region of interest was placed on the propagation map and exhibited smooth and parallel lines (Figure1).11,21SWE measurements were performed 10 times in each patient, and the average elasticity and dispersion slope of shear wave were calculated.
Clinical assessments
Transthoracic echocardiography was performed at the same time as the SWE measurements. Left ventricular (LV) end-diastolic diameter, LV end-systolic diameter, LV ejection fraction, LV mass index, left atrial volume index, early dia-stolic mitral inflow velocity to mitral annular velocity ratio (E/e′), tricuspid regurgitation pressure gradient, and inferior vena cava diameter were measured. Furthermore, we evalu-ated right atrial (RA) size by measuring RA area in the apical four-chamber view. Liver function tests were also performed, including measurement of aspartate aminotransferase (AST), alanine aminotransferase (ALT), alkaline phosphatase (ALP), γ-glutamyl transpeptidase (GGT), bilirubin, cholinesterase, al-bumin, and prothrombin time levels. Haemoglobin, plasma B-type natriuretic peptide, and serum creatinine levels were also measured.
Cardiac catheterization was performed in 94 of the 316 pa-tients, based on the judgement of physicians. Pulmonary ar-tery wedge pressure, mean pulmonary arar-tery pressure, systolic right ventricular pressure, RA pressure, cardiac out-put, and cardiac index were obtained. The measurements were determined at the end-expiratory period, with an aver-age offive cycles. Cardiac output and cardiac index were cal-culated using the Fick equation.
Variability
Inter-observer and intra-observer differences were analysed in 20 randomly selected images. SWE was evaluated by two blinded observers and by a single observer at two different times. Reliability was calculated using Pearson’s correlation coefficient. Variability was calculated as the percentage error of each measurement and derived as the difference between the measurements divided by the mean value.
Statistical analysis
Data are presented as mean ± standard deviation for contin-uous variables and as number and percentage for categorical variables. The analysis of variance or the Wilcoxon rank-sum test was used to explore differences for continuous variables between the groups. Theχ2test was used to compare for cat-egorical variables. The cut-off values of elasticity and disper-sion slope for the HF stage were estimated using receiver operating characteristic curve. Pearson’s correlation
coefficient was calculated to identify the relationship be-tween SWE and clinical parameters. Statistical analysis was performed with statistical software (JMP Version 14.0; SAS Institute Inc., Cary, NC, USA), and significance was defined as a P value of<0.05.
Results
Clinical characteristics
The study population consisted of 316 patients, including 37 with Stage A, 139 with Stage B, 114 with Stage C, and 26 with Stage D, and 45 normal subjects. The mean age of all patients was 66 ± 16 years. Comparisons of clinical characteristics be-tween the groups are shown in Table1. As the HF stage ad-vanced, age was increased, and body mass index was decreased. The prevalence of hypertension and dyslipidaemia was higher in Stages A–C. Atrial fibrillation was observed more frequently in Stage D. LV end-diastolic diameter and LV end-systolic diameter were increased, and LV ejection fraction was decreased in Stages C and D. E/e′ ratio and left atrial volume index were increased in Stages B–D. Tricuspid regurgitation pressure gradient and inferior vena cava diam-eter were higher in Stage D.
Shear wave elastography
The values of SWE for each group were shown in Figure 2. Elasticity of shear wave was 5.2 ± 1.1 kPa in normal subjects, 5.4 ± 1.2 kPa in patients with Stage A, 6.4 ± 1.8 kPa in patients with Stage B, 7.8 ± 3.5 kPa in patients with Stage C, and 17.7 ± 12.7 kPa in patients with Stage D. Dispersion slope of shear wave was 9.7 ± 1.7 m/s/kHz in normal subjects, 10.4 ± 1.6 m/s/kHz in patients with Stage A, 11.7 ± 2.4 m/s/ kHz in patients with Stage B, 13.2 ± 3.4 m/s/kHz in patients with Stage C, and 17.6 ± 5.2 m/s/kHz in patients with Stage D. Elasticity and dispersion slope were not elevated in normal subjects or those with Stage A. Elasticity was slightly in-creased from Stage A to Stage C and was remarkably elevated in Stage D. Dispersion slope was gradually increased from Stage A to Stage D. In the early stage of HF, dispersion slope was elevated. In the advanced stage of HF, both elasticity and dispersion slope were increased. The cut-off value of disper-sion slope between Stages A and B was 11.5 m/s/kHz, with area under the curve of 0.68, sensitivity of 56%, and speci fic-ity of 79%, and the cut-off value between Stages B and C was 12.9 m/s/kHz, with area under the curve of 0.62, sensitivity of 50%, and specificity of 76%. The cut-off value of elasticity be-tween Stages C and D was 14.6 kPa, with area under the curve of 0.79, sensitivity of 50%, and specificity of 95%.
Efficacy of shear wave elastography in patients with HF 3
ESC Heart Failure (2021)
Table 1 Clinical characteristics
Variables
Normal Stage A Stage B Stage C Stage D
P
(n = 45) (n = 37) (n = 139) (n = 114) (n = 26)
Age (years) 51 ± 17 64 ± 13 66 ± 16 71 ± 11 71 ± 9 <0.01
Male 18 (40%) 18 (49%) 74 (53%) 53 (47%) 16 (62%) 0.37
Body mass index (kg/m2) 22.4 ± 3.4 22.8 ± 4.0 22.6 ± 3.5 22.7 ± 4.1 19.8 ± 2.6 <0.01
Hypertension 0 (0%) 24 (65%) 62 (45%) 47 (41%) 5 (19%) <0.01
Dyslipidaemia 0 (0%) 23 (62%) 62 (45%) 52 (46%) 8 (31%) <0.01
Diabetes mellitus 0 (0%) 11 (30%) 32 (23%) 32 (28%) 8 (31%) <0.01
Atrialfibrillation 0 (0%) 0 (0%) 22 (19%) 18 (20%) 10 (38%) <0.01
Heart diseases
Ischaemic heart disease 0 (0%) 0 (0%) 40 (29%) 15 (13%) 5 (19%) <0.01
Cardiomyopathy 0 (0%) 0 (0%) 25 (18%) 71 (62%) 13 (50%) <0.01 Valvular disease 0 (0%) 0 (0%) 16 (12%) 21 (18%) 4 (15%) <0.01 Echocardiography LV end-diastolic diameter (mm) 44 ± 3 44 ± 4 46 ± 6 53 ± 10 58 ± 10 <0.01 LV end-systolic diameter (mm) 28 ± 2 28 ± 4 31 ± 8 42 ± 12 46 ± 15 <0.01 LV ejection fraction (%) 64 ± 4 64 ± 5 60 ± 11 43 ± 17 40 ± 13 <0.01 LV mass index (g/m2) 70 ± 13 73 ± 15 94 ± 27 122 ± 35 131 ± 48 <0.01 E/e′ ratio 8.1 ± 2.1 9.6 ± 2.9 12.6 ± 6.5 17.3 ± 8.2 28.4 ± 13.1 <0.01
Left atrial volume index (mL/m2) 28 ± 5 29 ± 7 42 ± 23 56 ± 25 90 ± 53 <0.01
RA size (cm2) 12 ± 2 13 ± 3 17 ± 5 20 ± 9 25 ± 10 <0.01
Tricuspid regurgitation gradient (mmHg) 20 ± 5 20 ± 5 22 ± 7 26 ± 9 32 ± 15 <0.01
Inferior vena cava diameter (mm) 11 ± 3 10 ± 3 12 ± 5 13 ± 5 19 ± 8 <0.01
Laboratory AST (U/L) 22 ± 9 21 ± 9 23 ± 8 25 ± 9 35 ± 23 <0.01 ALT (U/L) 21 ± 11 19 ± 10 19 ± 11 20 ± 12 26 ± 16 0.21 ALP (U/L) 226 ± 89 214 ± 82 235 ± 86 243 ± 119 303 ± 83 <0.01 GGT (U/L) 28 ± 31 34 ± 21 30 ± 22 50 ± 52 103 ± 75 <0.01 Total bilirubin (mg/dL) 0.8 ± 0.6 0.6 ± 0.3 0.7 ± 0.3 0.8 ± 0.3 1.4 ± 0.9 <0.01 Cholinesterase (U/L) 310 ± 72 316 ± 94 294 ± 48 271 ± 80 224 ± 80 0.04 Albumin (g/dL) 3.9 ± 0.7 3.9 ± 0.5 4.0 ± 0.5 3.9 ± 0.5 3.6 ± 0.4 0.36 Prothrombin time (s) 10.4 ± 0.6 10.4 ± 0.5 10.6 ± 1.2 11.0 ± 1.4 11.0 ± 0.6 0.16 Haemoglobin (g/dL) 12.6 ± 2.0 12.8 ± 1.1 12.8 ± 1.8 12.7 ± 2.0 11.8 ± 1.6 0.88 Creatinine (mg/dL) 0.7 ± 0.2 0.8 ± 0.2 0.9 ± 0.5 1.1 ± 0.5 1.6 ± 1.5 <0.01
B-type natriuretic peptide (pg/mL) 17 ± 13 30 ± 19 121 ± 137 456 ± 580 762 ± 789 <0.01
ALP, alkaline phosphatase; ALT, alanine aminotransferase; AST, aspartate aminotransferase; E/e′, early diastolic mitral inflow velocity to mitral annular velocity ratio; GGT,γ-glutamyl transpeptidase; LV, left ventricular; RA, right atrial.
Data are presented as mean ± standard deviation or number (%) of patients.
Figure 2 Elasticity and dispersion slope of shear wave according to the American College of Cardiology Foundation/American Heart Association stage
of heart failure. Elasticity was remarkably elevated in Stage D, whereas dispersion slope was gradually increased from Stage A to Stage D. P< 0.01 for the analysis of variance amongfive groups.
Liver function parameters
Liver function test parameters, including AST, ALT, ALP, GGT, and bilirubin levels, were normal value in patients with Stage B, whereas an elevation of dispersion slope was observed. Only GGT level was increased from Stage C. In patients with Stage D, ALP level was increased, and cholinesterase was de-creased (Table1).
Haemodynamic measurements
Cardiac catheterization was performed in 21 patients with Stage B, 56 with Stage C, and 17 with Stage D (Table2). Pul-monary artery wedge pressure, mean pulPul-monary artery pres-sure, systolic right ventricular prespres-sure, and RA pressure were increased from Stage B to Stage D. RA pressure was weakly correlated with elasticity (r = 0.36, P< 0.01).
Relationships of shear wave elastography with
clinical parameters
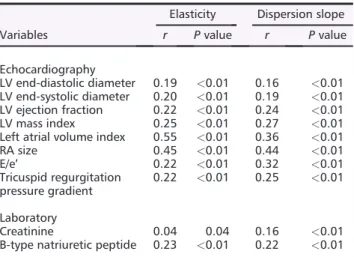
Elasticity and dispersion slope were correlated with LV end-diastolic diameter, LV end-systolic diameter, LV ejection fraction, LV mass index, left atrial volume index, E/e′, tricus-pid regurgitation pressure gradient, and RA size. Plasma B-type natriuretic peptide and serum creatinine levels were also correlated with elasticity and dispersion slope (Table3).
Reproducibility
There was good agreement in the measurements of elasticity between the two blinded observers (r = 0.91, P< 0.01) and for the intra-observer (r = 0.96, P < 0.01). The inter-observer and intra-observer variabilities for the value of elasticity were 6.6% and 5.8%, respectively.
Discussion
The majorfindings of the present study were as follows: (i) elasticity of shear wave was remarkably elevated in patients
with Stage D, whereas dispersion slope of shear wave was gradually increased from Stage A to Stage D; and (ii) an eleva-tion of dispersion slope was observed prior to the occurrence of liver function tests abnormalities. SWE, including elasticity and dispersion slope, can be used to effectively detect liver damage in the early stage of HF and to assess the progression of liver dysfunction in patients with HF. To the best of our knowledge, this is the first study to show the efficacy of SWE with combined measurement of elasticity and disper-sion slope in patients with HF.
Liver dysfunction in heart failure
Heart failure causes liver dysfunction, which results in worse outcomes. Liver function parameters are used to assess three conditions: cholestasis, which is reflected by ALP, GGT, and bilirubin; hepatocyte integrity, which is reflected by AST and ALT; and liver function mass, which is reflected by cholines-terase, albumin, and prothrombin time levels. Liver function tests play an important role in the prediction of mortality in patients with HF,1,2but abnormalities in the previously men-tioned parameters are often not observed unless HF is advanced.22 In the present study, almost liver function pa-rameters were not changed in Stages A–C. An increase in
Table 2 Haemodynamic measurements
Variables
Stage B Stage C Stage D
P
(n = 21) (n = 56) (n = 17)
Pulmonary artery wedge pressure (mmHg) 11 ± 4 12 ± 7 21 ± 7 <0.01
Mean pulmonary artery pressure (mmHg) 17 ± 4 20 ± 9 28 ± 10 <0.01
Systolic right ventricular pressure (mmHg) 27 ± 7 31 ± 12 45 ± 14 <0.01
Right atrial pressure (mmHg) 4 ± 3 6 ± 5 9 ± 5 <0.01
Cardiac output (L/min) 3.7 ± 1.5 3.6 ± 1.5 3.2 ± 0.8 0.58
Cardiac index (L/min/m2) 2.4 ± 0.8 2.3 ± 0.8 2.0 ± 0.4 0.35
Data are presented as mean ± standard deviation.
Table 3 Relationships of shear wave elastography with clinical
parameters
Variables
Elasticity Dispersion slope
r P value r P value Echocardiography LV end-diastolic diameter 0.19 <0.01 0.16 <0.01 LV end-systolic diameter 0.20 <0.01 0.19 <0.01 LV ejection fraction 0.22 <0.01 0.24 <0.01 LV mass index 0.25 <0.01 0.27 <0.01
Left atrial volume index 0.55 <0.01 0.36 <0.01
RA size 0.45 <0.01 0.44 <0.01 E/e′ 0.22 <0.01 0.32 <0.01 Tricuspid regurgitation pressure gradient 0.22 <0.01 0.25 <0.01 Laboratory Creatinine 0.04 0.04 0.16 <0.01
B-type natriuretic peptide 0.23 <0.01 0.22 <0.01
E/e′, early diastolic mitral inflow velocity to mitral annular velocity ratio; LV, left ventricular; RA, right atrial.
Efficacy of shear wave elastography in patients with HF 5
ESC Heart Failure (2021)
bilirubin level and a decrease in cholinesterase level were ob-served in Stage D. In the liver, 70% of the blood supply is de-pendent on the portal system, and 30% is delivered by the hepatic artery. Because blood is supplied from both systems, liver function test abnormalities are less likely to occur.19 Evaluation of liver damage using liver function parameters is difficult in the early stage of HF. Few methods are available to effectively diagnose early liver damage in patients with HF.
Shear wave elastography
Shear wave elastography provides information regarding elasticity of shear wave, which is calculated by shear wave speed, as well as dispersion slope of shear wave, which re-flects the frequency dependence of both speed and attenua-tion of shear waves in the viscous component.11,12,21SWE has been recognized as a useful method for assessing liver diseases.13–16,23,24 Elasticity is significantly increased in cirrhosis.13,14 Dispersion slope is more sensitively increased in hepatitis and fatty liver.15,16In thefield of heart disease, several studies have reported that elasticity is correlated with central venous pressure in acute phase of HF, which is asso-ciated with cardiac events.25–28 However, the usefulness of SWE has not been fully investigated in patients with HF. Ad-ditionally, because these studies have focused on only elastic-ity, the assessments of the clinical significance of dispersion slope are lacking.
The present study investigated the efficacy of both elas-ticity and dispersion slope in patients with different sever-ities of HF, including patients without HF and asymptomatic patients with HF. Thus, this study was able to clarify the graduated changes in elasticity and dispersion slope according to the stage of HF. Dispersion slope was el-evated in the early stage of HF, such as Stage B. In the ad-vanced stage of HF, such as Stage D, both elasticity and dispersion slope were increased with the remarkable eleva-tion of elasticity. Interestingly, dispersion slope was elevated prior to the appearance of liver function test abnormalities. When liver function test abnormalities occurred, both elas-ticity and dispersion slope were already increased. In pa-tients with HF, venous congestion initially leads to compress bile canaliculi and ductules in the liver. The persis-tence of this state causes necrosis of liver cells due to hypoperfusion,19 resulting in liver function test abnormali-ties. Dispersion slope may be able to detect the initial state of venous congestion in the liver. Therefore, SWE has a po-tential to diagnose liver damage more sensitively than liver function test. Based on these findings, the present study suggests that dispersion slope can be used to effectively de-tect early liver damage and that the combination of elastic-ity and dispersion slope distinguishes the degree of liver damage in patients with HF. In the present study, the sensi-tivity and specificity of SWE for identifying the stage of HF
were not high. However, we consider that SWE is useful to estimate the severity of HF, including the other clinical parameters.
Previous studies have reported that elasticity is strongly correlated with central venous pressure in patients with acute decompensated HF.25–27 The liver is enveloped by a non-elastic capsule. Increased central venous pressure causes an enlarged andfirm liver. Because elasticity reflects the tissue hardness, high value of elasticity is reasonable in the acute phase of HF. In the present study, elasticity was correlated with RA pressure, but the correlation was weak. As the reason, we consider that elasticity was measured at the time of outpatient clinic or at discharge from HF treat-ment, which was the chronic phase of HF. Elasticity is re flec-tive of central venous pressure and HF-induced liver fibrosis.29–31 In the chronic phase of HF, elasticity may be more strongly affected by liver fibrosis complicated by long-standing HF.
Clinical implications
Because liver dysfunction is a prognostic factor in patients with HF, it is important to diagnose early liver damage and the degree of liver dysfunction in clinical practice. SWE is a simple, objective, and non-invasive modality to assess liver function. The present study suggests that SWE can evaluate liver dysfunction from early stage to advanced stage of HF. Furthermore, SWE can become a novel technique with which to differentiate the stage of HF. Especially, dispersion slope may be effective for identifying Stage B. Because transition from Stage B to Stage C portends an increase in mortality risk,32the determination of Stage B is important for the pre-vention of HF.33In the clinical setting, SWE can provide infor-mation for the progression of HF and may be effective for establishing therapeutic strategies of HF. Furthermore, SWE may be useful to judge the effects of HF therapies.
Study limitations
There are several limitations in the present study. First, the number of patients was relatively small for assessment of the usefulness of SWE in patients with HF. The number of pa-tients with each stage of HF was different. Larger studies are required to confirm our findings. Second, cardiac catheteriza-tion was not performed in all patients. Third, this study ex-cluded patients with liver disease, but this might have been insufficient. Liver biopsy was not performed for ethical rea-sons. SWE measurements might be affected by liver disease. Finally, the relationships between SWE parameters and histo-logicalfindings were not assessed.
Conclusions
Elasticity of shear wave was remarkably elevated in Stage D, whereas dispersion slope of shear wave was gradually in-creased from Stage A to Stage D. An elevation of dispersion slope occurred prior to the appearance of liver function tests abnormalities. Assessment of dispersion slope may be able to detect early liver damage in patients with HF. The combina-tion of elasticity and dispersion slope has the potential to clarify the progression of liver dysfunction. SWE may be valu-able for therapeutic management in patients with HF.
Con
flict of interest
None declared.Funding
This paper was written with no external funding.
References
1. Batin P, Wickens M, McEntegart D, Fullwood L, Cowley AJ. The importance
of abnormalities of liver function
tests in predicting mortality in chronic heart failure. Eur Heart J 1995; 16: 1613–1618.
2. Allen LA, Felker GM, Pocock S,
McMurray JJ, Pfeffer MA, Swedberg K, Wang D, Yusuf S, Michelson EL, Granger CB. Liver function abnormalities and outcome in patients with chronic heart failure: data from the Candesartan in Heart Failure: Assessment of Reduction in Mortality and Morbidity (CHARM)
program. Eur J Heart Fail 2009; 11:
170–177.
3. van Deursen VM, Damman K, Hillege HL, van Beek AP, van Veldhuisen DJ, Voors AA. Abnormal liver function in re-lation to hemodynamic profile in heart failure patients. J Card Fail 2010; 16: 84–90.
4. Hunt SA, Abraham WT, Chin MH, Feldman AM, Francis GS, Ganiats TG, Jessup M, Konstam MA, Mancini DM, Michl K, Oates JA, Rahko PS, Silver MA, Stevenson LW, Yancy CW. 2009 focused update incorporated into the ACC/AHA 2005 guidelines for the diagnosis and management of heart failure in adults: a report of the American College of Cardi-ology Foundation/American Heart
Asso-ciation Task Force on Practice
Guidelines developed in collaboration with the International Society for Heart and Lung Transplantation. J Am Coll
Cardiol 2009;53: e1–e90.
5. Naschitz JE, Slobodin G, Lewis RJ, Zuckerman E, Yeshurun D. Heart eases affecting the liver and liver dis-eases affecting the heart. Am Heart J 2000;140: 111–120.
6. Lau GT, Tan HC, Kritharides L. Type of liver dysfunction in heart failure and its relation to the severity of tricuspid re-gurgitation. Am J Cardiol 2002; 90: 1405–1409.
7. Sarvazyan AP, Rudenko OV, Swanson SD, Fowlkes JB, Emelianov SY. Shear
wave elasticity imaging: a new
ultrasonic technology of medical diag-nostics. Ultrasound Med Biol 1998; 24: 1419–1435.
8. Muller M, Gennisson JL, Deffieux T, Tanter M, Fink M. Quantitative visco-elasticity mapping of human liver using supersonic shear imaging: preliminary in vivo feasibility study. Ultrasound Med
Biol 2009;35: 219–229.
9. Chen S, Sanchez W, Callstrom MR, Gorman B, Lewis JT, Sanderson SO, Greenleaf JF, Xie H, Shi Y, Pashley M, Shamdasani V, Lachman M, Metz S. As-sessment of liver viscoelasticity by using shear waves induced by ultrasound
radi-ation force. Radiology 2013; 266:
964–970.
10. Chen S, Fatemi M, Greenleaf JF. Quanti-fying elasticity and viscosity from
mea-surement of shear wave speed
dispersion. J Acoust Soc Am 2004;115: 2781–2785.
11. Lee DH, Lee JY, Bae JS, Yi NJ, Lee KW, Suh KS, Kim H, Lee KB, Han JK.
Shear-wave dispersion slope from US
shear-wave elastography: detection of allograft damage after liver transplanta-tion. Radiology 2019;293: 327–333. 12. Sugimoto K, Moriyasu F, Oshiro H,
Takeuchi H, Abe M, Yoshimasu Y, Kasai Y, Sakamaki K, Hara T, Itoi T. The role of multiparametric US of the liver for
the evaluation of nonalcoholic
steatohepatitis. Radiology 2020; 296: 532–540.
13. Ferraioli G, Tinelli C, Dal Bello B, Zicchetti M, Filice G, Filice C. Accuracy of real-time shear wave elastography for assessing liver fibrosis in chronic hepatitis C: a pilot study. Hepatology 2012;56: 2125–2133.
14. Wong VW, Vergniol J, Wong GL, Foucher J, Chan HL, Le Bail B, Choi PC, Kowo M, Chan AW, Merrouche W, Sung JJ, Ledinghen V. Diagnosis of fibrosis and cirrhosis using liver stiffness measure-ment in nonalcoholic fatty liver disease.
Hepatology 2010;51: 454–462.
15. Barry CT, Mills B, Hah Z, Mooney RA, Ryan CK, Rubens DJ, Parker KJ. Shear
wave dispersion measures liver
steatosis. Ultrasound Med Biol 2012; 38: 175–182.
16. Barry CT, Hah Z, Partin A, Mooney RA, Chuang KH, Augustine A, Almudevar A, Cao W, Rubens DJ, Parker KJ. Mouse liver dispersion for the diagnosis of
early-stage fatty liver disease: a
70-sample study. Ultrasound Med Biol 2014;40: 704–713.
17. Sugimoto K, Moriyasu F, Oshiro H, Takeuchi H, Yoshimasu Y, Kasai Y, Furuichi Y, Itoi T. Visoelasticity measure-ment in rat livers using shear-wave US elastography. Ultrasound Med Biol 2018; 44: 2018–2024.
18. Taniguchi T, Ohtani T, Kioka H,
Tsukamoto Y, Onishi T, Nakamoto K, Katsimichas T, Sengoku K, Chimura M, Hashimoto H, Yamaguchi O, Sawa Y, Sakata Y. Liver stiffness reflecting right-sided filling pressure can predict adverse outcomes in patients with heart failure. JACC Cardiovasc Imaging 2019; 12: 955–964.
19. Nikolaou M, Parissis J, Yilmaz MB, Seronde MF, Kivikko M, Laribi S, Paugam-Burtz C, Cai D, Pohjanjousi P, Laterre PF, Deye N, Poder P, Cohen A, Mebazan A. Liver function abnormali-ties, clinical profile, and outcome in acute decompensated heart failure. Eur
Heart J 2013;34: 742–749.
20. Yancy CW, Jessup M, Bozkurt B, Butler J, Casey DE Jr, Drazner MH, Fonarow GC, Geraci SA, Horwich T, Januzzi JL, Johnson MR, Kasper EK, Levy WC, Masoudi FA, McBride PE, McMurray JJ, Mitchell JE, Peterson PN, Riegel B, Sam F, Stevenson LW, Tang W, Tsai EJ, Wilkoff BL. 2013 ACCF/AHA guideline for the management of heart failure: a report of the American College of Cardi-ology Foundation/American Heart
Asso-ciation Task Force on Practice
Guidelines. Circulation 2013; 128:
e240–e327.
21. Sugimoto K, Moriyasu F, Oshiro H, Takeuchi H, Yoshimasu Y, Kasai Y, Itoi T. Clinical utilization of shear wave
Efficacy of shear wave elastography in patients with HF 7
ESC Heart Failure (2021)
dispersion imaging in diffuse liver dis-ease. Ultrasonography 2020;39: 3–10. 22. Kubo SH, Walter BA, John DH, Clark M,
Cody RJ. Liver function abnormalities in chronic heart failure: influence of sys-temic hemodynamics. Arch Intern Med 1987;147: 1227–1230.
23. Tada T, Kumada T, Toyoda H, Ito T, Sone Y, Okuda S, Tsuji N, Imayoshi Y, Yasuda E. Utility of real-time shear wave elastography for assessing liver fibrosis in patients with chronic hepatitis C in-fection without cirrhosis: comparison of liverfibrosis indices. Hepatol Res 2015; 45: E122–E129.
24. Sasso M, Beaugrand M, de Ledinghen V, Douvin C, Marcellin P, Poupon R, Sandrin L, Miette V. Controlled attenua-tion parameter (CAP): a novel VCTE™ guided ultrasonic attenuation measure-ment for the evaluation of hepatic steatosis: preliminary study and valida-tion in a cohort of patients with chronic liver disease from various causes.
Ultra-sound Med Biol 2010;36: 1825–1835.
25. Taniguchi T, Sakata Y, Ohtani T, Mizote I, Takeda Y, Asano Y, Masuda M, Minamiguchi H, Kanzaki M, Ichibori Y, Nishi H, Tada K, Sawa Y, Komuro I. Use-fulness of transient elastography for noninvasive and reliable estimation of
right-sidedfilling pressure in heart fail-ure. Am J Cardiol 2014;113: 552–558. 26. Hopper I, Kemp W, Porapakkham P, Sata
Y, Condon E, Skiba M, Farber L, Porapakkham P, Williams TJ, Menahem S, Roberts S, Krum H. Impact of heart failure and changes to volume status on liver stiffness: non-invasive assess-ment using transient elastography. Eur
J Heart Fail 2012;14: 621–627.
27. Saito Y, Kato M, Nagashima K, Monno K, Aizawa Y, Okumura Y, Matsumoto N, Moriyama M, Hirayama A. Prognostic relevance of liver stiffness assessed by transient elastography in patients with acute decompensated heart failure. Circ
J 2018;82: 1822–1829.
28. Millonig G, Friedrich S, Adolf S, Fonouni H, Golriz M, Mehrabi A, Stiefel P, Poschl G, Buchler MW, Seitz HK, Mueller S. Liver stiffness is directly influenced by central venous pressure. J Hepatol 2010;52: 206–210.
29. Kutty SS, Peng Q, Danford DA, Fletcher SE, Perry D, Talmon GA, Scott C, Kugler JD, Duncan KF, Quiros-Tejeira RE, Kutty S. Increased hepatic stiffness as conse-quence of high hepatic afterload in the Fontan circulation: a vascular Doppler
and elastography study. Hepatology
2014;59: 251–260.
30. Nishi H, Toda K, Miyagawa S, Yoshikawa Y, Fukushima S, Kawamura M, Saito T, Yoshioka D, Daimon T, Sawa Y. Novel method of evaluating liver stiffness using transient elastography to evaluate perioperative status in severe heart fail-ure. Circ J 2015;79: 391–397. 31. Friedrich-Rust M, Koch C, Rentzsch A,
Sarrazin C, Schwarz P, Herrmann E, Lindinger A, Sarrazin U, Poynard T, Schafers HJ, Zeuzem S, Abdul-Khaliq H. Noninvasive assessment of liver fibro-sis in patients with Fontan circulation using transient elastography and
bio-chemical fibrosis markers. J Thorac
Cardiovasc Surg 2008;135: 560–567.
32. Ammar KA, Jacobsen SJ, Mahoney DW, Kors JA, Redfield MM, Burnett JC Jr, Rodeheffer RJ. Prevalence and prognos-tic significant of heart failure stages: ap-plication of the American College of Cardiology/American Heart Association heart failure staging criteria in the
com-munity. Circulation 2007; 115:
1563–1570.
33. Goldberg LR, Jessup M. Stage B heart failure: management of asymptomatic left ventricular systolic dysfunction.