Basic Characteristics of Small Island
Economies in the South Pacific : A Case Study
of Fiji
著者
RAM Vina, IWAKIRI Shigero
journal or
publication title
南海研紀要
volume
8
number
2
page range
170-205
URL
http://hdl.handle.net/10232/15698
Basic Characteristics of Small Island Economies
in the South Pacific —A Case Study of Fiji—
Vina RAM* and Shigero IWAKIRI**
Abstract
The small island economies of the South Pacific share several basic problem
due to their size and isolation. Many of these problem are multiplied bacause
of the small land masses, lack of basic mineral and industrial raw materials, distances from major metropolitan markets, small domestic markets, diseconomies of scale in production and so on.
Taking into account the basic characteristice of the small isolated island economies of the South Pacific such as maintaining traditional communal structures and a subsistence lifestyle together with varying degrees of industrial progress,
the present study therefore does not rely solely on modern economic theoretical
methodology for analysis of the structure of island economies and fishries, butadopts a wider prespective using the classical tools and principles of economic
and social progress.In this study, the general economics of the island societies have been analysed from the industrial development point of view, concentrating not only in areas of capitalistic and entreprenual development but also pointing out the presence
of opposite relations of the backward characteristics which are existing alongside
with this modernised economic system.Key words: Subsistence, Sugar, Monoculture, Colonialism, Industrialization.
(1) General Economic Characteristics
(i) Fiji Islands-General
Fiji is a maritime archipelagic country located between 10° and 25° south
* Institute of Marine Resources, Universty of the South Pacific
Scale In Kllomelres 0 50
j
•ITS f O4"
a Vill Lew -I8'S -I9*S I78"B Dua Day. DLlOll WATER * _ VVaAsya L,v"k,v30Ka/au ** ft KoroV
rKafca PI Hj) ONa/ra/ Gau SUVA V, /\T«im« KORO SEACjpWoa/a
J^ Totoyt T\Matuhu Figure I. Fiji Islands—(physical).•yv'nv
a Baityu OMago OCIdt I8'S-QjtaAeia Futagt %3 tfilatitude, and between 176° east and 178° west longitude. It consists of about
320 islands which make up a land area of 18,272 sq.km. Figure 1 gives the
geographical location of the island. The larger island are mainly of volcanic origin whereas the smaller islands are coral formations and have little productive
soil.
Nearly all the islands in the group are surrounded either by fringing or barrier
reef which from natural break waters from the ocean. With the declaration the
200 mile Excusive Economic Zone, Fiji's estimated sea area is about 1,134,700 sq.km. with territorial water of about 110,355 sq.km.
Fiji was ceeded to Great Britain in 1874 and had British Colonial Gavernment
for 96 years. Much the present socio-economic strutures reflect this colonial
influence, such as the political and constitutional systems, monocultural agriculture of sugar and coconuts, the multiracial nature of the island by introduction of
migrant labour from India and other Pacific island, and subordination to former
colonial porwers, i.e. Australia and New Zealand.
In 1983, the population was 677,481; 32% lived in urban areas of which
20% live in Suva. During the same year 60% of the total population fell in
the economically active age group (15-64) of which 20% were employed under wages and salaries (Bureau of Statistics, 1985 : 5,76)
Suger production remains the backbone of the country. Tourism and associated construction and private services have grown conciderably in the last decade and
this has accelerated the economic growth after independence. The manufacturing
sector has developed substantially in and attempt to reduce economic dependency on imports. Fiji's manufacturing sector now appears to be relatively more developed than other South Pacific islands.
On the other hand Fiji has very limited exploitable quantities of resources
for productive industrial development. Gold is being mined by an Australian
based company which exports raw gold to Australia. Copper deposits cannot
be economically mined under the present world copper prices. Insignificant
quantities of other minerals such as manganese and bauxite exist which are also uneconomical for industrial exploitation. Major economic resources are agricultural primary commodities such as sugar cane, cononuts, lumber, ginger, cocoa and
coffee.
Fiji has already felt several economic crises in relation to its exports of sugar
and copra with fluctuations in world prices of the commodities. Besides the
lack of basic resources for industrial development, there is a lack of adequate
domestic entreprenurship and capital. This is reflected by the dominance of
a household economy where there is litle incentive towards planned savings.
(ii) Economic Structure
Table 1. Gross domestic preiduct of Fiji
Current Prices
Year Cross Domestic Annual Estimated Per Capita Annual Growth Product at Growth Mid-Year GDP Rate of GDP Current Factor Rate of Populatio n Per Capita
Cost GDP ($ Million) (%) (000) ($) (%) 1950 36.0 - 288 125 _ 1953 50.8 12.2 318 160 8.6 1957 61.1 4.7 354 173 2.0 1962 90.2 8.1 421 214 4.3 1963 93.9 4.1 435 216 0.1 1964 99.6 6.1 449 222 2.8 1965 104.7 5.1 462 227 2.3 1966 108.8 3.9 474 230 1.3 1967 117.3 7.8 485 242 5.2 1968 129.6 10.5 495 262 8.3 1963 140.5 8.4 506 282 7.6 1970 168.9 20.2 521 324 14.9 1971 184.7 9.3 533 347 7.1 1972 230.5 24.8 544 424 22.2 1973 300.6 30.4 556 541 27.6 1974 410.5 36.6 565 727 34.3 1975 515.4 25.5 576 895 23.1 1976 570.6 10.7 585 975 8.9 1977 605.7 n. a 596 1.016 n. a 1978 642.9 6.1 607 1,059 4.2 1979 779.4 21.2 621 1,255 18.5 1980 901.0 15.6 634 1,421 13.2 1981 953.6 5.8 646 1,479 3.9 1982(r) 1020.5 7.0 658 1,551 6.6 1983(p) 1069.5 4.8 672 1,592 1.2 1984(p) 1230.9 15.1 686 1,794 12.7
Source : Bureau of Statistics. Current Economic Statistics.
April, 1985. p. 6.
Note: [n. a) Not available due to statistical change in base in 1977.
The economic productivity in terms of GDP is given in Table I at current
prices from 1950 to 1984, which also indicates the annual growth rate and per
capita GDP. The per capita GDP doubled within 5 years of independence and
has increase steadily during the 1970s and at a slower rate in the early 1980s.
The high growth rate in the 1970s was the result of a change in governmentpolicy to increase manufacturing and processimg, and tourism and its related
construction and services industry. The consequent slower growth was due to
its limitation for expansion. Table 2 displays economic activities by sectors. Agriculture, Forst & Fisheries is an important sector of the GDP; in 1984 it
accounted for 24 % of the GDP. Like other South Pacific island economies,
the subsistence sector is an important of the GDP. In 1984, 27 % of the agricultural
high contribution of sugar cane and sugar processing over the years indicate the
continued relience on monocultural agriculture. In using GDP estimates as economic indicators for measuring the standard of living in Fiji, must be taken of the wide income disparities between the rural and urban sectors.Current development plan policies place emphasis on primary production and
processing of agricultural commodities as a result of urban drift from urban biased
industrial development and the consequent high income disparities. Suger
production and processing therefore remains the basic factor towards economic growth with tourism and manufacturing as supplementary sectors. Table 3 shows industrial performance in the overall economy terms of its contribution to the
GDP and employment from 1972-1979, industries accounted for 17.8% of total
employment.
b. Government Finance & Foreign Exchage
The government's ability to provide basic services and development depends on the funds it can mobilise by taxation, local and everseas borrowing, and foregn aid. The main sources of government revenue has been through income tax, estate &
gift duties; and customs duties. In 1984, 45% of the government revenue has
been through income tax and 33 % from customs duties.
The dependence of government revenue on income tax indicates the small
earnings of the industrial and corporate sector. This is commonly the case in
developing economies whitch lack the genaration of revenue from other sources of government capital investment.
Govenment spending patterns are generally comprised of salerise, wages, and operation costs. However, with the drive towards achieving higher economic through emphasis on secondary and tertiary industries, the government capital expenditure has caused high deficit over the years and has increased the government foreign
and domestic borrowing. Government policy to stimulate investment in
manufacturing, constructions and so on which also means that the government has to forego certain amounts of revesue in the hope for long term development
benefits.
Table 4 gives an indication of the increase in foreign loans public investment.
Soft loans have been declining relative to foreigr commercial loans on which
the interest rates are higher and therefore costly in terms of debt serving in the
future. The gavernment outstanding debt (external) in 1984 was $166.8 million
consisting of multilateral, bilateral and commercial loans, accounting for 38 %
of overall external debt (Reseve Bank Report, 1984. p. 43, 99.). The eighth
Develpment Plan Eight's projection estimated that by 1985, the foreign private
capital borrowing would be reduced to 20 % compared to Seventh Development Plan Seven projection of 50 % and that government borrowing would increase.
Table 2. Gross domestic product by activity at constant 1977 price at factor cost ($000) isic Activity I. Agriculture, Forestry and Fishing I. I Crops 1.1.2 Sugarcane 1.1.2 Other Crops Total 1.2 Livestock Products 1. 3 Fishing 1. 4 Forestry 1. 5 Subsistence Total I 2. Mining and Quarrying 3. Manufacturing 3. I Sugar 3. 2 Other Food, Drink and Tobacco 3. 3 Other Manufacturing 3. 4 Self-employment Total 3 4. Electricity, Gas and Water 5. Construction 6. Wholesale and Retail Trade, Restaurants and Hotels 6. I Trade 6. 2 Hotels. Restaurants Cafes Total 6 7. Transport and Communications 7. 1 Tranaport 7. 2 Communications Total 7 8. Finance, Insurance, Real Estate and Business Services 9. Community, Social and Personal Services 10. Others n. e. o. Less Imputed Service Charges All Activities Annual Percentage Change Per Capita GDP (I) Annual Percentage Change in per Capita GDP 1980 1981 1982 1984 67.797 81,233 83,204 47,815 82,677 21,703 22,634 24,459 23,842 26,155 89.500 103,867 107,663 71,657 108,832 6.379 6.509 6,636 7,158 7,156 5,505 10,205 10,022 12,082 I 1,078 6,742 6,417 4,812 5,396 5,483 44,702 45,597 16,463 47,439 48,390 152,828 172,595 175,596 143,732 180,939 344 427 632 554 670 26.253 31.158 32,219 18,297 32,022 18,964 22,512 21,603 22,426 22,645 33,238 32,866 30,249 34,451 34,290 2,293 2,339 2,383 2,433 2,482 80,748 88,875 86,454 77,607 91,439 6,542 6,828 7,038 7,392 9,117 59,686 60,473 53,382 48.830 44,608 95,304 102,393 87.740 102,376 102,249 21,987 23,131 25.266 21,780 24,908 117,291 125,524 113,006 124,156 127.157 55.576 58,733 65,283 65,418 71,81 I 1 1.204 11,887 12,288 12,542 1 3,044 66,780 70,620 77,571 77,960 84,855 84,304 87,852 90,813 93,688 98,735 124,102 125,344 126,598 127,863 129,440 5.157* 1,397* 1,399* 1,331* 1,441 -18,453 -20,030 -20,337 -21,550 -23,058 679,329 719,905 712,152 681,563 745,043 -1.7 16.0 -1.1 -4.3 +9.3 1,072 1,1 14 1,082 1,014 1,086 -3.7 (3.9 -2.9 -6.3 +7.1 Source : Bureau of Statistics. 'Residual. Current Economic Statistics; April, 1985. p.
Table 3. Contribution of the industrial sector to the economy (1972-1979) 1972 1975 1976 1977 1978 1979 Value Added'1' ($M) Gross Domestic Product (GDP) Total value added by sector Value added as % of GDP 214.2 233.9 242.8 262.1 274.8 296.3 28.1 31.2 33.6 38.0 39.1 45.4 13.11 13.34 13.84 14.50 14.23 15.32 Average annual growth in value 3.4 7.7 13.1 2.9 16.1 added Employment
Total Employment
5g m
v_ ?69 ?2 6Q? 12^(i 72 232 79,865
(TE)
Employment in sector 9,828 12,155 11,043 13,384 13,156 14,236
Sector employment as
fig
,6y
,5?
g
% of TE
Notes :(1) In 1972 constant prices.
Source: Central Planning Office. Fiji's Development Plan Eight (1981-1985). p. 180.
Table 4. Foreign revenues for public investment, 1971-1980 ($ million)
l971-(%) 1976 (%) 1977 (%) 1978 (%) 1979 (%) 1980 (%) Source .»._-Soft Loans World Bank loans 11.8 (33.9) 3.8 (30.0) 4.4 (18.8) 2.5 (23.8) 1.4 (4.4) 1.6 (6.0) I. M. F. Loans 2.5 (7.2) E. E. C. Loans 0.6 (4.7) 1.6 (4.8) - (0) 2.0 (6.2) 2.9 (10.9) Bilateral 6.6 (19.0) 6.9 (54.3) 5.8 (24.8) 3.8 (36.2) 0.2 (0.6) 0.1 (0.4) Loans Sub total 20.9 (60.1) 11.3 (89.0) 11.8 (50.4) 6.3 (60.0) 3.6 (11.2) 4.6 (17.3) Overseas commercial Loans 1.7 (4.8) - (0) 9.1 (38.9) - (0) 23.0 (71.7) 17.6 (65.8) Grants 12.2 (35.1) 1.4 (I 1.0) 2.5 (10.7) 4.2 (40.0) 5.5 (17.1) 4.5 (16.9) Total Public Investment Resources 34.8 12.7 23.7 10.5 32.1 26.7 (100.0) (100.0) (100.0) (100.0 (100.0) (100.0) Source: Central Planning Office. Fiji's Eighth Development Plan (1981-1985), (Vol. 1) p.61.
Foreign aid including soft-loans, capital or project grants, budgetary aid and
technical aid are important source of not only government financing but also
in the public and private sectors. Table 6 in appendix II gives an indication of
aid flows for 1982.
Table 7 (a). Direction of trade : total exports precentage
Total United Tonga/
Year Exports Australia Canada Japan New United States of Western Others FOB Zealanii Kingdom America Samoa
(FS000) 1968 49,118 11.1 6.3 4.1 5.2 37.8 13.9 3.7 18.2 1969 53,227 10.3 9.3 3.6 5.5 34.6 15.7 3.8 17.2 1970 62,307 8.8 11.6 4.2 7.1 31.4 15.7 3.8 17.4 1971 61,769 7.7 10.1 3.4 6.0 28.9 17.9 4.0 22.0 1972 65,582 10.1 6.7 3.7 7.5 29.8 21.4 4.1 16.7 1973 74,426 12.2 8.0 3.4 5.8 29.2 17.3 5.1 19.0 1974 123,740 9.9 2.4 0.4 6.6 30.0 25.9 5.9 18.9 1975 142,293 9.2 0.4 0.3 8.3 55.9 1.9 5.0 19.0 1976 122,523 10.3 0.4 0.3 10.5 41.3 3.9 6.1 27.2 1977 164.316 7.4 1.4 1.0 9.4 41.5 5.6 6.6 27.1 1978 166,493 7.2 3.2 0.9 9.1 38.8 10.0 6.6 24.1 1979 215,044 8.1 3.3 1.3 9.6 37.1 15.1 5.2 20.3 1980 305,559 6.8 6.8 10.3 10.2 20.2 10.1 4.5 34.1 1981 268,968 7.3 4.0 7.2 8.1 25.1 10.3 6.5 34.5 1982 267,557 10.9 2.4 1.9 9.6 22.4 9.9 6.3 36.6 1983 245,014 11.5 2.4 2.4 5.0 24.8 8.5 7.7 37.7
Source : Bureau of Statistics. Overseas Trade Report; 1983.
Table 7 (b). Direction of trade: total imports percentage
Total Malaysia United
Year Imports Australia Japan and New United States of Others
CIF Singapore Zealand Kingdom America
(FS000) 1968 68,402 26.2 12.8 3.2 9.4 21.3 5.1 22.0 1969 77,888 25.2 14.2 3.7 9.3 19.8 4.7 23.1 1970 90,502 23.7 15.1 4.1 12.0 17.3 4.4 23.4 1971 111,550 26.2 17.0 4.3 10.7 17.9 4.0 19.9 1972 131,549 24.9 15.9 4.6 12.2 18.5 3.0 21.2 1973 174,645 30.9 16.1 4.3 12.5 14.5 4.5 17.2 1974 219,331 30.3 17.9 8.7 11.2 9.9 4.3 17.7 1975 220,967 28.9 15.7 8.6 12.1 13.4 4.0 17.3 1976 238,040 28.6 18.0 9.3 13.7 10.8 4.3 15.3 1977 281,014 27.7 16.2 11.8* 13.9 9.8 4.2 16.4 1978 299,997 29.9 15.9 6.7 15.5 9.3 4.6 18.1 1979 392,863 35.3 14.3 4.9 15.0 8.9 5.7 15.9 1980 458,754 30.6 14.2 11.0 14.7 7.3 6.5 15.7 1981 539,907 36.0 16.0 7.0 13.9 5.5 7.2 14.4 1982 475,591 38.8 14.2 9.2 15.7 4.2 3.7 14.2 1983 493,185 38.2 16.8 4.2 16.4 5.0 3.9 15.5
*As from 1977 Malaysia is included under others.
In terms of foreign exchange, the stability of the Fijian currency has been a result of the limited amount of export commodities on the international markets, whith does not allow the currency to enter in free market competition unlike other foreign currencies suth as the United State dollar, Japanese yen, New-Zealand
and Australian dollar.
c. Foreign Trade
Fiji's direction of trade is influenced mainly the import of mineral fuels and
the export of sugar. Table 7 (a) & (b) give the imports and exports by major
partner countries. More than 50 % of Fiji's import are from her neighbours,
mainly Australia and New Zealand, however not much is exported to them.
The main destinations for domestic exports are the United kingdom, United States,
New Zealand and Malaysia. The main exports to Australia are raw and unrefined
gold.
Sugar receipts accounted for 55.7 % of domestic exports in 1984 compared
to 62.9% in 1983 and 69.0% in 1982 (Reserve Bank Report, 1984. p. 85-92).
The main export items are mainly raw material ie. suger, coconuts oil, gold and molasses. Table 8 in appendix III gives the composition of domestic exports.
Fiji's imports stand to be higher than exports consist of various food items, capital
goods and mechinery, automobiles, and mineral fuels. Total import in 1984
amounted to $487.1 million whereas exported to $ 19.74 million and the retainedimports was $371.1 million (Reserve Bank Report, 1984. p. 85-92).
Much of the trade commodities are facilitated through various trade
arrangements such as the ACP-EEC under the Lome Convention II and the South
Pacific Regional Trade and Economic Cooperation Agreement (SPARTECA).
d. Air Cargo and Sea Communcation System
Eight foreign airlines and a regional airline. Air Pacfic, operate through the
Nadi International Airport.
A domestic Airline operates between the outer island
routes with other private and chartered operations.
The annual of international air freight discharged and loaded at the Fiji
Table 9. Cargo handling at the Fiji airports
Year Thousands of kg. % change from previous year
2.3 -4.4 -2.8 13.2 -10.5
Source: Bureau of Statictics. Aircraft Statistic, 1983. p. 3.
1979 8,337
1980 7,967
1981 7,742
1982 8,766
airports has fluctuated substantially. Table 9 shows the amount of cargo handled
from 1979 to 1083.
The decline in air cargo and passeger movements relate to the high
transportation cost with the rise in fuel prices. However, Fiji's international airport
an important stopover on the major trans-Pacific air routes as well as being the
focus of a number of regional services.The sea communication sysem operates through four major ports, Levuka for
handing fish, Malau and Lautoke for loading sugar & molasses and Suva for
all other goods. Table 10 in appendix IV gives an indication of the tonnage
and type of cargo landed and shipped.
About 60 % of the total international ships which called at Fiji ports in 1981 and 1982 were dry cargo carries including roll-on/roll-off ships, container carriers, dry bulk carriers and other dry cargo vessels. Cargo landed is largely comprised of imported food, other raw materials and products.
Domestic and regional shipping also operate between internal outer islands
and regional island states. In 1982 of the 228 vessels registered at the Marine
Board, 25 were over 150 tonnes and 76 vessels between 2-10 tonnes forming the
most frequently used category vassel size.
Fiji plays and important role in the Pacific as a major stopover for flights between America and Australia, and as an entrepot port in the intra-regional
trade between the Pacific islands.
Much of the intra-regional trade, including trade between New Zealand and Australia, depend on the efficiency operations of the regional shipping of Pacific
Forum Line and the Nauru Shipping Line. The low value of exports and high
value of imports has caused a trade imbalance between New Zealand and Australia and the island of the Pacific including Fiji, but the regional shipping has so far relied on the support of New Zealand and Australia for finacing its operations. It is seen that the basic transportation infrastructure in terms of air and sea has been relatively developed, but the problem is still the low and fluctuations in the supply of exports, which create high transportation costs and an unreliable fufure.
(2) Econimic Relations with Australia & New Zealand
Basides such factors which hinder development, as size, limited resources, low productive capacity, and isolation ; it could further added that the subordinate position which Fiji occupies in her trading relationship with Australia and New
Zealand could well be construed as another major obstacle.
The present economic structure is a direct result of Fiji's colonial experience
Suger Refinery (CSR) under Australian capital has shaped Fiji's economic system where the suger industry constitutes the major source of foreign exchange right to up the present. At the time of independence, four large Australian Companies, CSR, W. R. Carpenter, Burns Phillip, and Emperor Mines were operating as the major economic force with other smaller trading companies.
The declaration of independence, which gave the islands of the Pacific the
flexibility to make their own decisions, caused the Pacific rim countries with
established interest in the area such as the USA, France, Australia and New Zealand
to devise policies to maintain their predominant influence. Australia and New
Zealand, in particular, have become more heavily involved in the from of economic and diplomatic initiatives, (despite having withdrawn from their colonies).
Australia is the largest source of foreign capital follwed by New Zealand. "It has been estimated that foreign firms account for 75-80 % of corporate turnover in Fiji and that Australian Firms account for 60% of that" (CARSTAIERS, 1981. p. 11).
Table 11 shows the source of foreign investment in Fiji as of December 1979. It also illustrates the numerical strength of Australia as a source of capital. 35.2 % of the companies had some Australian participation, and New Zealand was seen to be significant in type 2 and 3 companies.
According to E. UTCHERT :
The two largest Australian foreign enterprises operating in Fiji are the W.
Table 11. Source of foreign investment in Fiji as at December 1979
Country of Origin 1 2 3 total proportion %
Australia 247 10 2 259 35.5
New Zealand 136 18 8 162 22.0
USA 61 - - 61 8.3
United Kingdom 48 2 2 52 7.1
Japan 10 1 1 12 1.6
Joint Foreign 48a 8b 3c 59 8.0
Participation
Other countries 98 6 15 119 16.2
Not Detailed 12 - - 12 1.6
Total 660 45 31 736 100.0*
* error due to rounding
a Australia participated in 28, NZ 18
b Australia participated in 5, NZ 5
c Australia participated in 3, NZ 1
Note: Category (1) - greater than 50% foreign equity Category (2) - Between 20 % and 50 % foreign equity Category (3) - less than 20 % foreign equity.
R. Carpenter and Burns Phillip; together have near control over many industries
and exert influence in almost all economic sectors particularly manufacturing,
international, trade, reteil trade, transport, tourism, and sections of agriculture
(E. UTCHERT, 1984. p. 257).Burns Phillip (South Seas) has expanded from plantations to merchandising,
transportation, wholesaling, and retailing imported and manufacturing within the
Pacific Islands.
The Catpenter Group is the sole dealer of caterpiller and earth
moving equiment in Fiji and has franchises over imported automobiles and other
machinary from the USA, Japan, and the United Kingdom.
It is the biggest
shipbuilder in Fiji and controls more than 50 % of the industry and has moved
into agriculture. Fiji Co. Ltd., a subsidiary of a Australian-British-NZ owned company, plays an important role in the petro-chemical sector.In 1979, as indicated in Table II, 660 foreign investments existed in Fiji
of which 247 were from Australia, 136 from New Zealand, and 5 were a joint
venture between Australia and New Zealand, which altogether accounted for 65.2% of the total foreign investment in Fiji.
Besides dominating the foreign sector in Fiji, Australia and New Zealand also play a significant role in the commodity trade. In 1983, Australia accounted
for 38% and New Zealand for 16% of Fiji's imports, wereas the exports to
Australia were 11 % and to New Zealand were 5 % of Fiji's total. Table 12
illustrates the balance of trade between Fiji and Australia and New Zealand. Major commodities imported from australia include food, petrolium products,
manufactured goods, chemical and machinery, and from New Zealand mainly food
and manufactured goods.
Major export to Australia is unrefined gold mined
by a Australia company and export to New Zealand mainly food.
Australia and new Zealand have also significant aid donors to the South
Pacific Regional Institutions and Organisations. Besides multilateral aid for budged
finacing of SPEC, SPC, SPF, and USP ; Australia and New Zealand also contributeto special projects being under-taken by these organisation such as the Pacific
Table 12. Balance of trade with Australia and New Zealand
($ million)
Australia New Zealand Total Trade
Year
Exports
Imports
Exports Imports
Exports
Imports
1982 1983 1984 29.090 28.105 38.152 184.657 188.564 168.415 25.712 12.184 10.961 74.540 80.756 78.477 267.557 245.014 279.418 475.591 493.185 487.105
1984 figures are provisional
Forum Line (PFL) and the South Pacific Forum Fisheries Agency (FFA). Thus Fiji, being one of the members of the regional organizations, is being affected by the decisions of this multi-aid assistance.
Bilateral aid to Fiji from Australia and New Zealand has also been significant
as indicated in table 13 for the year 1982. Aid from Australia accounted for
52% and New Zealand 10% of the total aid.
G. R. FRY makes the following comment on dependence on aid :
Attempts to establish substantial regional ventures to displace metropolitan involvement have inevitably led to even greater involvement in the form of financial
assistance. The necessary capital to support large regional venture is just not
available in the island regional. In the case of regional shipping line, for example
its continued operation is dependent on the injections of Australia and New Zealand capital, and yet paradoxically the lines was established partly to reduce dependence on metropolitan line (G. R. Fry, 1981. p. 27).
The South Pacific Forum has established a preferncial trade agreement between
the South Pacific Island and New Zealand and Australia called SPARTECA. (Fiji being a member of the South Pacific Forum and having close trading ties
with Australia and New Zealand). The agreement make some products calls for
unrestricted access or concessional for other specified originating from the developing
island member countries of the Forum in order to accelerate the development
of member countries and to promote economic cooperation.
However, the Forum island countries have been facing varing problems with
regard to SPARTECA opration. Fiji's Prime Minister Ratu Sir Kamisese Mara
in addressing the recent commonwealth Heads of Goverment Meeting in Suva expressed the following concern :
... inspite of ostensibly generous trade agreements, in practice our exports into those markets are frustrated by bureaucratic devices such as quotas, licenses, and
other non-traiff barriers ...
Its often difficult to reconcile such protectionist practices with the political goodwill that occupies such agreements (South Pacific Island Business News; Nov.
1981. p. 17).
It has therefore aroused concern that SPARTECA might turn out to be another
kind of neocolonialism ... just another devise which, good intention not
Table 13. Official Development Assistence (ODA) from Australia and New Zealand ($ million)
1982 : Australia New Zealand Total Bilateral
15.9 3.1 30.6
withstanding, continue to tie the islands of the region in a subordinate way to their metropolitan neighbours (SUTHELAND, W.M., 1982. p. 2).
Analysis of the SPARTECA Agreement shows various loopholes with are beyond the scope of this study. Also the list of items which quality for access to Australia markets are items which the island economies are incapable of producing competitively such as cider, porcelain and chinawere and plastic garments.
Fiji, being an island country, faces various shipping problems. Most important
being the high cost of relatively valuable imports in cargo liner from Australia and New Zealand ; and only a limited return cargo to these markerts, comprising mainly primary products of relatively low value, with the bulk of exports going to Europe by chartered tramp vessels, the great fragmentation of the islands with small population and markets also creates expensive transportation.
These problems are not unique in Fiji, but also apply to other South Pacific
island countries. To overcome this problem the South Pacific Forum set up
the region and New Zealand and Australia. With inbalances in trade, the South
Pacific Forum Line faces several operational dificalties, however New Zealand and Australia have kept it going by financing over two-thirds of its budget. The operations on the other hand has eased the importation of raw materials, manufactured, and processed foods into the island states; and the exportation of the products of Australia and New Zealand Companies located in the islands.
In regard fisheries, Fiji's subordinate relationship with Australia and New
Zealand has had two major ramifications. Firstly, from the time of colonial
rule both countries have been interested in commercial agriculture under the
plantation system, and later on processing of agricultural products and other
manufacturing industry rise rather than fisheries. Very cooperation was conserned
with fisheries except for the financial assistance for the operation of the recently
established FFA. Much of the operations of FFA and its foundings are itself
based on international and ragional politics. Fish as protein food is also seen
not to be of equal importance as red meat in these countries.
Secondly, with the concentration of economic interests on commercial
agriculture and manufacturing such as sugar which forms the base of economic activity, it could be said that resources have been further directed away from fisheries and as a result, fisheries is still dominated the subsistence production.
(3) Strutural Stagnation Under a Monocultural Economy
(i) Suger Cane
Suger cane farming started in Fiji in the earty 1860s by the colonial settlers
of which, 4 still remain and from the base the suger industry. Suger became Fiji's principal export in 1883 and still remains the backbone of Fiji's economy. The Colonial Suger Refinary Company (CSR), a well established Australian
company started operations in Fiji in 1880. In 1961, the CSR set up the subsidiary
South Pacific Suger Mills (SPSM) to operate in the Fiji mills. Following an
acceptable arbitration award by Load Denning on the sharing of proceeds with
growers, CSR withdraw from Fiji in 1973. As a result, the government bought
all CSR shares in SPSM Ltd. and operated the present Fiji Suger Corporation (FSC) as a public company.
Table 14(a). Position of sugar industry in the economy
sugar/agri. sugar/manuf. sugar/GDP sugar/domestic
% % % % exports 1980 75.8 33 13.8 80.0 1981 78.2 35 15.6 72.9 1982 77.3 37 16.2 71.8 1983 66.7 24 9.7 64.7 1984 76.0 35 15.4 59.1
Source: Bureau of Statistics; Current Economic Statistics (1981,1984).
Table 14(b). Performance of the sugar industry, 1980-85
1980 1981 1982 1983 1984
1985e/
1. Exports : a) Sugar (Tonnes) b) Molasses (Tonnes) 441,000 161,000 408.000 141,000 411.000 157.000 343,000 93,000 379,513 150,153 434,000 151,000 2. Export Value : a) Sugar ($m) b) Molasses ($m) c) Total ($m) 154,55 11.98 166.53 134.99 9.62 144.61 147.09 5.08 152.17 89.83 3.17 93.00 110.16 6.46 116.62 11 1.00 7.50 118.50 3. Employment: a) Farmers b) Cane Cutters c) FSC Employment 19,567 19.300 3,951 21,015 19,411 4,000 22,091 19,911 3,708 20,500 11,295 3,521 21,796 16,244 3,871 22,146 16,244 3,887 Total 42.818 44,426 45,710 35,316 41,911 42,2774. Cane Price : $/tonne 35.19 26.24 28.60 29.00 22.37 22.43
5. Income : Growers $m FSC Sm 117.80 48.73 103.26 41.35 111.4 40.77 65.10 27.90 97.59 38.93 82.54 33.59
Source : Fiji Sugar Corporation Annual Reports
Bureau of Statistics
Central Planning Office
Suger not only dominates the agricultural sector of the economy and is for
the highst commodity crop, but it also places as the largest in the food manufacturing
sector. In 1984 suger cane accounted for 76% of the Agriculture, Forest and
Fisheries sector and suger manufacturing accounted for 35 % of the manufacturing
sector. In the total it accounted for 15.4% of the GDP. Table 14 (a. & b.)
gives the detailes on the posittion of the suger industry in the economy. Suger cane is the major crop in the two larger islands. Farms are operated under a small-holder system where the average farm holding is about 4. 2 hac. About 20,000 independent farmers sell cane to the mill in their respective areas. The famers are comprised of 75 % Indian and 25 % Fijian.
During harvest time 19,000 people cut cane on an average day. Three thousand and five hundred people are directly in the FSC Mill operations. In the overall economy the suger industry employs nearly one quarter of Fiji's econimically active people. Table 15 in appendix V gives the suger industry production and prices. It also indicates the fluctuations not only in crop production but also the market prices for sugar.
Fiji differs from other suger producing countries because of its almost camplete dependence on small farmers its centralised milling system. Each famer oprates under a contract with the miller wich specifies the quota of cane form and also regulates the relationship between sale and purchase of cane.
Several problems exists at the famers level. Firstly, it must be pointed out that in light of the general principle of agricultural progress, sugar production and earnings per unit from small scale farms of 0.10-0.12 hac. falls short of the level of developed agricultural countries.
Major problems for farmers which directly affect production relates to insecurity
of land and tanure. This insecurity of lease has further led to poor land management.
Other major problems in suger cane production has been adverse weathercondition cyclones and flood. Suger diseases have also severely affected crop
yield in some areas.
With technological advances several kinds of artificial sweetners and beet suger which represent close substitutes and have become higher preference commodities
than traditional cane suger have hit the world suger market. This has forced
the world suger prices.
The fluctuations and decline in prices has affected Fiji's
earnings and hence the whole economy.
Fiji's major reliance for market are under special agreement with the European
Community. In 1984, 46.5 % of the total sales was to EEC Countries under
the ACP-EEC Lome Convention Agreement. Fiji also has term arrangements
with Malaysia, New Zealand, China and Singapore. The remainder suger is sold
on the open market. The decline in he world market prices since 1980 has continued. The Director's report for the Suger Industry for 1983-1984 season states that:
of any significant change is threatening the viability of the suger industries throughout the developing world, and Fiji no exception (FSC Annual Report,
1983-1984. p. 4).
The capacity to expand lies in fulfilling and securing the ACP-EEC quota
agreement as well as trading in the open market. The latter, where the major
economic capacity to expand lies, is very dependent on the open market prices. However huge imbalances between consumption and production have led to steady accumulation in world suger stocks, thus causing the world suger prices to fall. It is also world pointing out that since the would maket offers cheap suger, it would not be surprising that the present contracted countries would later buy in the open market, thus weakening hope of expanding special agreement and
contracts.
Fiji's vulnerability to fluctuations in external demand conditions for suger
has aroused great concern. The decline in prices has not only affected the industry,
but the farmers who directly depend on suger production and the economy as
a whole. This monocultural dependences is proving to be a great risk to the
economy.
(ii) Copra Industry
Copra is another monocultural crop which is a major source of income and
employment on the other islands and Eastern and Southern Vanua Levu. It is
the second agricultural crop in terms of earning foreign exchange and also came under commercial production during the colonial period in a similiar manner as the suger industry. It still plays an important secio-economic role in the economy. There are two major types of production system, the large estate plantation
and the village production by small scale farmers. The larger estate plantations
over 900 hac, are mostly operated by companies or individual owners on freehold
land bought before cession and worked by hired laborers. The small holdings
of the industry is considerable both in teams of the traditional involvement of W. R. Carpenter Ltd. and the Burns Phillip (SS) Ltd. and newly established USA
and Singapore based involvement. Island Industries Ltd. a subsidiary of Carpenters
Table 16. Copra production from 1969-1984
year-tonnes
1969-33,289 1973-26,938 1977-30,605 1981-20,493
1970-29,034 1974-27,606 1978-26,082 1982-22,033
1971-28,634 1975-23,692 1979-21,932 1983-23,566
1972-29,205 1976-26,908 1980-22,790 1984-24,545
Source : Ministry of Primary Industries. Coconut Profile: A Programme
for Future Development of Coconut Areas. Agricultural Commod ities Committee/Coconut Advisory Council, 1985. p. 7.
operated the frist mill is so far the largest of current operating mills. The Burns
Phillip operates CASP Ltd. and considerable copra estates. Copra production
has declined considerably in the early 1980s. Table 16 displays the copra production
from 1969 to 1984.
Frequent hurricanes have decreased production severly, coconut pests and
diseases have also increased and affected the quality of coconut production, lack of rehabilitation and replanting of older trees, most of which were planted in
the colonial period have decreased production because of old age. Other problems
relating to production include land fanure and insecurity of lease which has also
ceated dis-incentive for land and crop improvement.
The technology and production tehniques employed are of low-efficiency
perticularly for copra drying. Output of copra per hectare under coconut trees
is generally low. Harvesting is not regular; nuts are collected from the ground
by natural fall and mostly picked up when cash is required.
Shipping problems are also enormous with the fragmentation and distances
between the islands and the fact production quantities are small. The high fuel
prices during the 1970s caused high freight cost for shipping which eliminated
all profit.
The trading patterns in coconut oil indicate that in 1984 it accounted for
9.4% of total domestic exports, whereas in the 1960s and 1970s it accounted
Table 17. Exports of coconut oil
Year Quantity (tonnes) Value (f o. b.) ($000)
1969 17,411 n. a 1970 19,011 n. a 1971 16,866 n. a 1972 15,905 n. a 1973 18,247 n. a 1974 14,306 n. a 1975 16,060 n. a 1976 14,433 n. a 1977 17,551 n. a 1978 17,645 n. a 1979 14,228 n. a 1980 12,720 6,528 1981 13,582 6,355 1982 15,607 6,165 1983 13,941 10,579 1984 15,034 18,467
Source : Ministry of Primary Industries. Coconut Profile : A programme for
Future Development of Coconut Areas. Agricultural Commodities
Committee/Coconut Advisory Council. 1985. p. 23. & current Economic Statistics. April, 1985. p. 59.
for almost 25%. Table 17 presents the exports of coconut oil from 1969 to 1984.
Local copra price are related to world market conditions for oil. Coconut
oil has lost some of it sshare in the oil market compared to animal fats, palm oil and other edible oil such as palm kernel oil and soy bean oil which provide
cheaper substitutes. The palm kernel oil being the closest substitute for coconut
oil provides the greatest competition.
"Competition with palm kernel oil will not only even necessarily, be in price terms, but will also depent on merket access, reliability of supply etc". (W. D.
Scott & Co. Pty. Ltd. p. 10).
World prices of coconut oil are also greatly affected by soy bean oil which dominates the edible oil industry. Also coconut oil prices are quick and sensitive to shifts in supply from the largest coconut oil producer, Philippines, which account for almost 80% of the world trade in coconut oil; as result, the vulnerability in Philippines production has also been one of the contributing factors in the extreme instability in the coconut oil prices.
Fiji's copra previously benefited from EEC-STABEX, a export earning stabi
lisation scheme introduced of the Lome Convention. Under Lome I , Fiji could
obtain loans for coconut oil deficits regardless of the market in which the copra
was sold. However, under Lome II, as a result of stringent application of STABEX
Articles, Fiji does not have similar opportunities from STABEF Funds becasuse
no oil is going to the ECC Market. This has greatly affected the future of the
copra industry.
The W. D. Scott & Co. Pty. LTd. Report on Copra and Coconut Oil markets
forcasts the coconut oil deman as follows: End use demand for these oils in
traditional merkets however is not likely to grow as for as their supply. Even
allowing aggresive selling in the traditional markets which is the likely priority suppliers response, the demant volumes still do not appear to be large enough
to absord the available oil (p. 6).
With oversupply and declining preference for coconut oil in the oil market, the future of the copra industry does not look very positive in teams of maintaining market share and expansion. Variable prices have also affected production and management since copra is a team extensive agricutural crop.
Being monocultural crops and traditional colonial commodities present several
problems for the long term continuity of both suger and copra. Both industries
are faced with declining prices as a result of higher production relative to
consumption which has produced surplus supply on the world market; much consumption being affected by increasting substitute commodities.
The fixed quotas under the long term contracts do not accomodate for expansion but rather for continous efforts to renew these agreements as the world market
cange in the immediate future. Almost 47 % of the total suger exports have
to be sold in the world free market.
While the return per hectare is declining with reduced suger price, the production costs are increasing due to the rise in fuel price and the high cost of both fertilizer
and farm machinary. Which are all imported materials; leading the whole industry,
including the farmers, into a depressed state.
It has long been realised that the suger industry needs to diversy, and
programmes have been implemented to some extent. However, the opportunities
and potential for further diversification and expansion lie in the ability to seek
export markets for its products as the domestic market is too small.
The copra industry is also faced with a similar problem, but to a greater
extent being a long term crop. With the continous decline in production and
reduced coconut oil prices, not only have copra processing industries been affected but also the farmers have experienced periods of no profit.
The excessive processing capacity and declining copra production has caused
much concern for the government. As a result, the Development Plan Eigtt's
objective for the copra industry emphasised increasing coconut production in order to keep the processing industries in the operation by supplying free planting materials
and so on. Present development programmes also emphasise intercropping, use
of coconut fibres as a means towards diversification of the industry; but the success
still lies on the availability of markets for these small quantities and scale of
production from the smaller outer islands.
The stagnation of both industries clearly indicates risk involved in the continued
reliance and investment. It is also worth stating that the potential for diversification
in both industries needs more careful research and evaluation before any major implementation.
(4) Indefinite Class Differentiation Inside Rural Communities
(i) Progress of Land Ownership
Throughout history, land ownership patterns have determined the various
economic and social system right up the present.
Land ownership patterns have been categorised by three stages in its theory of development. The first is characterised by primitive communism where ownership developed as a property or a clan based system.
The socio-economic forces and contradictions or the continous state of flux
whthin the society led to the emergence of a large scale feudal landlord and
the tenant, called the feudalistic tenant system as the second stage in the development
in fact not so in reality, but only the outer framework within a new type of
society developed. The new society was characterised by a hierarchical socio
economic structure with the tenant as peasants at the bottom and feudal landlords
in possession of large areas of agricultural land. The destruction of the peasant
from the land led to the third stage in progress of land ownership called the
enterprise or capitalistic ownership system. It is seen that the economic structure
of the capitalist grows out of the economic structure of the feudal society. The
dissolution of the latter in fact sets free the elements of the former to freely take place.
The large agricultural land of the landlords turn into the farming enterprises
and the feudalistic rent modifild into the modern rent system. The tenants consisting
of the masses become landless and provide their labour for the capitalistic enterprises characterised by large plantations.
In the history of the development of capitalistic countries suth the USA and
European countries this transformation of the feudalistic landlord system into
modernised ownership can be seen, as well as the emergence of farming enterprises and wage labor as a process of capitalistic agriculture.
In the context of land ownership Fiji, actual land ownership and allocation of planters took effect only after European contact, the coming of planters and
settlers. These planters and settlers wanted land and labor for their plantations
and a settled government which would give them a firm title to their land besides
protection. When a European bought land he considered that the land became
his. The Fijian however, often sold what he belived to be only the use of land,
therefore resulting in great conflicts and warfare. The concept of land ownership
meant only the use of land surrounding the village or the tribal settlement. Land
was a common property with traditional clan ownership.
The Deed of cession in 1874 made first provisions to identify the state of
ownership of the land, Clause 4 of the Deed of Cession stated the following
with regard to land :
That the absolute proprietarship of all lands not be now alienated so as
to have become the bona fide property of Europeans or other foreigners or not now in the actual use or occupation of some chief or tribe or not actually required
for the probable future support and maintenance of some chief or tribe shall
be and is hereby declared to be vested in her said Majesty her heirs and successors (Lloyd, d. t., 1962. p. 8).
This clause gave three types of land system which still prevail and from the
base of present land ownership system. Firstly, the land wich was at the time
of cession proved to be under European and other foreigners occupation became
the freehold land. Secondly, lands which were in actual use or occupation of
some chiefs or tribe and lands required for the probable future support and
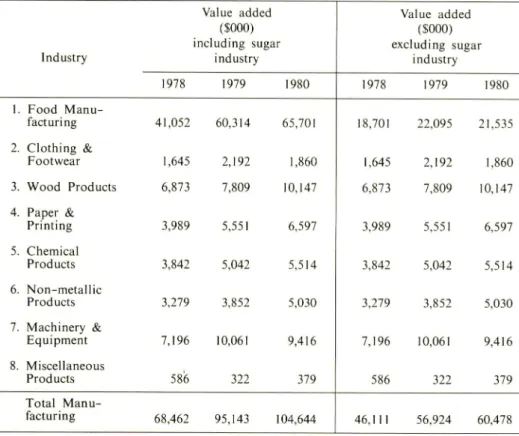
Table 18. Fiji land ownership statistics (1977)
Type of Land % of Tatal Area
Native Land including Rotuman Land 83.30
Crown Land 8.55
Freehold Land 8.15
Total 100.00
Source: Prasad, P. 1983. p. 103.
land not falling under the above two categories which belonged it the Crown
or the Government. Hence it became the Crown land. Table 18 give the percentages
of each type of land ownership in Fiji.
The law requires the Native Lands to be held according to the Native Custom. the Fijian land is therefore registered under the traditional 'mataqali' (clan) system
of a patrilineal linkage, and land is in alienable except to the Crown. The head
of the 'mataqali' is in charge of the land belonging to his clan. So long as
a man performs his portion of the work, he cannot be pushed out even if he
only holds a collateral interest in the land of the 'mataqali'. This principle of
ownership based on traditional custom has been adopted by the colonial
administration and has so far remained unchanged.
With various socio-economic pressures such as population change, land varies widely now from one unit to another and even within the same village, but there
are no mechanism for redistribution of land. The only land which could be
speculated towards individual proprietarship is the freehold land which comprises
only 8.15 % of the total land area. Since this is the only freely transferable
land it has a market value quite unrelated its productive value for agriculture. The third category comprising of Crown land is used by goverment for mostly
public amenities and services. Thus the only lands available for agriculture are
the native lands and only a small portion of Crown and freehold land. Commercial agriculture in Fiji developrd initially under the plantation system
by the colonial settlers with the help of indentured laborers. These plantations,
mainly of cotton and later copra and suger cane, occupied most of the freehold land operating simply as extensions of the capitalistic industry of the metropolitan
empire to supply raw materials. With the lack of labor the suger industry shifted
on to small holder tenant system on the freehold land of the Company and on the native lands under lease from the 'mataqali'.
Thus the non-Fiji farmers, most of whom are of Indian background and
who settled after the indenture period, have become the independent small holder
tenant on the Native Land. It is therefore seen that land ownership patterns
in Fiji exhibit a unique character in that the tenant system of small independent
or the stagnation of ownership is reflected by socio-political control which originated
under the colonial administration system. Throughout the history British
Colonialism, it is generally seen that the British Administrators avoided conflict with the native customary systems in order to peacefully achieve their own ends, thus codifying the system as it axisted at the time of cession and keeping away with any further legalities which was not in their interest and not their purpose. Thus much of the rural stagnation is a result of this colonial manipulation.
The land ownership pattern from the past to the present does not indicate economic forces for disintegration, a necessary process for progressive agricultural
development.
The purpose in the above arguements has been marely to try to illustrate the stagnation of land ownership rather than for any judgement on the desired
mode of land system. The rural community and the mode of farming is also
effected by this stagnation in the land ownership system.
The patterns of land ownership is analysed in the later part of the study in relation to ownership of the sea, which according to the traditional custom, was a simple extension of the land boundary.
(ii) Differentiation of Peasantry
According to the historical process, at any point in time the socio-economic relations present are a combination of remains of the past dominant type relations that are on the verge of disaggregation. Thus the present condition of the society and new relations that are begining to develop and express in contradictiory manner. The sum-total of all these economic contradictions among the peasantry constitute what we call the differentiation of the peasantry. The peasants them selves very aptly and strikingly caracterise this with the term depeasantising. This process signifies the utter dissolution of the old, patriarchal peasantry and the creation of new types of rural inhabitants (LENIN, p. 1964. p. 176).
These rural inhabitants consists of two extreme types of groups, the first is
peasant bourgeoies, a minority group of individual independent farmers who
purchase and/or rent large areas of land, use improved farming techniques, hire farm labor and, further in the process try combine agriculture with industrial enterprises. The other group is the rural proletariat, consisting of the majority of the people who have to abardon their land and sell their labor power to
the first group. The overall process involved represents the brakdown of feudal
and clan property and its transformation into modern private property which is characterised by large plantation systems with improved techniques and use of labor. It represents the natural course of capitalistic agricultural production. Thus the process of differentiation may be looked at in terms of size of farms and groups, and class of farmers through time in order to see the process or
Differentiation of peasantry in Fiji is directly reflected by the pattern of land
ownership system. The majority of the agricultural land is under communal
ownership, where the useage land is determined by the traditional means. The
institutional factor, furthemore, socio-political, which determine administration of land, restrict individual ownership of free trade in land (with exception of freehold
land), therefore restrict the development of capitalistic forces of production.
Analysis on suger farmig, the dominant agricultural crop shows that farming
the small-holder system has continued since as the 1930s. Lack of labor to maintainthe plantation system created a sub-division or estates into a small-holder system
which proved sucessful where the Indian farmer could manage a farm using family
labour.
Small farmers not only increased on the Company's land, but also on
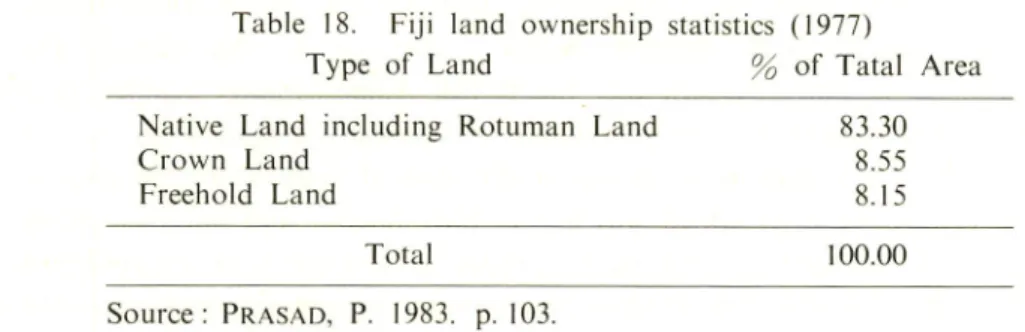
leased 'mataqali' land. Table 19 shows that the average size of farms in 1944
was about 0.1 hectars.
Table 19. Size of farms in 1944
Number of [-] FT^ta rpf Tenants Contractors Up to 0.019 nil 141 0.02 to 0.039 22 640 0.04 to 0.059 105 711 0.06 to 0.079 114 440 0.08 to 0.099 595 373 0.10 to 0.119 1,502 378 0.12 to 0.139 960 238 0.14 to 0.159 440 214 0.16 to 0.179 189 132 0.18 to 0.199 41 82 0.20 to 0.219 24 101 0.22 to 0.239 6 67 0.24 to 0.259 2 70 0.26 to 0.279 2 51 0.28 to 0.299 1 39 0.30 to 0.399 3 99 0.40 to 0.499 4 48 0.50 to 0.599 2 19 0.60 to 0.699 nil 11 0.70 to 0.799 nil 6 0.80 to 0.800 nil 3 0.90 o r o v e r nil 4 Source: Shephard, C. Y. 1945. p. 39.
Note *Tenants-in the above case tenant are farmers who lease land from
the company.
Contractors-several different forms of leases: some contractors own
land, others leases from private individuals, but most
of them hold leases from native owners.
"""The tables used for the above analysis are a poor representation of statistical proof, but unfortunately data on farm sizes and the number of farmers over the years is not available.
Table 20 . Development of sugar cane farming ; areas culitivated 1925-1944 Year Total area under culti Cul tivated By European Indian and Indian and 1925 vation 64,963 Co npany Planters Fijian Tenants Fijan Contractors Acres % of Area Acres % of Area Acres % of Area Acres % of Area 33,679 52 4,446 7 6,905 10 19,933 31 1926 67,494 30,350 45 4,040 6 9,080 13 24,024 36 1927 70,526 28,828 41 3,677 5 11,448 16 26,573 38 1928 75,007 23,700 32 2,342 3 20,710 28 28,255 37 1929 77,645 20,025 26 2,004 3 25,559 33 30,057 38 1930 78,250 17,641 22 1,611 2 27,896 36 31,102 40 1931 78,373 12,610 16 1,133 1 34,300 44 30,330 39 1932 80,939 9,160 11 744 1 39,412 49 31,623 39 1933 83,692 7,450 9 645 1 43,077 51 32,520 39 1934 84,497 5,335 6 658 1 44,989 53 33,515 40 1935 87,738 4,874 5 661 1 45,690 52 36,513 42 1936 89,924 4,532 5 653 1 46,031 51 38,708 43 1937 91,197 4,500 5 717 1 46,139 50 39,841 44 1938 91,475 3,219 4 369 47,405 52 40,482 44 1939 91,812 3,126 3 240 47,421 52 41,025 45 1940 91,624 3,111 3 206 47,268 52 41,039 45 1941 92,628 3,153 3 161 46,521 50 42,793 47 1942 94,046 3,119 3 221 46,439 50 44,267 47 1943 90,913 2,728 3 197 45,383 50 42,605 47 1944 89,059 2,425 3 197 45,332 51 41,105 46 Source: Shepard, C. Y., 1945. p. 38.
Table 21. Number of farmers, size of farms, and production Number of Farmers Year 1982 1983 1984 Total Production (000)t Production Size (t) Size of Farms (acres) Lautoka Rarawai Labasa Penang 1,884 6,652 217 759 4,910 131 845 3,699 388 1,289 1,720 22 4,075 2,202 4,290 1-50 51-500 500-over 1-50 51-500 500-over 1-50 51-500 500-over 0-5 5-10 -10 0-5 5-10 -10 0 -5 5 -10 -10 8,753 5,800 4,932 3,031 4,284 4,506 12 2,078 3,770 19 1,109 3,702 91 1,022 1,569 10 8,802 5,867 4,902 2,604 1,682 6,819 347 956 4,763 202 811 3,799 351 711 1,866 42 8,848 5,921 4,961 2,619 Source: Fiji Sugar Corporation Information Office, Suva. (IDL)
Table 20 indicates the breakdown of the plantation system and development of the small holder ststem. the trend of the small holder system has been continuing as indicated by more recent figures on farm size as can be seen in table 21.
It can be seen in table 21 that most farmers come from farms ranging in size from 0.05-0.10 hec. rether than larger frams of over 0.10 hec. thus indicating that the dominant farms are still the small holder system.
In this study on the size farms, SHARMA also mentioned dominarce of the small holder system and its implications on the importance of family management
labor. "In 1980 there were some 1900 suger cane farms of which about 44 %
were in the 2-4 hectare (5-10 acre) group, while only about 9% were in the
greater than 6 hectare (15 acres) category. The small holder system of farming
is further reflected by the fact that on an average only 0.4 % of the suger cane farmers employed 2 temporary non-family labor ... Cropping patterns in the western side of Viti Levu and Nothern Vanua Levu (where most of Fiji's suger is grown) has only changed only marginally in the last 70 years despite the possibility of growing relatively more high value products (SHARMA, 1985. p. 35)
The process of differentiation in the above agricultural system does not exhibit any distinct development forces towards capitalistic production. The socio-political forces of land ownership restricts the disaggregation of the small holder system. Moreover, the rural community does not distinguish between large farmers who control the production and industry, and a class poor and landless turning to agricultural labor for the large farmers.
A farmer's status is highly dependent on the nuture of his land tenure and
his social relations within the community (he interacts either for extension of
lease or for other sources of income and assistance). The agricultural peasantry
does not exhibit of the definite process of differentiation as historically expected, because the production sector is based on small-holder household production while
the industry is based on the capitalistic mode. The limitation of development
of capitalistic production of suger cane is in part, caused by the greater outside
institutional forces.
(5) Backward Composition of Industrial & Employment Structure
(i) Presense of Light Industries
Fiji's industrial production structure is classified' in three categories:
manufacturing, mining, and gas & water. Table 22 below shows the industrial
production contribution to the GDP.
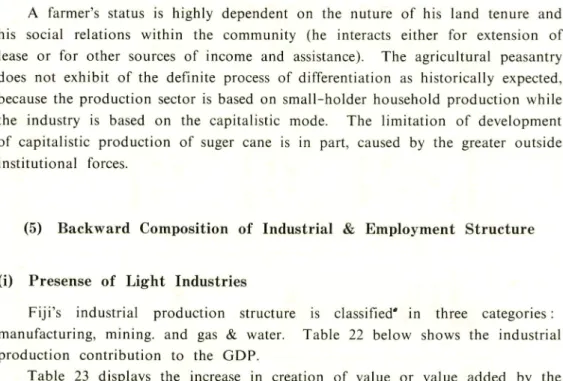
Table 23 displays the increase in creation of value or value added by the manufacturing sector with as can be seen is largely due to the suger industry.
Mining industry is presently dominate for gold production under Australia
investment. The total employment in the mining and quarrying sub-sector in
1983 was only 1 % of the total.
Fiji's manufacturing sector is relatively more developed than on other South
Table 22. Industrial production contribution to GDP (1976-1980)
1976 1977 1978 1979 1980*
GDP at current factor cost 570.6 605.8 642.9 779.4 917.0 ($m)
Industrial Sector :
-mining and quarrying -manufacturing
-electricity, gas and water
Value added ($m) 76.3 78.5 76.7 106.3 116.8
percent of contribution (%) 13.4 13.0 11.9 13.6 12.7
♦expected.
Source: Bureau of Statistic. Census of Industrial Production 1980. p. 8.
Table 23. Contribution of the sugar industry in the total manufacturing.
Industry Value added (SOOO) ncluding sugar industry Value added ($000) excluding sug industry t r 1978 1979 1980 1978 1979 1980 1 Food Manu facturing 41,052 60,314 65.701 18,701 22,095 21,535 2. Clothing & Footwear 1,645 2,192 1,860 1,645 2,192 1,860 3, Wood Products 6,873 7,809 10,147 6,873 7,809 10,147 4. Paper & Printing 3,989 5,551 6,597 3,989 5,551 6,597 5. Chemical Products 3,842 5,042 5,514 3,842 5,042 5,514 6. Non-metallic Products 3,279 3,852 5,030 3,279 3,852 5,030 7. Machinery & Equipment 7,196 10,061 9,416 7,196 10,061 9,416 8. Miscellaneous Products 586 322 379 586 322 379 Total Manu facturing 68,462 95,143 104,644 46,111 56,924 60,478
Pacific Island ; comprising of food manufacturing and others shown in the table
above. Table 24 in appendix VI shows the details of the type of manufacturing
industries and their corresponding gross output. The highest gross output can
be seen to be contributed by food manufacturing, which is essentially non-durable and used largely for immediate human consumption. Food manufacturing is futher
dominated by the suger and copra industries. These industries are based on
comperatively long term crops for their raw materials, unlike other manufacturing
industries, which have continous production and utilization of productive capacity.The post-independence industrial developmen, mostly non-resorurce based
manufacturing, has been directed towards import substitution to reduce economic
dependence and vulnerability. The overall industrial structure and scale of
production is characterised by small scale, mostly light industries, much of which
depends upon foreign capital and expertise.Employment in the industrial sector in 1983 consisted of; Mining & Quarry ing (1,229), Manufacturing (15,196), Electricity, Gas & Water (2,231). This accounted for 23 % of the total paid employment.
The presence of light industries is caused by the nature of the small island economy with limited resource, lack of capital and entreprenurship, and with a
small domestic market. The regional islands of the South Pacific serve as a major
external market for Fiji's manufactured products and woth the exception of suger and coconut oil, a small proportion is exported to Australia, New Zealand, and
the USA.
The manufacturing sector has however developed substantially to fulfill the domestic requirements, but faced great competition for similar products originating from newly developed cheap labor countries such as South Korea, Taiwan, and
Hongkong.
(ii) Lack of Key Industries
Industries such as chemical, petroleum, textile, woodworking, ceramic, and metal; which provide towords economic progress and stability; are reffered to as key industries.
Two foreign dominated shipbuilding firms, Carpenters Industrial and Bish
Ltd. each employ about 1000 workers for shipbuilding, assembling and repair. Connected with shipbuilding is a steelwork plant which makes steel framework and steel furniture with steel imported from Australia.
The foreign dominated chemical and petro-chemical industries are characterised
by supplying gas for domestic home and industrial use.
The textile industry stitches garmeans of imported fabric and so on. These
industries, although essential, do not provide the conventional type key industries
needed for capital formation. These industries, based on foreign capital, have
for these commodities are limited, consisting of the small domestic and the regional islands.
Historically, the development of the steel and iron industries, petro-chemical, and other capital intensive and high technology industries was recognised as essential for the reproduction and creation of value by way of processing of raw material. It also formed the base for capital reproduction by way of providing inputs for the production of means of production which is also essential towards industrial progress.
However, the small island economies do not posses such industrial raw material
and resources in ade quate quanties for heavy industrial development. Besides
lack of physical resources, the islands do not possess the necessary capital, tehnology
and enterprenual skills.
(iii) Necessity for Primary Industries
Fiji, besides being an island economy, also does not possess other necessary conditions to rely on industrial development as the base for economic progress
and development.
Industries have been limited to small scale production, most of which is
non-resource based manufacturing which developed in the last decade. The potential
for expansions constrained by limited market opportunities, small size of domestic markets, the smallness of the islands, the structure of international freight and tariffs, and a lack adequate resources for intustrial development. Accordimg central Planning Office :
"Mon-resource manufacturing has in significance. This is a healthy trend,
but its persistently low share and potential for expantion reveal that this type of industrialisation, although of consequence, cannot be relied upon as he engine of growth for Fiji's future development" (Central Planning Office. Fiji : Development Plant Eight; 1980-1985. p. 7).
Industrial development so far have urban orientated and therefore caused a relatively higher urban migration than of employment opportunities.
In light of the limited opportunities in expansion, the need to create rural employment and for a balanced development between rural and urban sectors, agicultural primary production must be seen as an option for economic development. This is also consistent with the theory of economic progress in that adequate
agricultural development is important before the development of mechanical
industries.
This than raise the question as what type of commercial agricutural production and mode of development would be suitable for small island economic as a means for earning foreign exchange, meeting basic food needs (indicated by high food import), providing employment economic progress and development; talking into
On the other hand, it can be seen that agricultural production for external trade requires considerable mechanisation of production ; improvement of seeds,
technology, and skills; and adaptations to adverse weather, crop and price,
fluctuations in order to effectively compete for markets with larger agricultural countries with similiar products; Fiji's market may still be relatively small.
In light of the present economic structure, agricultural modernisation would mean imported technology, mehanisation of equipment, imported fertilizer, seeds
and so on.
Suger and copra have so far been the most important agricultural crops in
terms of providing foreign exchange and employment. However, with the
small-scale production and unfavorable world market condistions and prices, continued reliance possess considerable risk.
Diversification within the suger and copra industries and possibilities in
alternate crops such as lumber, ginger, cocoa, and rice have been the major objective of the Development Plan Eight in order to provide a broader economic base and development. Diversification and commercialisation these crop for the long term need careful research before undertaking any major move, since it would involve new investment and development i.e. creating new institutions and ficilities. An option to potential agricultural and rural development and a sector which has long been considered as of socio-economic importance is the fisheries sector. Historically, fisheries within the primary industry has been subject to international capitalistic development unlike agriculture which developed with foreign capital
under the plantation system.
The scattered nature of the islands with poor agricutural resources leaves little option besides fisheries. Fisheries also involve the greater rural community and
provide a source of income and food. Fishheries have already been given importance
as a source of foreigr axchange in many of the islands of the region.
References
Bureau of Statistics 1985. Current Economic Statistics. 119 pp., Government Printer, Suva, Fiji.
CARSTAIERS. R. T. 1981. Impact of Foreign Direct Private lnvesment on the Fiji Economy. 113 pp., Center for Applied Studies in Development, USP, Suva, Fiji.
Central Planning Office 1980. Fiji's Eighth Development Plan 1981-1985: Policies
and Programmes for Regional Development (vol. 2). 221 pp., Government
Printer, Suva, Fiji.
FAIRBAIN, T.J. 1985. Island Economies: Studies from South Pacific. 442pp.,
FRY, G. E. 1981. Regionalism and the International Policies of the South Pacific. 32 pp., Australian National University, Canberra.
LLOYD, D. T. 1962. Fiji Society: Transactions and Proceedings. Vol.9. Fiji Land Boundary Survey Review. Fiji National Museum, Suva, Fiji.
Reserve Bank of Fiji 1984. Annual Report. 123 pp., Reserve Bank of Fiji, Suva,
Fiji.
SHARMA, P. 1984. An economic analysis of the efficiency of farms in Fiji. In :
Review 12, 35-43. School of Social and Economic Development, USP, Suva
Fiji.SHEPARD, C. V. 1945. The Suger Industry of Fiji. 60 pp., His Majectry's Stationary
Office, London.
SUTHERLAND, W. 1982. SPARTECA and the Future of Australia-South Pacific
Trade. 21 pp., Conference on Australia-South Pacific Relations. Burgmann
College, Canberra.
UTRECHT, E. (ed) 1984. Fiji, Client State of Australia? : Transnational Corporation Research Project. 390 pp., Australian National University, Canberra.


![Table 19. Size of farms in 1944 Number of [-] FT^ta rpf Tenants Contractors Up to 0.019 nil 141 0.02 to 0.039 22 640 0.04 to 0.059 105 711 0.06 to 0.079 114 440 0.08 to 0.099 595 373 0.10 to 0.119 1,502 378 0.12 to 0.139 960 238 0.14 to 0.159 440 214 0.16](https://thumb-ap.123doks.com/thumbv2/123deta/6402804.1107022/25.762.117.597.458.1049/table-size-farms-number-ft-rpf-tenants-contractors.webp)