A relatively higher concentration of zinc and strontium within normal levels in breast milk is associated with higher growth rates among breastfed neonate
11
0
0
全文
(2) Ai Ito, et al.. 206. feeding after emergency caesarean section. Over the period of observation for this study,. is likely to be delayed due to maternal. 208 deliveries were recorded in these three. 14). stress from protracted labour pain . These. centres. Among these 208 deliveries, 53 were. differences in infant feeding in the early. excluded based on the following criteria:. neonatal period may lead to differences in the. preterm birth (<37 weeks gestation), major. concentration of trace elements in breast milk. anomalies, chromosomal abnormality, and. after vaginal and caesarean section deliveries.. difficulty establishing breastfeeding due to. However, this plausible difference has not. maternal past history or treatment. Among. been evaluated in previous research.. the 155 eligible deliveries, informed consent. Breast milk is suitable for infants and. was obtained from 56 mothers. Of these, 4. includes the nutrients necessary for normal. mothers failed to collect their breast milk.. 4). infant growth and development . Trace. Ultimately, 52 mother-infant pairs were. elements, such as zinc and copper, are. included in our analysis, 26 in the vaginal. nutrients that are as important as protein. delivery group and 26 in the caesarean section. and lipid for infant development. Generally,. delivery group.. infants receive adequate amounts of trace. The following maternal factors were. elements from breast milk to meet their needs. included in the analysis: age, height and weight. for normal growth, while deficiency in trace. (used to calculate the body mass index, BMI),. elements can lead to adverse health effects in. parity, smoking history, and blood pressure at. infants15, 16). However, although the normal. the final health check-up. The following infant. concentration of trace elements in human. factors were included in the analysis: weight. breast milk has been defined, the contribution. of the placenta, gestational age, sex, and birth. of trace elements to infant growth is yet to. height and weight, measured immediately. be understood. Therefore, our aim was to. after delivery. Infant height and weight were. compare the concentration of trace elements. measured again at 1 month (28-43 days) post-. in breast milk between women who have. delivery, with the height and weight growth. undergone vaginal and caesarean section. rates per day, from birth to 1 month post-. deliveries, and to evaluate the association. delivery, calculated from medical records. The. between the concentration of trace elements. type of infant feeding over the first month. in breast milk and infant growth rates per day. after delivery was classified as breast feeding. from birth to one month.. (infant being fed only breast milk) and mixed feeding (infant being fed a combination of. II.Materials and Methods. breast milk and formula milk).. 1.Study group. This study was approved by the Ethics. Pairs of mothers and infants were recruited. Committee of Iwate Medical University. from the maternity service of Iwate Medical. School of Medicine (MH2018-006) and Morioka. University Hospital, Morioka Red Cross. Red Cross Hospital (30-3). Informed consent. Hospital, and the Kurokawa Ladies Clinic,. was obtained from all individual participants. between December 2017 and June 2018.. included in the study..
(3) Original: Zn and Sr are associated with growth. 207. 2.Collection of breast milk samples. an internal standard, 0.5 mg/L of rhodium. Breast milk was collected twice after. solution were used.. delivery, the first sample at a mean of 4.7. The within-run and total imprecision. days (transitional milk) and the second at a. were determined according to the NCCLS. mean of 32.6 days (mature milk). All breast. Approved Guideline 17) . Synthetic milk on. milk samples of 1.5 ml were collected in. the market was used and five replicates of. plastic containers prior to breakfast and. measurements per day were carried out.. cryopreserved at − 20℃ until measurement.. It took three days to measure all samples. 3. Measurement of the concentrations of. and one run of measurement per day were. trace elements in breast milk. carried out. This method produced within-run. Breast milk samples (0.5 ml) were pipetted. standard deviation of 2.9 ng/mL at 47.7 ng/. into a polypropylene tube (15 ml), and 2.0. mL (Mn), 0.04 ng/mL at 1.43 ng/mL (Co), 1.2. ml of ultrapure nitric acid (Kanto Chemical. ng/mL at 26.2 ng/mL (Ni ), 21 ng/mL at 431. Co., Tokyo, Japan) and 0.1 ml of an internal. ng/mL (Cu), 232 ng/mL at 3285 ng/mL (Zn),. standard solution (500 mg/L of Beryllium. 12.5 ng/mL at 53.0 ng/mL (Se), 23 ng/mL at. and Rhodium) were added to the sample.. 388 ng/mL (Rb), 13 ng/mL at 134 ng/mL (Sr),. The mixed breast milk sample solution was. 1.8 ng/mL at 21.4 ng/mL (Mo), respectively.. allowed to stand in the laboratory at room. Total precision gave a standard deviation of 9.7. temperature for 24 h. Samples were then. ng/mL at 47.7 ng/mL (Mn), 0.14 ng/mL at 1.43. heated to 60℃ for 24 h. After cooling, 3.0 ml. ng/mL (Co), 1.9 ng/mL at 26.2 ng/mL (Ni), 21. of hydrogen peroxide was added to the sample. ng/mL at 431 ng/mL (Cu), 158 ng/mL at 3285. solution, and the sample solution was heated to. ng/mL (Zn), 14.8 ng/mL at 53.0 ng/mL (Se), 10. 60℃ for 48 h. After cooling, 4.5 ml of ultrapure. ng/mL at 388 ng/mL (Rb), 10 ng/mL at 134. water (Milli-Q, Merck Darmstad, Germany). ng/mL (Sr), 0.5 ng/mL at 21.4 ng/mL (Mo),. was added to the sample solution, and the. respectively.. solution was stored at 4℃ until measurement.. 4.Statistical analysis. The concentrations of the following trace. We calculated mean values of maternal. elements were quantified in breast milk using. and infant characteristics and compared them. inductively-coupled plasma mass spectrometry. between the vaginal and caesarean section. (ICP-MS, ELAN DRC-e, PerkinElmer JAPAN,. delivery groups using a t-test or chi-squared. Yokohama): manganese (Mn), cobalt (Co),. test, as appropriate for the data type. The. nickel (Ni), copper (Cu), zinc (Zn), selenium (Se),. concentration of trace elements was compared. rubidium (Rb), strontium (Sr), and molybdenum. between the vaginal and caesarean section. (Mo). The optical parameters for ICP-MS. delivery groups and between transitional and. were as follows: power, 1.1 kw; carrier argon. mature milk of each group using a t-test. The. gas flow rate, 0.9 L/min; plasma argon flow. height and weight growth rates per day were. rate, 18 L/min; and ion voltage, 6.5 V. For the. calculated from the change in height and. determination of Se, methane gas was used. weight from birth to 1 month post-delivery.. to suppress the effects of polyatomic ions. As. The association between the concentrations.
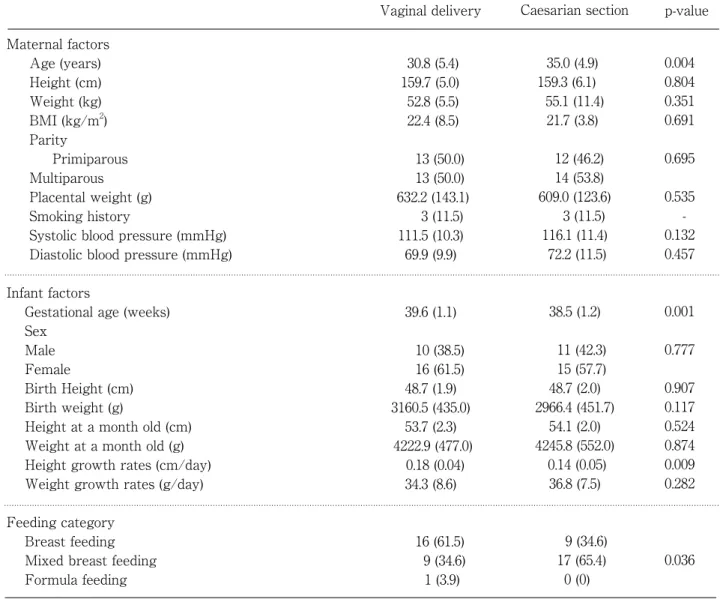
(4) Ai Ito, et al.. 208. Table 1. Characteristics of the study group Maternal factors Age (years) Height (cm) Weight (kg) BMI (kg/m2) Parity Primiparous Multiparous Placental weight (g) Smoking history Systolic blood pressure (mmHg) Diastolic blood pressure (mmHg) Infant factors Gestational age (weeks) Sex Male Female Birth Height (cm) Birth weight (g) Height at a month old (cm) Weight at a month old (g) Height growth rates (cm/day) Weight growth rates (g/day) Feeding category Breast feeding Mixed breast feeding Formula feeding. Vaginal delivery. Caesarian section. 30.8 (5.4) 159.7 (5.0) 52.8 (5.5) 22.4 (8.5). 35.0 (4.9) 159.3 (6.1) 55.1 (11.4) 21.7 (3.8). 13 (50.0) 13 (50.0) 632.2 (143.1) 3 (11.5) 111.5 (10.3) 69.9 (9.9). 12 (46.2) 14 (53.8) 609.0 (123.6) 3 (11.5) 116.1 (11.4) 72.2 (11.5). 0.695. 39.6 (1.1). 38.5 (1.2). 0.001. 10 (38.5) 16 (61.5) 48.7 (1.9) 3160.5 (435.0) 53.7 (2.3) 4222.9 (477.0) 0.18 (0.04) 34.3 (8.6). 11 (42.3) 15 (57.7) 48.7 (2.0) 2966.4 (451.7) 54.1 (2.0) 4245.8 (552.0) 0.14 (0.05) 36.8 (7.5). 0.777. 16 (61.5) 9 (34.6) 1 (3.9). 9 (34.6) 17 (65.4) 0 (0). p-value. 0.004 0.804 0.351 0.691. 0.535 0.132 0.457. 0.907 0.117 0.524 0.874 0.009 0.282. 0.036 . Data are expressed as means (standard deviations) or n (percentages). p values were by t-test or χ square test between vaginal delivery group and caesarean section group.. of trace elements and height and growth. regression coefficients and 95% confidence. rates was evaluated using multiple regression. intervals of these variables were computed. analysis. In these regression models, the. after standardizing each variable. P-values <0.05. height and weight growth rates per day were. were considered to be significant. All analyses. separately used as the dependent variable.. were performed using SPSS Statistics Desktop. Maternal factors (age, height, and weight,. version 21 (IBM Japan Inc., Tokyo, Japan).. which correlated with birth height and weight of infants), infant factors (placental weight and. III.Results. gestational weeks) and the concentration of. Table 1 summarizes the characteristics. each trace element in breast milk were used. of participants in the vaginal and caesarean. as independent variables. Standardized partial. section delivery groups. With regard to.
(5) Original: Zn and Sr are associated with growth. 209. Table 2. Trace element concentrations in breast milk based on groups: vaginal and caesarean section delivery A) Transitional milk Concentrations (ng/mL) Vaginal delivery Caesarian section Manganese Cobalt Nickel Copper Zinc Selenium Rubidium Strontium Molybdenum. 16.4 0.90 25.8 610 5089 95.4 824 63.9 9.3. (6.4) (0.20) (5.7) (188) (1529) (32.5) (171) (18.1) (3.2). B) Mature milk p-value. 11.9 (3.8) 0.86 (0.76) 24.1 (5.3) 536 (167) 5026 (1899) 102 (25.3) 780 (191) 61.8 (25.4) 10 (3.3). 0.004 0.505 0.261 0.138 0.896 0.419 0.379 0.728 0.344. Concentrations (ng/mL) Vaginal delivery Caesarian section 12.4 0.80 22.6 444 2310 60.4 566 55.1 4.5. (3.8) (0.17) (4.3) (152) (789) (24.5) (119) (16.9) (6.4). 10.4 0.76 21.5 411 2119 76.6 536 56.1 5.1. p-value. (5.3) (0.19) (6.0) (114) (890) (42.3) (126) (22.0) (5.4). 0.119 0.429 0.485 0.381 0.417 0.098 0.379 0.855 0.725. Data are expressed as means (standard deviations) . p values evaluated using a between-group t-test.. maternal factors, women in the caesarean. day was significantly higher in the vaginal. section delivery group were older at the. delivery group than in the caesarean section. time of delivery than those in the vaginal. delivery group (p=0.009). With regard to the. delivery group (p=0.004), with the groups. distribution of the type of feeding in the post-. being comparable on other measured factors.. natal period, mixed feeding was more frequent. Of note, both groups included 3 mothers with. in the caesarean section delivery group than. a smoking history. The history of parity was. in the vaginal delivery group (p = 0.036).. also comparable between the two groups.. Comparison of the concentration of trace. With regard to infant factors, the placental. elements is summarized in Table 2A for. weight was comparable between the two. transitional milk and in Table 2B for mature. groups. However, the mean gestational age. milk. In the transitional milk, the concentration. was significantly lower in the caesarean. of Mn was higher in the vaginal delivery. section delivery group than in the vaginal. group than in the caesarean section delivery. delivery group (p = 0.001). Of note, the sex. group (p = 0.004), with no other between-. distribution among infants was comparable. group differences in the concentration of trace. between the two groups, 10 boys and 16. elements. Moreover, there were no between-. girls in the vaginal delivery group and 11. group differences in the concentration of trace. boys and 15 girls in the caesarean section. elements in mature milk.. delivery group. Similarly, the average. The concentration of trace elements for. height and weight of infants at birth were. transitional and mature milk is reported in. comparable between the two groups. With. Table 3. The concentration of all trace elements. regard to the growth rate, although mean. was higher in transitional milk than in mature. weight gain per day was comparable between. milk. In particular, there was a decrease of. the two groups, the height growth rate per. about 60% in the concentration of Zn (from.
(6) Ai Ito, et al.. 210. Table 3. Trace element concentrations in transitional and mature breast milk Concentrations (ng/mL). p-value. Transitional milk. Mature milk. 14.1 (5.7) 0.88 (0.20) 24.9 (5.5) 573 (180) 5058 (1708) 98.7 (29.1) 802 (180) 62.9 (21.9) 9.7 (3.2). 11.4 (4.7) 0.78 (0.16) 22.1 (5.2) 428 (134) 2215 (838) 68.5 (35.2) 551 (122) 55.6 (19.4) 4.8 (5.9). Manganese Cobalt Nickel Copper Zinc Selenium Rubidium Strontium Molybdenum. < 0.001 0.001 0.003 < 0.001 < 0.001 < 0.001 < 0.001 0.048 < 0.001. Data are expressed as means (standard deviations). p values were evaluated using a paired t-test between transitional and mature milk.. Table 4. The association between the concentration of trace elements in mature milk in the breastfed group and infant height and weight growth rates per day Weight gains (g/day). Height gains (cm/day) Elements. β. 95%CI. p. β. 95%CI. p. Manganese. − 0.214. − 0.571 to 0.143. 0.225. − 0.143. − 0.586 to 0.300. 0.508. Cobalt. − 0.030. − 0.379 to 0.318. 0.858. 0.257. − 0.142 to 0.655. 0.195. Nickel. − 0.026. − 0.373 to 0.321. 0.876. 0.281. − 0.106 to 0.669. 0.146. Copper. 0.055. − 0.314 to 0.424. 0.759. − 0.127. − 0.544 to 0.289. 0.532. Zinc. 0.373. 0.072 to 0.673. 0.017. 0.044. − 0.426 to 0.513. 0.847. Selenium. − 0.115. − 0.467 to 0.237. 0.504. 0.038. − 0.462 to 0.539. 0.874. Rubidium. 0.068. − 0.331 to 0.467. 0.726. − 0.192. − 0.628 to 0.245. 0.371. Strontium. 0.044. − 0.365 to 0.453. 0.823. 0.411. 0.017 to 0.804. 0.041. − 0.159. − 0.503 to 0.185. 0.346. 0.262. − 0.125 to 0.649. 0.175. Molybdenum. The association between the concentrations of trace elements and height and growth rates was evaluated using multiple regression analysis. In these regression models, the height and weight growth rates per day were separately used as the dependent variable. Maternal factors (age, height, and weight, which correlated with birth height and weight of infants), infant factors (placental weight and gestational weeks) and the concentration of each trace element in breast milk were used as independent variables. Standardized partial regression coefficients and 95% confidence intervals of these variables were computed after standardizing each variable. β, Standardized partial regression coefficient; 95%CI, 95% confidence interval. 5058 ng/mL to 2115 ng/mL) and of about. and growth rates per day is reported in Table. 50% for Mo (from 9.7 ng/mL to 4.8 ng/mL).. 4.. The association between the concentration. observed between the height growth rate per. of trace elements in mature milk and height. day and the concentration of Zn (p = 0.017). A significant positive association was.
(7) Original: Zn and Sr are associated with growth. 211. and between the weight growth rate per day. for the early cessation of breastfeeding, and. and the concentration of Sr (p = 0.041).. they are expected to receive postpartum breastfeeding support14).. IV.Discussion. The concentration of trace elements. The concentrations of trace elements in. in breast milk was significantly different. breast milk were compared between 26. between lactation periods (Table 3), with. women who delivered vaginally and 26 who. the concentration of all trace elements. delivered via caesarean section. We observed. being significantly lower in mature milk. a significantly higher concentration of Mn. than in transitional milk. Previous studies. in transitional milk in the vaginal delivery. have similarly reported a decrease in. group, with no differences between the. the concentration of trace elements from. vaginal and caesarean section delivery groups.. transitional to mature milk, including a. Overall, the concentration of trace elements. decrease of about 20% in Mn 7), of 30- p-value. was significantly higher in transitional. 40% in Cu 7, 9), 50% in Zn 7, 9), and 50% in Mo 8),. milk than in mature milk. Furthermore, in. these changes being comparable to those in. infants who were only breastfed, there was. our study.. a significant association between the height. Hirose et al. reported that the mean daily. growth rate and Zn concentration in mature. intake of breast milk was 424 mL at 4 days. milk and between the weight growth rate. and 745 mL at a month after delivery. and Sr concentration in mature milk. Our. Based on these values of breast milk intake. finding of a higher concentration of Mn in. and our measured concentration of trace. transitional milk after vaginal delivery than. elements in transitional and mature milk, we. in that after caesarean section has not been. calculated the intake of trace elements per. previously reported. Therefore, the underlying. day, showing that the increase in milk intake. mechanism behind this high concentration. at 1 month compensated for decreases in the. is not clear. However, we did note that the. concentration of trace elements, such that. concentration of Mn in transitional milk. infants ingested similar quantities of trace. tended to be higher with greater gestational. elements with transitional and mature milk.. age, although this association was only. Kaneko et al. suggested that Zn concentration. marginally significant. This association might. might be high in transitional milk (colostrum). be explained by the longer gestation duration. to provide a sufficient intake of Zn in neonates,. in the vaginal delivery group than in the. despite a low volume of intake of breast. caesarean section delivery group (p=0.004).. milk 19). A similar mechanism might exist for. There were no significant differences between. all other trace elements.. the two groups in the concentrations of other. Several studies have reported on the. trace elements in breast milk. Although we. concentration of trace elements in breast. did not measure lactation in the present study,. milk. delayed onset of lactation in the caesarean. country and lactation periods. delivery has been identified as a risk factor. the same lactation period, the concentration. 1-13). 18). .. . These concentrations do vary by 4-10, 12, 13). . For.
(8) Ai Ito, et al.. 212. of trace elements was similar to those 11). accumulate in the bone tissue of neonates.. ,. Although the mechanism is not clear, we. 9,. speculate that relatively high concentrations. . Identified differences between countries. of Sr in mature milk may contribute to. might reflect the differences in dietary habit,. favourable growth during the neonatal period,. as well as differences in trace elements. increasing the rate of weight gain.. reported in a previous study in Japan. but different from those in other countries 10). in soil. 1-3, 5). . Of note, the concentration of. Three main limitations of our study should. Zn and Cu in our study was comparable. be considered in the interpretation of our. to previously reported concentrations. 6, 7). .. results. First, the number of infants who. Moreover, if maternal dietary intakes of Zn. were breastfed over the 1 month after birth. and Cu are sufficient, supplementation does. was small, i.e., 36.0% in the caesarean section. not increase the concentration of Zn and Cu in. delivery group and 61.5% in the vaginal. 11). breast milk . Therefore, the concentration of. delivery group. Furthermore, our follow-up. these two elements appears to be constant,. period was short, i.e., a month post-delivery.. so long as the intake of these elements is. As breastfeeding influences growth up to six. sufficient, and the concentration is not further. months post-delivery, the association between. increased by dietary supplementation.. the concentration of elements in breast milk. Among infants who were breastfed, we. and infant growth rates could be better. confirmed that Zn and Sr concentrations. clarified using a longer observation period.. in mature milk were significantly associated. Second, we did not confirm the accuracy of our. with height and weight growth rates,. method for measurement using a certificated. respectively. Zn deficiency interferes with the. standard material, though we confirmed the. metabolism of thyroid hormones, androgens,. within-run and total imprecision. In contrast,. and growth hormones. 20). . Specifically, insulin-. our results demonstrate comparable levels. like growth factors-1 (IGF-1) exert a growth-. with those from previous reports. Therefore,. promoting action, with Zn playing a specific. our method is expected to be valid for. role in the regulation of circulating IGF-1. the construction of this study. Third, the. 21). concentration . As such, the relatively higher. growth of infants is related to intake such as. concentration of Zn in mature milk might. carbohydrates, proteins and lipids, and amount. promote height growth during the neonatal. of breast milk sucked by breast feeding. period. As the concentration of Zn in mature. infants, however, we had difficulty measuring. milk was within the normal range, the effects. and analyzing these. Despite these limitations,. of Zn deficiency on growth could not be. we did demonstrate an association between a. evaluated.. relatively higher concentration of Zn and Sr in. Studies have confirmed the transfer of Sr from breast milk to infants. 22). . In humans,. 99% of Sr is distributed in the bone tissue. 23). .. mature milk and a greater rate of height and weight gain. We consider this finding to be of clinical value.. Therefore, we can assume that the majority. In conclusion, our comparison of the. of Sr ingested from breast milk would. concentration of trace elements in transitional.
(9) Original: Disasters and children’ s behavior problems. and mature milk after vaginal and caesarean section deliveries revealed a significantly higher concentration of Mn in transitional milk in the vaginal delivery group, with no difference between groups for mature milk. We do confirm a higher concentration of all trace elements in transitional milk than in mature milk. We identified a significant association between higher concentrations of Zn and Sr in mature milk and a higher height. 213. Acknowledgments The authors wish to thank the mothers and their infants for participating in this study. We are grateful to Dr. Kazuyoshi Itai (Professor, Faculty of Nutritional Sciences, Morioka University) for his technical assistance. The authors acknowledge Dr. Yukie Yoshida (Morioka Red Cross Hospital) and Dr. Yorishige Kurokawa (Kurokawa Ladies Clinic) for supporting this study. Conflict of interest: The authors have no conflict of interest to declare.. and weight growth rate among infants who were only breastfed over the first post-natal month.. References 1) Yoshida M, Takada A, Hirose J, et al.: Molybdenum and chromium concentrations in breast milk from Japanese women. Biosci Biotechnol Biochem 72, 2247-2250, 2008. 2) Hattori H, Ashida A, Ito C, et al.: Determination of molybdenum in foods and human milk, and an estimate of average molybdenum intake in the Japanese population. J Nutr Sci Vitaminol 50, 404-409, 2004. 3) Vuori E, Mäkinen SM, Kara R, et al.: The effects of the dietary intakes of copper, iron, manganese, and zinc on the trace element content of human milk. Am J Clin Nutr 33, 227231, 1980. 4) L i n T H , J o n g Y J , C h i a n g C H , e t a l . : Longitudinal changes in Ca, Mg, Fe, Cu, and Zn in breast milk of women in Taiwan over a lactation period of one year. Biol Trace Elem Res 62, 3141, 1998. 5) Dorea JG: Selenium and breast-feeding. Br J Nutr 88, 443-461, 2002. 6) Silvestre MD, Lagarda MJ, Farré R, et al.: A study of factors that may influence the determination of copper, iron, and zinc in human milk during sampling and in sample individuals. Biol Trace Elem Res 76, 217-227, 2000. 7) Friel JK, Andrews WL, Jackson SE, et al.: Elemental composition of human milk from mothers of premature and full-term infants. during the first 3 months of lactation. Biol Trace Elem Res 67, 225-247, 1999. 8) Aquilio E, Spagnoli R, Seri S, et al.: Trace element content in human milk during lactation of preterm newborns. Biol Trace Elem Res 51, 63-70, 1996. 9) Yamawaki N, Yamada M, Kanno T, et al.: Macronutrient, mineral and trace element composition of breast milk from Japanese women. J Trace Elem Med Biol 19, 171-181, 2005. 10) Hannan MA, Dogadkin NN, Ashur IA, et al.: Copper, selenium, and zinc concentrations in human milk during the first three weeks of lactation. Biol Trace Elem Res 107, 11-20, 2005. 11) Nakamori M, Ninh NX, Isomura H, et al.: Nutritional status of lactating mothers and their breast milk concentration of iron, zinc and copper in rural Vietnam. J Nutr Sci Vitaminol 55, 338345, 2009. 12) Klein LD, Breakey AA, Scelza B, et al.: Concentrations of trace elements in human milk: Comparisons among women in Argentina, Namibia, Poland, and the United States. PLoS One 12, e0183367, 2017. 13) Parr RM, DeMaeyer EM, Iyengar VG, et al.: Minor and trace elements in human milk from Guatemala, Hungary, Nigeria, Philippines, Sweden, and Zaire. Results from a WHO/IAEA joint project. Biol Trace Elem Res 29, 51-75, 1991..
(10) 214. Ai Ito, et al.. 14) Scott JA, Binns CW and Oddy WH: Predictors of delayed onset of lactation. Matern Child Nutr 3, 186-193, 2007. 15) Kodama H: Trace element deficiency in infants and children - clinical practice-. Jpn Med Assoc J 47, 376–381, 2004. 16) Obara T, Komatsu N, Itsumura N, et al.: Zinc deficiency in low zinc breast milk related to maternal ZnT2 gene mutation. J Jpn Pediatr Soc 120, 1649-1656, 2016. 17) Kennedy JW, Carey RN, Coolen RB, et al.: Evaluation of precision performance of clinical chemistry devices; approved guideline. NCCLS EP5-A 19, 1-43, 1999. 18) Hirose J, Endo M, Nagao S, et al.: Amount of breast milk sucked by Japanese breast feeding infants. J Jpn Soc Breastfeed Res 2, 23-28, 2008. 19) Kaneko T and Yamawaki N: Trace elements in Japanese maternal milk and infant formula. Biomed Res Trace Element 15, 235-242, 2004.. 20) Hamza RT, Hamed AI and Sallam MT: Effect of zinc supplementation on growth hormoneinsulin growth factor axis in short Egyptian children with zinc deficiency. Ital J Pediatr 38, 21, 2012. 21) Ninh NX, Thissen JP, Collette L, et al.: Zinc supplementation increases growth and circulating insulin-like growth factor 1 (IGF-1) in growthretarded Vietnamese children. Am J Clin Nutr 63, 514-519, 1996. 22) Harrison GE, Sutton A, Shepherd H, et al.: Strontium balance in breast-fed babies. Br J Nutr 19, 111-117, 1965. 23) ICRP: Age-dependent doses to members of the public from intake of radionuclides: Part 2. Ingestion dose coefficients. ICRP Publication 67, pp. 95-120, Pergamon Press, Oxford, 1993..
(11) 岩手医誌 72 巻,5 号(令和 2 年 12 月)205-215 頁.. 母乳中の亜鉛とストロンチウム濃度は 新生児期の成長に関与する 伊藤歩惟 1),藤田友嗣 2),和田泰格 1), 豊島浩志 1),松本 敦 1),小山耕太郎 1) 1). 岩手医科大学医学部,小児科学講座 岩手医科大学医学部,救急・災害・総合医学講座. 2). (Received on January 17, 2020 & Accepted on February 13, 2020). 要旨 経腟分娩及び帝王切開で出産した母親の母乳中微 量元素濃度の違いが児の成長に及ぼす影響は明らか ではない.本研究の目的は,経腟分娩及び帝王切開で 出産した母親の母乳中微量元素濃度の違いを明らか にし,母乳中微量元素濃度と新生児期における児の成 長との関連を評価することである.母親から移行乳 (産後 4 - 6 日)と成乳(産後 28 - 43 日)を採取し,誘導 結合プラズマ質量分析法を用いて,母乳中のマンガン ( Mn ),コバルト( Co ) ,ニッケル( Ni ) ,銅( Cu ) ,. 亜鉛( Zn ) ,セレン( Se ) ,ルビジウム( Rb ) ,ストロ ンチウム( Sr ) ,モリブデン( Mo )の濃度を測定した. 移行乳中の Mn 濃度のみが帝王切開群よりも経腟分娩 群で有意に高値だった.全ての微量元素濃度は成乳よ りも移行乳で高値を示した.成乳中の Zn 濃度は児の 1日あたりの身長増加量と,成乳中の Sr 濃度は児の 1日あたりの体重増加量と正の関連を認めた.正常範 囲内における高濃度の Zn と Sr は児の成長を促進す る可能性がある.. 215.
(12)
図
関連したドキュメント
In this article we study a free boundary problem modeling the tumor growth with drug application, the mathematical model which neglect the drug application was proposed by A..
All three problems (1*, 2*.1 2*.2) are open; there are conjectures which would provide complete answers to these problems and some partial results supporting these conjectures
We present sufficient conditions for the existence of solutions to Neu- mann and periodic boundary-value problems for some class of quasilinear ordinary differential equations.. We
Equivalent conditions are obtained for weak convergence of iterates of positive contrac- tions in the L 1 -spaces for general von Neumann algebra and general JBW algebras, as well
R.Brown and J-L.Loday [5] noted that if the second dimension G 2 of a simplicial group G, is generated by the degenerate elements, that is, elements coming from lower dimensions,
[7] Martin K¨ onenberg, Oliver Matte, and Edgardo Stockmeyer, Existence of ground states of hydrogen-like atoms in relativistic quantum electrodynam- ics I: The
“Breuil-M´ezard conjecture and modularity lifting for potentially semistable deformations after
Then it follows immediately from a suitable version of “Hensel’s Lemma” [cf., e.g., the argument of [4], Lemma 2.1] that S may be obtained, as the notation suggests, as the m A
