Precise Temporal Profiling of Signaling
Complexes in Primary Cells Using SWATH Mass Spectrometry
Author Hiroaki Kitano, Etienne Caron, Romain
Roncagalli, Takeshi Hase, Witold E. Wolski, Meena Choi, Marisa G. Menoita, Stephane Durand, Antonio Garcia‑Blesa, Ivo
Fierro‑Monti, Tatjana Sajic, Moritz heusel, Tobias Weiss, Marie Malissen, Ralph
Schlapbach, Ben C. Collins, Samik Ghosh, Ruedi Aebersold, Bernard Malissen, Matthias Gstaiger journal or
publication title
Cell Reports
volume 18
number 13
page range 3219‑3226
year 2017‑03‑28
Publisher Elsevier
URL http://id.nii.ac.jp/1394/00000200/
doi: info:doi/10.1016/j.celrep.2017.03.019
Creative Commons Attribution 4.0 International
(http://creativecommons.org/licenses/by/4.0/)
Resource Precise Temporal Profiling of Signaling Complexes in Primary Cells Using SWATH Mass Spectrometry
Graphical Abstract
Highlights
d
Temporal proteomic profiling in primary cells using DIA/
SWATH mass spectrometry
d
Identification of GRB2 interactors in primary T cells
d
Developing and mature T cells show distinct dynamics of GRB2 protein interactions
d
Broad applicability of our workflow for dissecting mammalian signaling systems
Authors
Etienne Caron, Romain Roncagalli, Takeshi Hase, ..., Ruedi Aebersold, Bernard Malissen, Matthias Gstaiger
Correspondence
[email protected] (B.M.), [email protected] (M.G.)
In Brief
Caron et al. apply an advanced workflow that combines mouse genetic
engineering, affinity purification-SWATH mass spectrometry, and open-source software platforms to accurately and reproducibly quantify high-confidence, time-resolved protein interactions in primary T cells isolated from mouse tissues.
Accession Numbers
PXD003973 PXD003972
Caron et al., 2017, Cell Reports 18 , 3219–3226
March 28, 2017 Crown Copyright ª 2017
http://dx.doi.org/10.1016/j.celrep.2017.03.019
Cell Reports
Resource
Precise Temporal Profiling
of Signaling Complexes in Primary Cells Using SWATH Mass Spectrometry
Etienne Caron,
1,10Romain Roncagalli,
2,10Takeshi Hase,
3Witold E. Wolski,
4Meena Choi,
5Marisa G. Menoita,
2Stephane Durand,
2Antonio Garcı´a-Blesa,
2Ivo Fierro-Monti,
1Tatjana Sajic,
1Moritz Heusel,
1Tobias Weiss,
6Marie Malissen,
2Ralph Schlapbach,
4Ben C. Collins,
1Samik Ghosh,
3Hiroaki Kitano,
3,7Ruedi Aebersold,
1,8Bernard Malissen,
2,9,* and Matthias Gstaiger
1,11,*
1
Department of Biology, Institute of Molecular Systems Biology, ETH Zurich, 8093 Zurich, Switzerland
2
Centre d’Immunologie de Marseille-Luminy, Aix Marseille Universite´, INSERM, CNRS, 13288 Marseille, France
3
The Systems Biology Institute, Tokyo 108-0071, Japan
4
Functional Genomics Center Zurich, ETH Zurich and University of Zurich, 8057 Zurich, Switzerland
5
College of Science, College of Computer and Information Science, Northeastern University, Boston, MA 02115, USA
6
Department of Neurology and Brain Tumor Center, University Hospital Zurich and University of Zurich, 8091 Zurich, Switzerland
7
Okinawa Institute of Science and Technology Garuda School, 904-0495 Okinawa, Japan
8
Faculty of Science, University of Zurich, 8006 Zurich, Switzerland
9
Centre d’Immunophe´nomique, Aix Marseille Universite´, INSERM, CNRS, 13288 Marseille, France
10
Co-first author
11
Lead Contact
*Correspondence: [email protected] (B.M.), [email protected] (M.G.) http://dx.doi.org/10.1016/j.celrep.2017.03.019
SUMMARY
Spatiotemporal organization of protein interactions in cell signaling is a fundamental process that drives cellular functions. Given differential protein expres- sion across tissues and developmental stages, the architecture and dynamics of signaling interaction proteomes is, likely, highly context dependent. How- ever, current interaction information has been almost exclusively obtained from transformed cells. In this study, we applied an advanced and robust workflow combining mouse genetics and affinity purification (AP)-SWATH mass spectrometry to profile the dy- namics of 53 high-confidence protein interactions in primary T cells, using the scaffold protein GRB2 as a model. The workflow also provided a sufficient level of robustness to pinpoint differential interaction dynamics between two similar, but functionally distinct, primary T cell populations. Altogether, we demonstrated that precise and reproducible quanti- tative measurements of protein interaction dynamics can be achieved in primary cells isolated from mammalian tissues, allowing resolution of the tis- sue-specific context of cell-signaling events.
INTRODUCTION
Dynamic organization of protein-protein interactions in signaling networks is essential to coordinate cellular functions in response to extrinsic and intrinsic signals. Affinity purification coupled with
mass spectrometry (AP-MS) has been the method of choice to identify protein-protein interactions and protein complexes in various model systems (Hauri et al., 2013; Glatter et al., 2011).
The majority of AP-MS studies to date used epitope-tagged bait proteins expressed exogenously in transformed cell lines.
The use of exogenous bait expression may, in most cases, result in the correct identification of physiological binding partners, but the measured binding stoichiometries are likely to be affected upon exogenous overexpression compared to the correspond- ing endogenous protein. One other drawback is connected to the usage of transformed cell lines. Although cell lines provide many advantages in terms of flexibility and scalability, they may not reflect molecular processes and signaling events occur- ring in vivo under physiological conditions (Astoul et al., 2001).
Cellular transformation, clonal selection of cell lines, and adapta- tion to in vitro cell-culture conditions result in changes in protein abundances as well as in posttranslational modifications, which, in turn, are likely to affect the quality and kinetic behavior of signaling interaction networks as compared to primary cells.
Therefore, it remains difficult to extend the conclusions reached in such cell lines to primary cells. Moreover, a given signaling pathway often operates in different cell types or at different developmental stages. For instance, the T cell antigen receptor (TCR) functions both in the thymus during T cell development and in mature T cells found in secondary lymphoid organs. It may, therefore, be hazardous to use models of TCR signaling established in mature T cells to interpret results corresponding to developing T cells (Fu et al., 2014). To circumvent these limi- tations, we have developed knockin mice that bear an epitope tag that permits AP-MS of protein complexes isolated from pri- mary cells belonging to various tissues or representing various developmental stages (Roncagalli et al., 2014).
Cell Reports 18 , 3219–3226, March 28, 2017 Crown Copyright ª 2017 3219
This is an open access article under the CC BY-NC-ND license (http://creativecommons.org/licenses/by-nc-nd/4.0/).
Growth-factor-receptor-bound protein 2 (GRB2) is an essen- tial adaptor protein made of one SH2 domain and two SH3 do- mains. GRB2 interacts through its central SH2 domain with phosphorylated tyrosines found in the cytoplasmic tail of acti- vated tyrosine kinase receptors (RTKs) (Songyang et al., 1994), linking them to Son of Sevenless (SOS), a family of guanine nucleotide exchange factors (GEFs) that act on Ras small GTPases and regulate the mitogen-activated protein kinase (MAPK) signaling pathway (McCormick, 1993). In T lymphocytes, GRB2 is also part of the TCR signaling network and involved in both the control of T cell development and the activation of mature T cells (Jang et al., 2009). Given the central role played by GRB2 in signal initiation and diversification, knowledge of the composition and dynamics of the signalosomes that form around it in distinct signaling cascades and cell types is, thus, key to understanding the scope of its actual functions. We, there- fore, selected GRB2 as a model for evaluating whether SWATH
(sequential window acquisition of all theoretical fragment ion spectra)-MS (Gillet et al., 2012, 2016) could enable rapid, reliable, and accurate quantitative analysis of protein interaction dynamics in two types of primary cells that were extemporane- ously isolated from mouse (Figure 1).
RESULTS
Mapping the GRB2 Interactome in Peripheral CD4
+T Cells
To identify the proteins that interact with GRB2 prior to or after TCR-mediated activation of primary mouse T cells, we first generated a line of gene-targeted mice expressing a One- STrEP-tag (OST) at the carboxyl terminus of endogenous GRB2 proteins (called GRB2
OSTmice) (Figure S1A). We showed that primary T cells from GRB2
OSTmice are normal and amenable to AP-SWATH analysis (Figure S1; Supplemental Experimental Procedures). We then measured the abundance of affinity-purified proteins from GRB2
OSTmice and compared it with their corresponding abundances from AP using wild- type (WT) control mice, which do not express the OST affinity tag. CD4
+primary T cells from GRB2
OSTand WT mice were lysed before or after activation with anti-CD3 and anti-CD4 antibodies for 0.5, 2, 5, and 10 min and subjected to single-step AP and sub- sequent MS analysis. Our MS workflow involved data-depen- dent acquisition (DDA) for protein identification and generation of a spectral library containing 3,577 target peptides and 25,356 transitions, which we used for targeted analysis of the acquired data-independent acquisition (DIA) data. Among the 658 proteins identified with a false discovery rate (FDR) <1%, 53 qualified as high-confidence GRB2 interactors based on their enrichment in GRB2
OSTrelative to WT control purifications (for details on filtering, see the Supplemental Experimental Procedures).
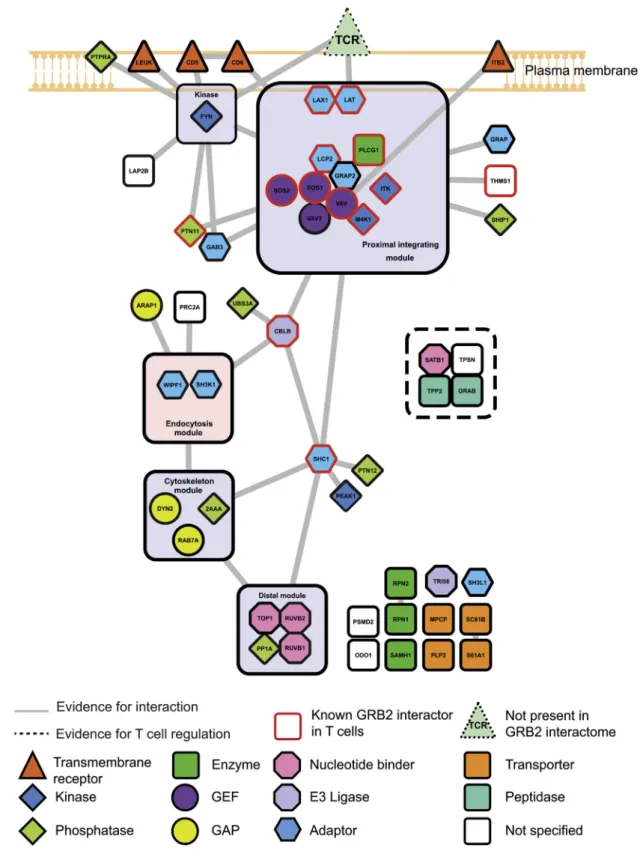
Taking into account already described physical protein-pro- tein interactions and incorporating protein functionalities and data provided by the literature allowed us to highlight protein modules potentially relevant to understanding the GRB2 roles (Figure 2; Data S1). Although the CD4
+T cells used in this study have been solely stimulated via the TCR and CD4, the proteins associated with GRB2 following TCR-CD4 engagement con- tained several transmembrane receptors distinct from the TCR.
The intracytoplasmic segment of most of them constitutes sub- strates for protein tyrosine kinase and may have thus provided docking sites for the GRB2 SH2 domain. Consistent with pub- lished reports, ITB2, a subunit of the integrin LFA-1, was part of the GRB2 interactome. Interestingly, LEUK (also known as CD43 or leukosialin) and the CD5 and CD6 cell-surface receptor constituted additions to the GRB2 interactome. Following TCR- CD4 engagement, GRB2 also interacted with the transmem- brane adaptors LAT and LAX, the SLP76 (also known as LCP2) and GRAP2 cytosolic adaptors, and the GEFs SOS1 and SOS2 and VAV1 and VAV3, reinforcing the view that GRB2 connects several receptors expressed at the surface of CD4
+T cells to key players of T cell activation. The GRB2 interactome also comprised proteins involved in endocytosis (WIPF1 and SH3K1), actin cytoskeleton remodeling (the GTPase-activating proteins [GAPs] ARAP1 and the adaptor SHC1), and lysosomal Figure 1. AP-SWATH Workflow Schematic for Mapping the
Composition and Dynamics of the GRB2 Interactome in Primary T Cells
(Left) Overview of affinity purification (AP) of primary mouse T cells isolated from WT mice (GRB2
WT) and from knockin mice expressing endogenous GRB2 tagged with a One-STrEP-tag (OST) (GRB2
OST). T cells were isolated before or after stimulation for 0.5, 2, 5, and 10 min with anti-CD3 and anti-CD4 antibodies followed by affinity purification of GRB2 protein complexes using Strep-Tactin Sepharose beads. (Upper right) Overview of MS analysis. Affinity- purified samples were acquired in both DIA/SWATH and DDA/shotgun modes (for a detailed description, see Aebersold and Mann, 2016; Gillet et al., 2016).
Data were used to build a high-confidence GRB2 interactor-specific assay library. Visualization of AP-SWATH data, quantification, and statistics analysis were performed in Skyline. (Lower right) Clustering of interaction dynamics and network-based analysis were performed using the Garuda platform, a com- munity-driven software platform that supports reproducibility of computational analysis from complex high-dimensional data.
See also Figures S1 and S2.
3220 Cell Reports 18 , 3219–3226, March 28, 2017
Figure 2. The GRB2 Interactome in Peripheral CD4
+T Cells
The advanced workflow applied in this study enabled the identification of 53 high-confidence direct or indirect GRB2 interactors in resting and activated CD4
+T cells. Proteins were classified according to their function or protein family (see key). GRB2 interactors that have been previously identified in T cells from public databases are border painted in red. Components of modules are defined by the degree of interconnectivities of preys, subcellular localizations, and described functionalities. GAP, GTPase-activating protein; GEF, guanine-exchange factor.
See also Figure S3 and Data S1.
Cell Reports 18 , 3219–3226, March 28, 2017 3221
degradation (the E3 ubiquitin-protein ligase CBLB). An AP- MRM-based study using EGFR (epidermal growth factor re- ceptor)-stimulated fibroblasts also suggested that SHC1 acts as a cytoskeleton organizer through the recruitment of PTPN12 (also known as PTP-PEST) and PEAK1 (also known as SgK269), both of them having also been found in the GRB2 inter- actome of primary T cells. Some GRB2 interactors can be group- ed in a ‘‘distal module’’ (Figure 2) that is primarily made of pro- teins containing nucleotide-binding domains, the function of which remains to be established in the context of TCR signaling.
Overall, 22 of the 53 high-confidence interactors have not been previously reported, and 41 of them have not been previously observed in T cells (Figure 2; Data S1). Whereas some of the
22 GRB2-interacting partners identified here have been reported to be involved in T cell activation (e.g., SATB1 and GRAB), several of them (RPN1/2, SH3L1, and SC61B) have not been characterized in the context of the TCR signaling pathway yet.
To independently confirm the GRB2 interactions identified through AP-SWATH, we performed co-immunoprecipitation (co-IP) and western blotting experiments and focused on CD5 and ARAP-1, two GRB2 partners identified in T cells for which commercial antibodies were available. Co-IP of CD5 and ARAP1 from cell lysates of WT CD4
+T cells stimulated with anti-CD3 plus anti-CD4 antibodies for 2 min independently vali- dated the interaction between CD5 and ARAP-1 with GRB2 iden- tified by AP-SWATH (Figure S3D). CD5 is an important organizer of ubiquitylation following TCR stimulation (Voisinne et al., 2016), and the identification of GRB2 within the CD5 signalosome further unveils its complexity. Taken together, these results and the ones provided by the AP-SWATH analysis of the GRB2
OSTmolecule delineate comprehensive maps of the GRB2 interactome in both resting and activated primary mouse CD4
+T cells.
Reproducible Quantitative Measurements of GRB2 Protein Interactions in Peripheral CD4
+T Cells
The development of methods that enable precise and robust quantitative measurements of protein abundances is important in facilitating statistics and downstream computational analysis for the identification of meaningful protein interaction patterns (Collins et al., 2013; Lambert et al., 2013). Generation of highly precise and reproducible AP-SWATH data from primary cells is, therefore, crucial for understanding dynamic complex forma- tion at the physiological level. Here, we assessed the reproduc- ibility of AP-SWATH analysis to quantify the dynamics of the GRB2 interactome 0.5, 2, 5, and 10 min after TCR-mediated T cell activation. Targeted analysis of AP-SWATH data was per- formed using a refined assay library consisting of 604 peptides and 4,020 transitions specific for GRB2 and 53 high-confidence GRB2 interactors identified earlier, followed by manual valida- tion of the extracted peak groups in Skyline (MacLean et al., 2010) (Figure S3; Data S1). The 53 proteins were consistently quantified across the time series (Figures 3A and S4A), i.e., before and after T cell stimulation, in all four biological repli- cates, and the median coefficient variation (CV) ranged from 19.7% to 33.2%, a finding comparable to CVs calculated from AP-SWATH studies conducted using transformed cell lines (Collins et al., 2013; Lambert et al., 2013) (Figure 3C;
Data S1). Of note, highly reproducible and accurate quantifica- tion was not compromised using a short liquid chromatography (LC) gradient of 30 min, thereby enhancing the throughput of time course experiments (Figure S4E). Therefore, rapid and robust quantitative measurements of high-confidence, time- resolved GRB2 protein interactions can be achieved from pri- mary mouse CD4
+T cells.
Transparent Analysis of Time-Resolved GRB2 Protein Interactions in Peripheral CD4
+T Cells
Generation of robust quantitative measurements, together with transparency and reproducibility of downstream computa- tional analysis—including statistics analysis—is fundamental Figure 3. Precise and Reproducible Quantification of Proteins
Interacting with GRB2 in Peripheral CD4
+T Cells
(A) The heatmap shows log
2fold change for 53 high-confidence GRB2 inter- actors upon stimulation of peripheral CD4
+T cells. Recruited, stable, and dissociated proteins are in red, black, and green, respectively. Statistically significant changes with adjusted p values < 0.05, for at least one time point, are indicated by the asterisks at the right of the map. Statistics were calculated in Skyline using MSstats.
(B) Dynamics of interactions were clustered using the Garuda software plat- form and normalized as the percentage of the maximal value for each kinetic.
Representative clusters (i.e., cluster 1 and 7) are shown.
(C) Distribution of percent CV. Median CV is indicated in parentheses for each stimulation time point. Four biological replicates for each stimulation time point were used to evaluate biological reproducibility at protein level.
(D) Kinetics for 12 clustered and representative GRB2 interactors.
*Adjusted p < 0.05; **adjusted p < 0.01; ***adjusted p < 0.001. Error bars represent SD.
See also Figures S4 and S5 and Data S1.
3222 Cell Reports 18 , 3219–3226, March 28, 2017
for rigorous validation of findings within the scientific community from complex high-dimensional data (Peng, 2011). Toward this goal, AP-SWATH data were analyzed in this study using two open-source software systems: the graphical user interface MSstats in Skyline for raw data analysis (Choi et al., 2014) and the Garuda platform for further data processing and visualization (Ghosh et al., 2011), both supporting reproducibility of statistics and computational analysis. Using these software tools, we generated heatmaps, protein clusters, and statistics demon- strating that protein assemblies of increasing complexity formed around GRB2 within the first seconds of T cell activation (Figures 3A, 3B, and S4). Among the clustered interactors (Figure S5), 77% were recruited by GRB2 complexes post-stimulation, with significant fold changes ranging from 1.3 (TPSN; p = 0.012) to 118 (LAT; p = 4 3 10
11) when compared to unstimu- lated T cells (Data S1). More precisely, a subset of 18 interactors involving known components of the TCR signaling pathway (e.g., LAT, LCP2, SOS1, VAV1, and ITK) showed maximal association with GRB2 30 s post-stimulation and then disassembled from the bait with different kinetics (Figures 3D and S4). Interestingly, the adaptor SHC1 was the sole protein that significantly reached its maximal association with GRB2 at a later time point (fold change = 14.3, and p = 4 3 10
9at 5 min after stimulation) (Figure 3D). In contrast, two proteins (ARAP1 and PTPRA) disassembled from GRB2 complexes after TCR stimulation (Fig- ure 3D). Moreover, network-based analysis revealed a high level of functional interconnectivity between established components of the TCR signaling pathway and the clustered GRB2 interac- tors (Figure S5). Interestingly, PRC2A (Proline Rich Coiled-Coil 2A, also known as BAT2), a poorly characterized protein, strongly associated with GRB2 30 s after T cell activation (fold change = 6.1; p = 3.8 3 10
6) and slowly disassembled over time—a kinetic similar to the one observed for well-estab- lished components of the TCR signaling pathway, e.g., LAT, SOS1, VAV1, SLP-76/LCP2, and CBLB (Figure 3D). Since func- tionally related proteins may show similar kinetics of assembly- disassembly in response to cell stimulation (Garcı´a-Marque´s et al., 2016), this result suggests a role for PRC2A in TCR signaling. Collectively, these quantitative AP-SWATH data pro- vided a systematic and accurate view of the temporal reorgani- zation of the GRB2 protein interaction network after TCR-medi- ated activation of peripheral CD4
+T cells. Further experiments would be needed to assess the functional significance of these kinetics as well as the potential role of poorly characterized GRB2 interactors in TCR-mediated T cell activation.
The Dynamics of Specific GRB2 Interactors Differ between Developing and Mature T Cells
T cell development occurs in the thymus and proceeds through discrete stages defined on the basis of the expression of CD4 and CD8 molecules. Immature double-negative (CD4 CD8 ) thymocytes develop into double-positive (CD4
+CD8
+) thymo- cytes. After receiving TCR-mediated signals, a few CD4
+CD8
+thymocytes mature further into CD4
+and CD8
+single-positive thymocytes that migrate to the periphery, where they give rise to mature CD4
+and CD8
+T cells. Considering that the TCR signals driving the differentiation of double-positive thymo- cytes are conveyed via GRB2 (Radtke et al., 2016) and that those
thymocytes constitute over 90% of the TCR
+CD4
+cells present in a thymus, we tested next whether the dynamics of the GRB2 interactome differ between developing and mature T cells following activation with anti-CD3 plus anti-CD4 antibodies.
Thymocytes were purified from GRB2
OSTmice and GRB2-OST protein complexes isolated prior to and at various time points after TCR stimulation. Three biological replicates were prepared for each time point as described earlier for mature CD4
+T cells.
The corresponding GRB2
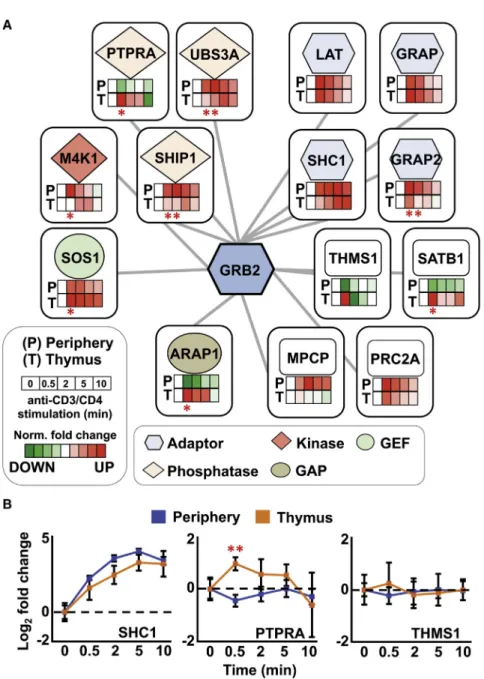
OSTsamples were subjected to SWATH-MS, and we concurrently analyzed the AP-SWATH datasets in Skyline for quantitative comparison using the estab- lished high-confidence GRB2-interactor-specific assay library (Data S1). Among the proteins that constituted the GRB2 interac- tome, only 14 GRB2 interactors were consistently detected in both developing and mature T cells and can, thus, be used for comparative analysis across the entire kinetic (Figures 4 and S6; Data S1). The number of GRB2 interactors identified in both mature and developing T cells is relatively low, and further experiments would be needed to evaluate whether many high- confidence GRB2 interactors in developing T cells were lost dur- ing the experimental procedures. Nevertheless, similar temporal profiles were observed between developing and mature T cells for 6 of the 14 time-resolved GRB2 interactors (LAT, GRAP, MPCP, PRC2A, SHC1, and THMS1) (Figures 4 and S6; Data S1 and S2). For instance, SHC1 associated with GRB2 in a pro- gressive fashion in both mature and developing T cells and reached maximal interaction with GRB2 5 min post-TCR activa- tion in both T cell populations (Figure 4B). Interaction profiles be- tween GRB2 and THEMIS remained relatively stable across the time series in both mature and developing T cells (Figure 4B).
In contrast, ARAP1, GRAP2, M4K1, PTPRA, SATB1, SHIP1, SOS1, and USB3A showed a significant differential kinetics of GRB2 association between developing and mature T cells for at least one stimulation time point (Figures 4 and S6; Data S1).
For instance, the association of the receptor-protein tyrosine phosphatase PTPRA with GRB2 transiently increased in a signif- icant manner 30 s after stimulation of developing T cells (fold change = 1.94, p = 0.005), whereas a slight but significant tran- sient dissociation of PTPRA and GRB2 was found in peripheral CD4
+T cells (fold change = 1.31, p = 0.03). Interestingly, this particular kinetic pattern was also observed with SATB1 and ARAP1 (Figure S6). This observation might suggest the exis- tence of a complex that involves GRB2, PTPRA, SATB1, and ARAP1, since correlations in protein association with a given bait as a function of time of TCR stimulation support the occur- rence of physical association between them (Voisinne et al., 2016). Although further experiments would be needed to test this hypothesis, our results led us to conclude that the workflow presented in this study provided a sufficient level of quantitative accuracy to distinguish similar and differential protein interaction dynamics between two functionally distinct primary T cell populations.
DISCUSSION
Canonical signaling pathways, as defined by the analysis of transformed cell lines grown in vitro, do not reflect the properties of cell-signaling systems operating in vivo in primary cell types of
Cell Reports 18 , 3219–3226, March 28, 2017 3223
our tissues. Given differential protein expression across tissues, it is conceivable that a canonical core pathway that acts in different tissues may operate in a context-specific fashion, leading to tis- sue-specific differences in the quality and kinetics of processes controlled by the signaling system. This, in turn, may cause differ- ential phenotypic consequences in response to the same cellular signal. Systematic analysis of context-dependent properties of signaling systems is, therefore, essential for rationalizing and pre- dicting differential phenotypic outcome in response to the same signals across different tissues. Specific and dynamic formation of protein-protein interaction represents a key mechanism for regulating properties of cellular signaling. However, building pathway models that correctly reflect the properties of a signaling system in primary cells on the basis of public protein interaction data is compromised by the shortcomings of established methods to systematically retrieve protein interaction data.
Figure 4. Quantitative Comparison between the Dynamics of GRB2 Protein Complexes in Developing versus Mature Primary T Cells (A) The GRB2 protein-protein interaction network displays the association of time-dependent pro- teins following anti-CD3 and anti-CD4 stimula- tion in mature/peripheral CD4
+T cells (P) and developing/thymocytes (T). Nodes represent 15 proteins, including GRB2, that were consistently detected and reproducibly quantified in both pe- ripheral CD4
+T cells and thymocytes. Rectangles inside the nodes show the normalized (Norm.) log
2fold change for each time point as the percentage of the maximal (red) or minimal value (green). The significantly different GRB2 protein interactions between the two cell types, as determined by MSstats, are indicated by an asterisk (*adjusted p < 0.05).
(B) Quantitative temporal profiling of three repre- sentative GRB2 interactors upon activation of peripheral T cells (blue) or thymic T cell (orange).
The significantly different GRB2-PTPRA interac- tion, as determined by MSstats, between the two cell types at 0.5 min post-stimulation is indicated (**adjusted p < 0.01).
Error bars represent SD. See also Figure S6 and Data S1.
Most systematic protein-protein interac- tions studies, to date, do not address the dynamic nature of protein complex for- mation. Moreover, the vast majority of data on protein interactions has been obtained by the analysis of a heteroge- neous set of transformed cell lines, which complicates the development of coherent pathway models. Altogether, cell signaling depends on tissue-context- dependent formation of transient signaling complexes, but precise, quantitative, and reproducible information on context-spe- cific complex formation is vastly missing in the literature.
Here, we introduced a workflow that combines genetic engi- neering and SWATH-MS to address these shortcomings. Using the SH2 and SH3 domains containing versatile signaling adaptor GRB2 as a model, we could demonstrate that the presented method provided a sufficient level of precision and robustness to accurately probe the remodeling of signaling complexes following the activation of primary T cells and established context dependencies of GRB2-associated signaling in devel- oping and mature T cells. We anticipate that our generic method could be broadly applied to rapidly expedite the robust temporal profile of protein interactomes from a range of cell and tissue types. When combined with the recent possibility to edit the mouse genome in a fast-track manner via CRISPR/Cas9 (Yang et al., 2013), our approach will permit the deciphering of how tissue-specific context impacts cell-signaling events at the organismal level.
3224 Cell Reports 18 , 3219–3226, March 28, 2017
EXPERIMENTAL PROCEDURES
A brief summary of experimental procedures is provided in the following text (refer to the Supplemental Information for detailed procedures).
Generation of GRB2OSTMice
Knockin mice expressing endogenous GRB2 proteins tagged at their carboxyl terminus with an OST were generated as described in the Supplemental Experimental Procedures. Mice were maintained in specific pathogen-free conditions, and all experiments were done in accordance with institutional committees and French and European guidelines for animal care.
Stimulation of Isolated Primary T Cells and AP of Protein Complexes
CD4
+T cells were isolated from pooled lymph nodes and spleens with a Dyna- beads Untouched Mouse CD4
+T Cell Kit and were stimulated for 0.5, 2, 5, and 10 min with anti-CD3 and anti-CD4 antibodies, followed by AP of GRB2 protein complexes using Strep-Tactin Sepharose beads. Detailed protocols are pro- vided in the Supplemental Experimental Procedures.
MS
Data acquisition (DDA and DIA modes), assay library generation, and targeted extraction of AP-SWATH data were performed as described previously (Collins et al., 2013; Schubert et al., 2015), using the Skyline software. Details of the procedures are provided in the Supplemental Experimental Procedures.
Filtering Criteria for the Identification of High-Confidence GRB2 Interactors
High-confidence GRB2 interactors were identified using a three-step filtering with both DDA and SWATH AP-MS data, followed by manual validation of high-confidence GRB2 interactors in Skyline (see Figures S2 and S3). Details of the procedures are provided in the Supplemental Experimental Procedures.
Statistics and Computational Analysis
Statistical and computational analyses were performed using MSstats in Skyline (Broudy et al., 2014; Choi et al., 2014) and the Garuda platform (Ghosh et al., 2011). Both Skyline and Garuda are open-source software systems sup- porting the reproducibility of statistics and computational analysis by the sci- entific community. Details can be found in the Supplemental Experimental Procedures.
ACCESSION NUMBERS
The accession number for the MS shotgun data (centroided mzXML and identified peptides in a pepXML report), which were used to generate the spectral and assay libraries reported in this paper is PRIDE: PXD003973 (Viz- caı´no et al., 2013). The accession number for the SWATH-MS data (instrument raw/wiff files and identified peptides in an OpenSWATH report) reported in this paper is PRIDE: PXD003972. Skyline files are available for AP-SWATH data analysis at the Panorama Public website: https://panoramaweb.org/labkey/
publication_APSWATH_GRB2.url. Packaged Garuda gadgets and recipe documents are available at https://www.dropbox.com/s/w2xafks09tfwdpk/
GarudaDataRecord.zip?dl=0.
SUPPLEMENTAL INFORMATION
Supplemental Information includes Supplemental Experimental Procedures, six figures, and two data files and can be found with this article online at http://dx.doi.org/10.1016/j.celrep.2017.03.019.
AUTHOR CONTRIBUTIONS
E.C. and R.R. generated and analyzed the data and wrote a draft of the manu- script; M.G.M. and S.D. prepared MS samples; B.M. supervised the genera- tion of the
GRB2OSTmice; I.F.-M., A.G.-B., T.S., and M.H. generated and analyzed some of the data; W.E.W., M.C., T.W., S.G., T.H., and B.C.C.
analyzed the data; R.S., M.M., H.K., and R.A. provided key insights. B.M.
and M.G. designed the study and finalized the writing of the manuscript with contributions from all authors.
ACKNOWLEDGMENTS
We thank Fre´de´ric Fiore, Elodie Caccomo-Garcia, and Fabien Danjan for the construction of
GRB2OSTmice. We thank Ludovic Gillet and Yansheng Liu for instrument maintenance, as well as all members of the Aebersold labora- tory for discussions. We thank Jianmin Wu for technical support with the PINA database. This work was supported by CNRS, INSERM, the European Research Council (FP7/2007–2013 grant no. 322465 [‘‘Integrate’’] to B.M.), and the Agence Nationale de la Recherche (PHENOMIN project to B.M.).
R.A. acknowledges the following grant support: TBVAC2020 (2-73838-14), ERC grant Proteomics v3.0 (ERC-2008-AdG_20080422), ERC Proteomics 4D (670821), and the Swiss National Science Foundation (3100A0-688 107679). M.G. acknowledges the support by the Innovative Medicines Initia- tive project ULTRA-DD (FP07/2007-2013, grant no. 115766). B.M. and R.A.
acknowledge the support of the MSDAVENIR Fund.
Received: February 9, 2017 Revised: February 28, 2017 Accepted: March 3, 2017 Published: March 28, 2017
REFERENCESAebersold, R., and Mann, M. (2016). Mass-spectrometric exploration of prote- ome structure and function. Nature
537, 347–355.
Astoul, E., Edmunds, C., Cantrell, D.A., and Ward, S.G. (2001). PI 3-K and T-cell activation: limitations of T-leukemic cell lines as signaling models.
Trends Immunol.
22, 490–496.Broudy, D., Killeen, T., Choi, M., Shulman, N., Mani, D.R., Abbatiello, S.E., Mani, D., Ahmad, R., Sahu, A.K., Schilling, B., et al. (2014). A framework for in- stallable external tools in Skyline. Bioinformatics
30, 2521–2523.Choi, M., Chang, C.-Y., Clough, T., Broudy, D., Killeen, T., MacLean, B., and Vitek, O. (2014). MSstats: an R package for statistical analysis of quantitative mass spectrometry-based proteomic experiments. Bioinformatics
30, 2524–
2526.
Collins, B.C., Gillet, L.C., Rosenberger, G., Ro¨st, H.L., Vichalkovski, A., Gstaiger, M., and Aebersold, R. (2013). Quantifying protein interaction dy- namics by SWATH mass spectrometry: application to the 14-3-3 system.
Nat. Methods
10, 1246–1253.Fu, G., Rybakin, V., Brzostek, J., Paster, W., Acuto, O., and Gascoigne, N.R.J.
(2014). Fine-tuning T cell receptor signaling to control T cell development.
Trends Immunol.
35, 311–318.
Garcı´a-Marque´s, F., Trevisan-Herraz, M., Martı´nez-Martı´nez, S., Camafeita, E., Jorge, I., Lopez, J.A., Me´ndez-Barbero, N., Me´ndez-Ferrer, S., Del Pozo, M.A., Iba´n˜ez, B., et al. (2016). A novel systems-biology algorithm for the anal- ysis of coordinated protein responses using quantitative proteomics. Mol. Cell.
Proteomics
15, 1740–1760.Ghosh, S., Matsuoka, Y., Asai, Y., Hsin, K.Y., and Kitano, H. (2011). Software for systems biology: from tools to integrated platforms. Nat. Rev. Genet.
12,821–832.
Gillet, L.C., Navarro, P., Tate, S., Ro¨st, H., Selevsek, N., Reiter, L., Bonner, R., and Aebersold, R. (2012). Targeted data extraction of the MS/MS spectra generated by data-independent acquisition: a new concept for consistent and accurate proteome analysis. Mol. Cell. Proteomics
11, O111.016717.
Gillet, L.C., Leitner, A., and Aebersold, R. (2016). Mass Spectrometry Applied to Bottom-Up Proteomics: Entering the High-Throughput Era for Hypothesis Testing. Annu. Rev. Anal. Chem. (Palo Alto, Calif.)
9, 449–472.Glatter, T., Schittenhelm, R.B., Rinner, O., Roguska, K., Wepf, A., J€ unger, M.A., Ko¨hler, K., Jevtov, I., Choi, H., Schmidt, A., et al. (2011). Modularity and hormone sensitivity of the Drosophila melanogaster insulin receptor/target of rapamycin interaction proteome. Mol. Syst. Biol.
7, 547.
Cell Reports 18 , 3219–3226, March 28, 2017 3225
Hauri, S., Wepf, A., van Drogen, A., Varjosalo, M., Tapon, N., Aebersold, R., and Gstaiger, M. (2013). Interaction proteome of human Hippo signaling:
modular control of the co-activator YAP1. Mol. Syst. Biol.
9, 713.Jang, I.K., Zhang, J., and Gu, H. (2009). Grb2, a simple adapter with complex roles in lymphocyte development, function, and signaling. Immunol. Rev.
232, 150–159.
Lambert, J.P., Ivosev, G., Couzens, A.L., Larsen, B., Taipale, M., Lin, Z.Y., Zhong, Q., Lindquist, S., Vidal, M., Aebersold, R., et al. (2013). Mapping differ- ential interactomes by affinity purification coupled with data-independent mass spectrometry acquisition. Nat. Methods
10, 1239–1245.
MacLean, B., Tomazela, D.M., Shulman, N., Chambers, M., Finney, G.L., Fre- wen, B., Kern, R., Tabb, D.L., Liebler, D.C., and MacCoss, M.J. (2010). Skyline:
an open source document editor for creating and analyzing targeted prote- omics experiments. Bioinformatics
26, 966–968.
McCormick, F. (1993). Signal transduction. How receptors turn Ras on. Nature
363, 15–16.
Peng, R.D. (2011). Reproducible research in computational science. Science
334, 1226–1227.Radtke, D., Lacher, S.M., Szumilas, N., Sandrock, L., Ackermann, J., Nitschke, L., and Zinser, E. (2016). Grb2 is important for T cell development, Th cell dif- ferentiation, and induction of experimental autoimmune encephalomyelitis.
J. Immunol.
196, 2995–3005.Roncagalli, R., Hauri, S., Fiore, F., Liang, Y., Chen, Z., Sansoni, A., Kanduri, K., Joly, R., Malzac, A., La¨hdesma¨ki, H., et al. (2014). Quantitative proteomics
analysis of signalosome dynamics in primary T cells identifies the surface re- ceptor CD6 as a Lat adaptor-independent TCR signaling hub. Nat. Immunol.
15, 384–392.