Variation in process quality measures of diabetes care by region and institution in Japan during 2015–2016: An observational study of nationwide claims data
Takehiro Sugiyama
a,b,c,*, Kenjiro Imai
a, Noriko Ihana-Sugiyama
a, Hirokazu Tanaka
a,b, Ayako Yanagisawa-Sugita
a,b, Takayoshi Sasako
d, Takahiro Higashi
e,
Tomonori Okamura
f, Toshimasa Yamauchi
d, Kohjiro Ueki
g, Mitsuru Ohsugi
a,*, Takashi Kadowaki
h,i,*aDiabetes and Metabolism Information Center, Research Institute, National Center for Global Health and Medicine, 1-21-1 Toyama, Shinjuku-ku, Tokyo 162-8655, Japan
bDepartment of Public Health/Health Policy, Graduate School of Medicine, The University of Tokyo, 7-3-1 Hongo, Bunkyo-ku, Tokyo 113-8654, Japan
cDepartment of Health Services Research, Faculty of Medicine, University of Tsukuba, 1-1-1 Tenno-dai, Tsukuba, Ibaraki 305-8575, Japan
dDepartment of Diabetes and Metabolic Diseases, Graduate School of Medicine, The University of Tokyo, 7-3-1 Hongo, Bunkyo-ku, Tokyo 113-8655, Japan
eCenter for Cancer Registries, Center for Cancer Control and Information Services, National Cancer Center, 5-1-1 Tsukiji, Chuo-ku, Tokyo 104-0045, Japan
fDepartment of Preventive Medicine and Public Health, Keio University School of Medicine, 35 Shinanomachi, Shinjuku-ku, Tokyo 160-8582, Japan
gDiabetes Research Center, Research Institute, National Center for Global Health and Medicine, 1-21-1 Toyama, Shinjuku-ku, Tokyo 162-8655, Japan
hDepartment of Prevention of Diabetes and Lifestyle-Related Diseases, The University of Tokyo, 7-3-1 Hongo, Bunkyo-ku, Tokyo 113-8655, Japan
iDepartment of Metabolism and Nutrition, Teikyo University Mizonokuchi Hospital, 5-1-1 Futago, Takatsu-ku, Kawasaki, Kanagawa 213-8507, Japan
A R T I C L E I N F O
Article history:
Received 18 January 2019 Received in revised form 26 April 2019
A B S T R A C T
Aims:To calculate process quality measures of diabetes care in Japan using nationwide exclusive claims database.
Methods:Using the National Database of health insurance claims during 2015–2016, the proportions of outpatients who received recommended examinations at least annually
https://doi.org/10.1016/j.diabres.2019.05.029
0168-8227/Ó2019 The Authors. Published by Elsevier B.V.
This is an open access article under the CC BY-NC-ND license (http://creativecommons.org/licenses/by-nc-nd/4.0/).
* Corresponding authors at: Diabetes and Metabolism Information Center, Research Institute, National Center for Global Health and Medicine, 1-21-1 Toyama, Shinjuku-ku, Tokyo 162-8655, Japan (T. Sugiyama, M. Ohsugi). Department of Prevention of Diabetes and Lifestyle-Related Diseases, The University of Tokyo, 7-3-1 Hongo, Bunkyo-ku, Tokyo 113-8655, Japan (T. Kadowaki).
E-mail addresses:[email protected](T. Sugiyama),[email protected](K. Imai),[email protected](N. Ihana- Sugiyama),[email protected](H. Tanaka),[email protected](A. Yanagisawa-Sugita),[email protected](T. Sasako), [email protected](T. Higashi),[email protected](T. Okamura),[email protected](T. Yamauchi),[email protected](K. Ueki), [email protected](M. Ohsugi),[email protected](T. Kadowaki).
Contents available atScienceDirect
Diabetes Research and Clinical Practice
jo u r n a l h o m e p a g e :w w w . e l s e v i e r . c o m /l o c a t e / di a br e s
Accepted 22 May 2019 Available online 20 June 2019
Keywords:
Claims data Diabetes
Health services research Japan
Quality of care
among those with regular antidiabetic medication were calculated as quality indicators, reported altogether and by prefecture and institutional certification (from the Japan Diabetes Society). Distributions of institutional-level quality indicators were also reported.
Results: Among 4,154,452 outpatients, 96.7% underwent HbA1c or glycated albumin exam- ination. Retinopathy examination was conducted among 46.5% of patients [prefecture (range): 37.5%–51.0%, institutional certification: 44.8% (without) vs. 59.8% (with)]. Urinary qualitative examination was conducted among 67.3% of patients at institutions with
<200 beds (prefecture: 54.1%–81.9%, institutional certification: 66.8% vs. 92.8%), whereas urinary quantitative albumin or protein examination was conducted among 19.4% of patients (prefecture: 10.8%–31.6%, institutional certification: 18.7% vs. 54.8%). Distributions of institutional-level quality indicators showed that most institutions without institutional certification seldomly order urinary quantitative examination.
Conclusions: Although the quality indicator for glycaemic control examination was favour- able, some aspects of diabetes care were suboptimal and varied greatly by prefecture and institution; individual and organisational efforts to improve quality of diabetes care would be needed in Japan.
Ó2019 The Authors. Published by Elsevier B.V. This is an open access article under the CC BY- NC-ND license (http://creativecommons.org/licenses/by-nc-nd/4.0/).
1. Introduction
Diabetes is a growing health threat to people worldwide.
Approximately 425 million adults were estimated to have dia- betes in 2017 [1]. Diabetes undermines patient’s health through complications; approximately 28 million patients with diabetes worldwide have vision-threatening diabetic retinopathy[2], whereas the incidence of end-stage renal dis- ease with diabetes as the primary cause in 2015 ranged from 11% to 66% among 56 countries participating in the survey[3].
Regular examinations and appropriate treatments for patients with diabetes are warranted to prevent complica- tions. For example, regular albuminuria examination can detect diabetic kidney disease and prevent further worsening by early intervention and is therefore recommended in clini- cal guidelines [4–7]. Among antihypertensive medications, angiotensin-converting enzyme (ACE) inhibitors and angio- tensin II receptor blockers (ARBs) have been proven to effec- tively prevent nephropathy progression[8].
Some insurers and accreditation organisations require reporting of the performance of examinations/prescriptions as quality indicators (QIs) regarding process aspects and demand higher QIs for greater reimbursement and accredita- tion[9,10]. For glycated haemoglobin (HbA1c) measurement, its result has also been evaluated (outcome measure)[9,10].
Through these efforts, process measures in quality of dia- betes care are generally fair or satisfactory in the US and Eur- ope[11–15], although variation in quality of diabetes care by state has been reported in the US[16].
In Japan, comprehensive measurement of QIs has been challenging; comparison by prefecture or institutional char- acteristics has been particularly difficult. Owing to the univer- sal health coverage and uniform reimbursement system[17], claims data are a promising source for evaluating QIs.
Although several previous studies have reported quality of diabetes care in Japan[18–21], the data used in these studies were not comprehensive.
The National Database of Health Insurance Claims and Specific Health Check-ups of Japan (NDB)[22], a nationally
representative and exclusive database of claims and based- on-the-law health check-up data, has recently become avail- able. Within this context, we aimed to measure quality of dia- betes care in Japan using the NDB. We also investigated whether the quality differed by prefecture (the 47 official geo- graphical regions) and institutional certification by the Japan Diabetes Society (JDS).
2. Research design and methods
2.1. Study designWe conducted an observational study using the NDB. In the NDB project, based on the Act on Assurance of Medical Care for Elderly People, all medical and pharmaceutical claims col- lected electronically from hospitals, clinics, and pharmacies by each insurer, are submitted to the Ministry of Health, Labour and Welfare (MHLW) and then anonymised[22]. The proportion of electronic claims has been rapidly increasing;
as of April 2015, 98.4% of claims from hospitals/clinics and 99.9% from pharmacies were submitted electronically [23].
The NDB covers most information [e.g. anonymous individual identification number, gender, age, anonymous institutional identification number, prefecture, medical care procedure code (a code representing a series of medical care procedures that is reimbursable from health insurance), ICD-10 code, and drug code] from electronic claims, whereas medical activities not reimbursed by health insurance are not included (e.g.
examinations covered by public assistance, prescriptions cov- ered by industrial incident compensation insurance, exami- nations within preventive health check-up). The MHLW offers partial NDB data to policymakers and/or researchers for the purpose of administration and/or research. We received extracted data in October 2017 after approval from the MHLW review committee. We complied with the guideli- nes on the use of NDB data and rules that we defined; pre- specified researchers used the NDB data only in a secure room. Our research proposal was also approved by the Insti- tutional Review Board (NCGM-G-002492-00). Informed con-
2
d i a b e t e s r e s e a r c h a n d c l i n i c a l p r a c t i c e 1 5 5 ( 2 0 1 9 ) 1 0 7 7 5 0sent was waived by the board because the database was anonymised before provided by the MHLW.
2.2. Participants
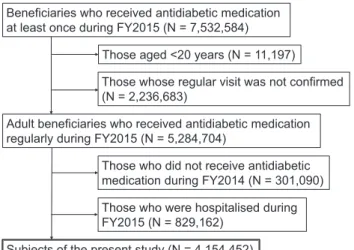
Fig. 1shows participant selection process. Adult beneficiaries who regularly received antidiabetic medication (at least every 3 months, since most patients visit hospitals/clinics at least every 3 months in Japan) from April 2015 to March 2016 [fiscal year (FY) 2015] were included. We excluded those who did not receive antidiabetic medication from FY2014, in order to investigate the quality of care not immediately after the diag- nosis. In addition, we excluded those hospitalised during the FY2015 for the following reasons: (1) in Japan, it is common for patients with diabetes to be hospitalised, not inevitably, to receive patient education, medication titration and screen- ing for complications and (2) hospitalisation could change the probability of receiving certain examinations or medications.
Consequently, the sample comprised 4,154,452 patients.
When calculating each quality indicator, we excluded patients who were deemed as out of indication for the exam- inations/prescriptions of interest and those whose claims information about the examinations/prescriptions of interest may have been underreported because of the comprehensive payment system. When calculating QIs by institution, we also excluded patients whose antidiabetic medication was pre- scribed at institutions where nine or fewer patients received antidiabetic medication (23%–25% of institutions, correspond- ing to 1.3%–2.2% of patients).
During data processing, we used an anonymous patient identifier called ‘‘ID1”that the MHLW prepared using a hash function the following parameters: insurer number, benefi- ciary number, gender, and date of birth. Although this leaves possibility that people who changed their insurer during the observation period may have been double-counted, restrict- ing the analysis to adults who received regular prescription throughout a year excluded most of such individuals.
While defining antidiabetic medication, Voglibose 0.2 mg was excluded due to its application for patients with impaired glucose tolerance. Detailed information about each item is provided in ESM Table 2.
2.3. QIs
For the present study, QIs were developed by the authors based on the clinical guidelines and confirmed at the research team meeting that was attended by the representatives of related academic societies (the presidents and executive board members of the Japan Diabetes Society, Japanese Circu- lation Society, Japanese Society of Nephrology and Japanese Society of Ophthalmic Diabetology) as well as public health researchers. We cited newer versions of the guidelines[5,7]
compared with those that were available during the observa- tion period (the Practice Guideline 2013 and Treatment Guide for Diabetes 2014–2015) because only the latest versions offer an English edition or review. We confirmed that the related recommendations did not change with the newer versions.
QIs were calculated as the proportions of patients who expe- rienced recommended examinations and/or medication among patients who supposedly required these examina- tions/medications with a sufficient frequency during a certain period [(1) HbA1c or glycated albumin (GA) examination, (2) retinopathy examination, (3) urinary qualitative examination, (4) urinary quantitative protein or albumin examination, (5) ACE inhibitor or ARB use, detailed in ESM Table 1]. When cal- culating each QI, we excluded some patients in the light of indication and/or comprehensive payment; in particular, for urinary examinations, patients who visited outpatient clinics at institutions with200 beds were excluded because urinary examination could be underreported due to a comprehensive payment rule[24]. For prescriptions, both in-institution and out-of-institution dispensing were included. For all QIs, the frequency and the observation period were set primarily as at least once a year during FY 2015. We determined additional required frequency for each examination QI using recent guidelines[4–7].
2.4. Institutional information
We collected the following information about each institu- tion: prefecture, institutional size (number of beds, cate- gorised into 0–19, 20–99, 100–199, or200), and certification status as an educational institution by the JDS. We submitted information about number of beds[25]and JDS certification [26]to the MHLW and requested new categorical variables to be added in the anonymous data.
We determined an institution that prescribed antidiabetic medication in FY2015 for each patient. For those who received medication from multiple institutions, one institution was selected based on the following criteria: (1) institutions that prescribed medication in more months, (2) institutions with JDS certification, (3) institutions with more beds, and (4) insti- tutions where the first prescription was provided in FY2015.
In cases where the institution could not be determined by the abovementioned criteria [369 patients (0.01%)], one insti- tution was randomly selected from the candidates.
2.5. Patient-level covariates
The following patient-level information was collected: gen- der, age category, type of diabetes, and type of medication.
Beneficiaries who received antidiabetic medication at least once during FY2015 (N = 7,532,584)
Adult beneficiaries who received antidiabetic medication regularly during FY2015 (N = 5,284,704)
Subjects of the present study (N = 4,154,452)
Those whose regular visit was not confirmed (N = 2,236,683)
Those who did not receive antidiabetic medication during FY2014 (N = 301,090) Those who were hospitalised during FY2015 (N = 829,162)
Those aged <20 years (N = 11,197)
Fig. 1 – Flowchart showing the selection of study sample.
Age information was as of the end of FY2015 and categorised as <40, 40–49, 50–59, 60–69, 70–79, 80–89, and90 years. For type of diabetes, a patient was classified as ‘‘type 1 diabetes” or ‘‘type 2 diabetes or other”. Medication was dichotomised as with or without insulin.
2.6. Statistical analysis
We first described the patient characteristics and then calcu- lated the following five QIs for the total sample: (1) HbA1c or GA examination, (2) retinopathy examination, (3) urinary qualitative examination, (4) urinary quantitative protein or albumin examination, and (5) ACE inhibitor or ARB use among patients receiving antihypertensive medication. As described above, the required frequency for calculating QIs was set primarily as ‘‘at least once a year”, along with addi- tional reasonable frequencies for each examination QI deter- mined using recent guidelines [4–7]. For retinopathy examination, we used data from FY2014–FY2015 and calcu- lated the proportion of patients receiving the examination at least once in 2 years. We also calculated the QIs by prefec- ture and JDS certification. For reference, we also showed the proportion of patients who were on anti-hypertensive medi- cation among those with diabetes (total, by prefecture and by JDS certification) as well as scatter plots and the results of bivariate linear regression analysis illustrating the prefecture-level relationship between the proportion of anti- hypertensive medication use and the proportion of ACE inhi- bitor and ARB use among patients receiving anti-hypertensive medications.
Additionally, we calculated the QIs with the required fre- quency of at least once a year for each prescribing institution;
for example, if 100 patients received antidiabetic medication at a clinic during FY2015 and 60 of 100 patients underwent a retinopathy examination at least once during FY2015 at any medical institution, the QI of retinopathy examination for the clinic was calculated as 60%. In the series of analyses, as described above, we excluded institutions that cared for nine or fewer patients receiving antidiabetic medication because these institutions tended to have more deviated QIs (at the extreme, institutions that cared for only one patient could have a QIs of either 0% or 100%). We illustrated the dis- tributions of QIs by JDS certification, prefecture, and institu- tional size.
To infer prefecture-specific quality of care independent of patient and/or institutional characteristics, we estimated QIs with the required frequency of at least once a year adjusted for patient and institutional factors; for this purpose, we first performed a multiple logistic regression with the out- come variables of whether examinations/prescriptions was conducted and the independent variables of prefecture (main predictor), gender, age category, type of diabetes, type of antidiabetic medication, hypertension medication use (except for the model for ACE inhibitor or ARB use), number of beds, and JDS certification. We then used logistic regression models for marginal standardisation and obtained marginal probabil- ities of conducting appropriate examinations/prescriptions by prefecture, considered as adjusted QIs. We estimated the adjusted QIs by JDS certification using a similar method.
All statistical analyses were performed using Stata 15.2 (StataCorp, College Station, TX, USA). All analyses were con- ducted upon complete data because few missingness existed.
3. Results
The characteristics of the study subjects are reported in Table 1. Approximately 2% of patients were diagnosed as type 1 diabetes during FY2015, whereas 14.8% of patients received insulin prescription. Approximately 11.0% of patients received antidiabetic medication at an institution with JDS certification.
Table 2shows the QIs as a whole and stratified by prefec- ture and JDS certification. HbA1c or GA examinations were conducted at least once a year for 96.7% of patients receiving antidiabetic medication, at least twice a year for 92.6% of them, and at least 4 times a year for 77.9% of patients.
Retinopathy examination was conducted at least once a year for 46.5% of patients receiving antidiabetic medication, whereas 56.2% underwent retinopathy examination with a frequency of at least once in 2 years. Urinary quantitative pro- tein or albumin examination was much less frequently con- ducted, occurring at least once a year for 19.4% of patients receiving antidiabetic medication and at least twice a year for 10.0% of them. An ACE inhibitor or ARB were prescribed for 76.9% of patients receiving antihypertensive medication at least once a year.Table 2 shows QIs by prefecture (mini- mum and maximum) and JDS certification; ESM Table 3 pre- sents the full list of crude QIs by prefecture; ESM Fig. 1 shows the geographical distribution of QIs by quintiles. Some QIs demonstrated regional characteristics; for example, QIs for retinopathy examinations were higher in prefectures with more population (e.g. Tokyo), whereas QIs for urine qualita- tive examination were higher in northern regions (Hokkaido and Northeast).
The proportions of antihypertensive medication users among patients with diabetes (total, by prefecture and by JDS certification) are shown in ESM Table 4; 67.1% of patients received antihypertensive medication. Scatter plots illustrat- ing the prefecture-level relationship between the proportions of antihypertensive medication use and proportions of ACE inhibitor and ARB use among patients receiving antihyperten- sive medication are shown in ESM Fig. 2, indicating a weak positive association [beta: 0.26 (95% CI: 0.02–0.50, p = 0.04)].
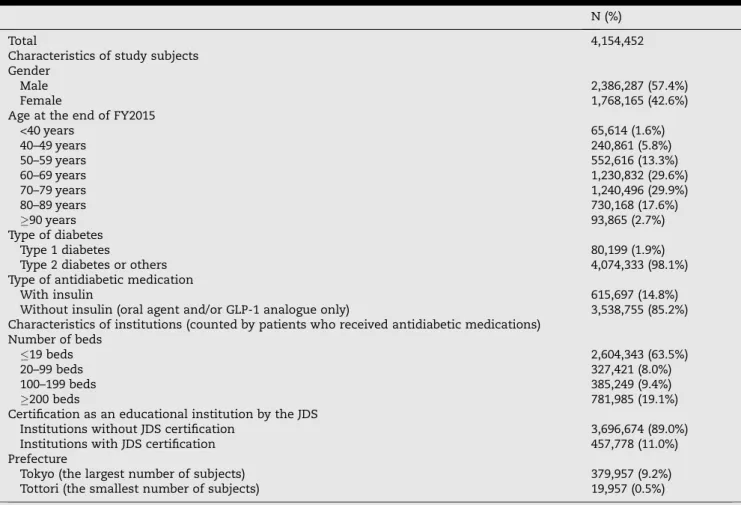
Fig. 2illustrates the distributions of institutional-level QIs by JDS certification. According to the reporting manual of the National Database, we were not allowed to show columns of less than three institutions including blank (zero) columns in the histograms; therefore, we levelled these columns with nearer columns and present the histograms as probability density. For HbA1c or GA examination, most institutions had QIs of 95%, regardless whether they were certified as an educational institution by the JDS. By contrast, for retinopathy examination, the distributions of QIs were quite distinct by JDS certification; the centres of the distributions were approximately 40% and 60% among institutions without and with JDS certification, respectively. For urinary qualitative examination, the distribution was bimodal with peaks around 10%–20% and 90%–100% among institutions without JDS certi-
4
d i a b e t e s r e s e a r c h a n d c l i n i c a l p r a c t i c e 1 5 5 ( 2 0 1 9 ) 1 0 7 7 5 0fication but had a single high peak among institutions with JDS certification. For urinary quantitative protein or albumin examination, the distribution peaked around 0%–5% among institutions without JDS certification but was almost uniform among institutions with JDS certification. Again, it must be noted that the analyses about urinary examinations were conducted only for patients treated at institutions with <200 beds; many institutions, particularly those with JDS certifica- tion, were thus excluded. For ACE inhibitor or ARB use, although both distributions had peaks around 80%–85%, the distribution among institutions with JDS certification was narrowly distributed, whereas that among institutions with- out JDS certification was widely distributed and left-skewed.
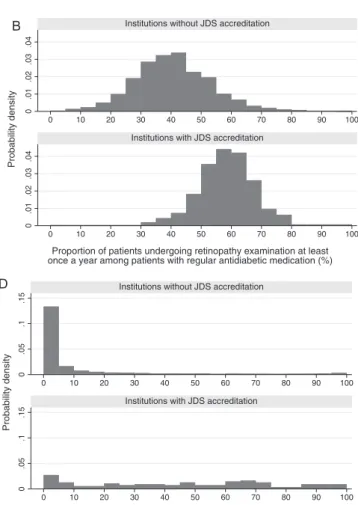
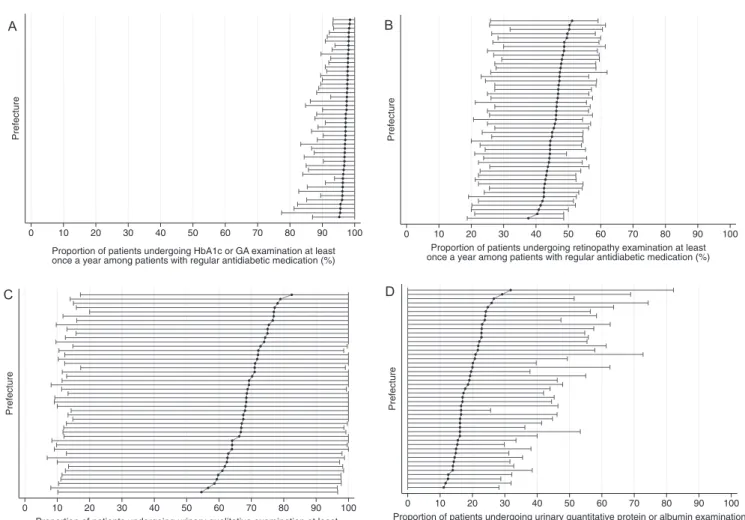
Fig. 3illustrates the distribution of institutional-level QIs by prefecture. This ‘centipede plot’ represents both overall QIs by prefecture (connected dots, sorted by the level of QI) and institutional-level distributions of the QIs by prefecture (whiskers, representing 10th and 90th percentiles among institutions within each prefecture). For HbA1c or GA exami- nation, both between-prefecture and within-prefecture differ- ences were quite small. For retinopathy examination, overall QIs by prefecture ranged between 37.5% and 51.0%, as shown in Table 2. Within-prefecture differences of retinopathy examination were larger than those of HbA1c or GA examina- tion. The figure indicates that the top 10% institutions in higher-quality prefectures had QIs of approximately 60%
(in other words, patients who were cared for at these top
10% of institutions within higher-quality prefectures received retinopathy examination at least annually with a probability of 60% or greater), whereas the bottom 10% of institutions in lower-quality prefectures had QIs of approximately20%.
For urinary qualitative examination, both between- prefecture and within-prefecture differences were quite large, i.e. 54.1%–81.9% between prefectures and from 10% to almost 100% within prefectures. For urinary quantitative protein or albumin examinations, the between-prefecture difference was large (from 10.8% to 31.6%); however, for the within- prefecture difference, 10th percentiles for all prefectures were 0%, whereas 90th percentiles were distributed broadly from
<30% to >80%. For ACE inhibitor or ARB use, the between- prefecture difference was not particularly large, namely 73.3%–80.3%, whereas the within-prefecture difference was considerable, namely 50%–60% to around 90%. Distributions of institutional-level QIs by size are provided in ESM Fig. 3.
ESM Tables 5 and 6 illustrate QIs by prefecture and institu- tional JDS certification, adjusted by covariates. Although adjustment by covariates shifted the QIs to some extent, the relative positions showed minimal change.
4. Discussion
To the best of our knowledge, this is the first to report process measures in the quality of diabetes care for outpatients (at the nation-level, by prefecture and institutional certification) as Table 1 – Characteristics of the study subjects and institutions prescribing antidiabetic medications.
N (%)
Total 4,154,452
Characteristics of study subjects Gender
Male 2,386,287 (57.4%)
Female 1,768,165 (42.6%)
Age at the end of FY2015
<40 years 65,614 (1.6%)
40–49 years 240,861 (5.8%)
50–59 years 552,616 (13.3%)
60–69 years 1,230,832 (29.6%)
70–79 years 1,240,496 (29.9%)
80–89 years 730,168 (17.6%)
90 years 93,865 (2.7%)
Type of diabetes
Type 1 diabetes 80,199 (1.9%)
Type 2 diabetes or others 4,074,333 (98.1%)
Type of antidiabetic medication
With insulin 615,697 (14.8%)
Without insulin (oral agent and/or GLP-1 analogue only) 3,538,755 (85.2%) Characteristics of institutions (counted by patients who received antidiabetic medications)
Number of beds
19 beds 2,604,343 (63.5%)
20–99 beds 327,421 (8.0%)
100–199 beds 385,249 (9.4%)
200 beds 781,985 (19.1%)
Certification as an educational institution by the JDS
Institutions without JDS certification 3,696,674 (89.0%)
Institutions with JDS certification 457,778 (11.0%)
Prefecture
Tokyo (the largest number of subjects) 379,957 (9.2%)
Tottori (the smallest number of subjects) 19,957 (0.5%)
Abbreviations: FY2015 = fiscal year 2015 (from April 2015 to March 2016), GLP-1 = glucagon-like-peptide-1, JDS = Japan Diabetes Society.
Table 2 – Quality indicators of diabetes care in Japan for FY2015.
Quality indicator Required frequency to be counted
Total By prefecture By JDS certification
Minimum Maximum Not certified Certified
(1) HbA1c or GA examination
a) At least once a year
96.7% (3,937,176/
4,069,838)
95.1% (Ishikawa) (38,338/40,296)
98.5% (Iwate) (48,926/49,692)
96.7% (3,494,966/
3,615,792)
97.4% (442,210/
454,046) b) At least twice
a year
92.6% (3,767,444/
4,069,838)
89.3% (Osaka) (233,737/261,881)
96.3% (Iwate) (47,851/49,682)
92.1% (3,329,393/
3,615,792)
96.5% (438,051/
454,046) c) At least 4
times a year
77.9% (3,171,978/
4,069,838)
68.7% (Osaka) (179,981/261,881)
88.7% (Fukushima) (68,055/76,728)
76.0% (2,749,120/
3,615,792)
93.1% (422,858/
454,046) (2) Retinopathy
examination
a) At least once a year
46.5% (1,905,561/
4,098,351)
37.5% (Fukui) (10,577/28,197)
51.0% (Okinawa) (19,047/37,379)
44.8% (1,632,474/
3,641,773)
59.8% (273,087/
456,578) b) At least once
in 2 yearsb
56.2% (1,888,342/
3,362,965)
48.1% (Fukui) (11,251/23,372)
61.9% (Okinawa) (18,709/30,234)
54.4% (1,628,308/
2,994,692)
70.6% (260,034/
368,273) (3) Urinary
qualitative examinationa
a) At least once a year
67.3% (1,598,207/
2,376,018)
54.1%
(Wakayama) (11,396/21,059)
81.9% (Okinawa) (18,215/22,252)
66.8% (1,556,906/
2,331,499)
92.8% (41,301/
44,519) b) At least twice
a year
57.6% (1,368,200/
2,376,018)
41.8%
(Wakayama) (8,806/21,059)
73.2% (Okinawa) (16,291/22,252)
57.0% (1,328,646/
2,331,499)
88.8% (39,554/
44,519)
(4) Urinary quantitative protein or albumin examinationa
a) At least once a year
19.4% (462,418/
2,380,607)
10.8%(Wakayama) (2,276/21,063)
31.6% (Hokkaido) (34,215/108,379)
18.7% (437,952/
2,335,978)
54.8% (24,466/
44,629)
b) At least twice a year
10.0% (238,636/
2,380,607)
3.7% (Tokushima) (645/17,246)
21.6% (Hokkaido) (23,423/108,379)
9.6% (224,170/
2,335,978)
32.4% (14,466/
44,629) (5) ACE inhibitor or
ARB use among patients receiving antihypertensive medication
a) At least once a year
76.9% (2,082,437/
2,708,544)
73.3% (Miyazaki) (19,534/26,665)
80.3% (Akita) (24,674/30,715)
76.2% (1,840,452/
2,414,246)
82.2% (241,985/
294,298)
Abbreviations: FY2015 = fiscal year 2015 (from April 2015 to March 2016), JDS = Japan Diabetes Society, HbA1c = glycated haemoglobin, GA = glycated albumin, ACE = angiotensin-converting enzyme, ARB = angiotensin II receptor blocker.
a At institutions with <200 beds.
bWe used data from FY2014–FY2015 (from April 2014 to March 2016).
6
diabetesresearchandclinicalpractice155(2019)1077500.05.1.15.20.05.1.15.2
0 10 20 30 40 50 60 70 80 90 100
0 10 20 30 40 50 60 70 80 90 100
Institutions without JDS accreditation
Institutions with JDS accreditation
Probability density
Proportion of patients undergoing HbA1c or GA examination at least once a year among patients with regular antidiabetic medication (%)
A
0.01.02.03.040.01.02.03.04
0 10 20 30 40 50 60 70 80 90 100
0 10 20 30 40 50 60 70 80 90 100
Institutions without JDS accreditation
Institutions with JDS accreditation
Probability density
Proportion of patients undergoing retinopathy examination at least once a year among patients with regular antidiabetic medication (%)
B
0.02.04.06.08.10.02.04.06.08.1
0 10 20 30 40 50 60 70 80 90 100
0 10 20 30 40 50 60 70 80 90 100
Institutions without JDS accreditation
Institutions with JDS accreditation
Probability density
Proportion of patients undergoing urinary qualitative examination at least once a year among patients with regular antidiabetic medication (%)
C
0.05.1.150.05.1.15
0 10 20 30 40 50 60 70 80 90 100
0 10 20 30 40 50 60 70 80 90 100
Institutions without JDS accreditation
Institutions with JDS accreditation
Probability density
Proportion of patients undergoing urinary quantitative protein or albumin examination at least once a year among patients with regular antidiabetic medication (%)
D
0.02.04.06.08.10.02.04.06.08.1
0 10 20 30 40 50 60 70 80 90 100
0 10 20 30 40 50 60 70 80 90 100
Institutions without JDS accreditation
Institutions with JDS accreditation
Probability density
Proportion of patients receiving ACE inhibitor or ARB at least once a year among patients with regular antidiabetic medication and antihypertensive medication (%)
E
Fig. 2 – Distributions of institutional-level QIs by JDS certification, shown as histograms. We excluded institutions that cared for nine or fewer patients receiving antidiabetic medication. According to the reporting manual of the National Database, we were not allowed to show the columns of less than three institutions including blank (zero) columns in the histograms; we thus leveled these columns with nearer columns and showed the histograms as probability density. a. HbA1c or GA examination (institutions without JDS certification: N of institutions = 44,122, n of patients corresponding to the
institutions = 3,563,749; institutions with JDS certification: N = 600, n = 453,989). b. Retinopathy examination (without JDS certification: N = 44,595, n = 3,588,765; with JDS certification: N = 603, n = 456,538). c. Urinary qualitative examination (at institutions with <200 beds) (without JDS certification: N = 39,103, n = 2,279,276; with JDS certification: N = 110, n = 44,472). d.
Urinary quantitative protein or albumin examination (at institutions with <200 beds) (without JDS certification: N = 39,117, n = 2,283,793; with JDS certification: N = 110, n = 44,582). e. ACE inhibitor or ARB use among patients receiving
antihypertensive medication (without JDS certification: N = 38,250, n = 2,372,935; with JDS certification: N = 565, n = 284,093).
Prefecture
0 10 20 30 40 50 60 70 80 90 100
Proportion of patients undergoing HbA1c or GA examination at least once a year among patients with regular antidiabetic medication (%)
A
Prefecture
0 10 20 30 40 50 60 70 80 90 100
Proportion of patients undergoing retinopathy examination at least once a year among patients with regular antidiabetic medication (%)
Prefecture
0 10 20 30 40 50 60 70 80 90 100
Proportion of patients undergoing urinary qualitative examination at least once a year among patients with regular antidiabetic medication (%)
Prefecture
0 10 20 30 40 50 60 70 80 90 100
Proportion of patients undergoing urinary quantitative protein or albumin examination at least once a year among patients with regular antidiabetic medication (%)
Prefecture
0 10 20 30 40 50 60 70 80 90 100
Proportion of patients receiving ACE inhibitor or ARB at least once a year among patients with regular antidiabetic medication and antihypertensive medication (%)
B
C D
E
Fig. 3 – Distributions of institutional-level QIs by prefecture, shown as centipede plots. Overall QIs by prefectures are shown as connected dots, sorted by the level of QIs, whereas institutional-level distributions of QIs by prefectures are shown as whiskers, representing the 10th and 90th percentiles. We excluded institutions that cared for nine or fewer patients receiving antidiabetic medication when calculating institutional-level QIs. a. HbA1c or GA examination (total n of patients for calculating overall QIs = 4,069,838; N of institutions = 44,722, n of patients corresponding to the institutions = 4,017,738). b.
Retinopathy examination (total n = 4,098,351; N = 45,198, n = 4,045,303). c. Urinary qualitative examination (at institutions with < 200 beds) (total n = 2,376,018; N = 39,213, n = 2,323,748). d. Urinary quantitative protein or albumin examination (at institutions with < 200 beds) (total n = 2,380,607; N = 39,227, n = 2,328,375). e. ACE inhibitor or ARB use among patients receiving antihypertensive medication (total n = 2,708,544; N = 38,815, n = 2,657,028).
8
d i a b e t e s r e s e a r c h a n d c l i n i c a l p r a c t i c e 1 5 5 ( 2 0 1 9 ) 1 0 7 7 5 0averages and institutional-level distributions using exclusive nationwide claims data in Japan. The present study highlights that some key quality measures of diabetes care were subop- timal and varied greatly by prefecture and institutional char- acteristics (in favour of JDS-certified institutions), whereas other QIs, such as that for glycaemic control examination, were comparable to or higher than those in other countries.
Notably, retinopathy examination was conducted annually for <50% of patients receiving antidiabetic medication and biennially for <60% of them. Urinary qualitative examination was conducted at institutions with <200 beds for approxi- mately two-thirds of patients receiving antidiabetic medica- tion, and the disparity by prefecture or JDS certification was substantial. Urinary quantitative protein or albumin exami- nation was rarely conducted for patients receiving antidia- betic medication at institutions with <200 beds without JDS certification. In contrast, HbA1c or GA examinations were conducted in most patients cared at most institutions. The QI about ACE inhibitor or ARB use among patients receiving antihypertensive medication was also favourable.
In Japan, a few studies have assessed the quality of dia- betes care using claims data. Tomio et al. [18]reported QIs for eye examinations and nephropathy screening using National Health Insurance (a type of health insurance for self-employed and unemployed citizens under 75 years old, run by municipalities) data from one prefecture. Others[19–
21]estimated QIs using the Japan Medical Data Center (JMDC) Database, which consists of claims data from employment- based insurance, and investigated the predictive factors[27].
The QIs estimated in these previous studies were generally lower than those obtained in the present study; the reasons may include secular changes and differences in the source population (e.g. insurance type, age, and gender distribution).
In the US and European countries, QIs about retinopathy and nephropathy screening were higher than those measured in the present study[11–15]. This may be because pay-for- performance or accreditation systems are more prevalent in those countries than in Japan. Moreover, urinary quantitative examinations are reimbursed only once in 3 months, which may preclude physicians in Japan from ordering these exam- inations. Regardless of the cause, we should make more efforts to increase these QIs in Japan. On the other hand, the QI about glycaemic control examinations in the present study was better than that in studies from the US [12,13]
and comparable to studies from European countries[14]; we consider that the titration of glycaemic control based on HbA1c or GA levels works better in Japan thanks to well- established laboratory systems and/or frequent visits of out- patients[17].
Our findings offer several policy implications directly applicable to the source population in Japan. Healthcare pro- viders, particularly physicians, who care for patients with dia- betes need to be informed of the results of the present study and strive to improve the quality of diabetes care. Notably, the bimodal distribution of urinary qualitative examinations in institutions without JDS certification indicate that many physicians may not recognise the importance of such exami- nations for patients with diabetes. In addition to individual healthcare providers’ efforts, systematic assistants may be warranted; for example, electronic health records equipped
with a periodic reminder for necessary tests may be useful to increase the frequency of recommended examinations.
The institutional-level QIs for retinopathy examination rarely exceeded 80%; considering that some hospitals/clinics sys- tematically encourage patients to go to ophthalmologists, it may indicate that some patients do not go to ophthalmolo- gists even when referred by their physician. Education of patients with diabetes and their families about retinopathy screening may increase adherence. In addition, incentivisa- tion through a reimbursement system may be worth consid- ering, although the validity of quality measures should be confirmed and widely recognised before application for reim- bursement system. The histograms and centipede plots shown in the present study could be particularly useful when thresholds of QIs for some kinds of incentivisation are dis- cussed; for example, the QIs achieved in most JDS-certified institutions could serve as tentative goals for other institu- tions in the next step.
The present study also has several implications to health- care policy in other countries. First, it demonstrated that nationwide claims data can be used as a source of QIs for medical care, particularly in terms of process measures. A single claims/reimbursement system, legislation about sec- ondary use of claims data and effort by the MHLW enabled the NDB despite the high number (>3,000) of insurers in Japan.
To establish a health insurance claims data system for effec- tive research, a uniform healthcare claims/reimbursement system and corresponding legislation about secondary data use are important. Furthermore, the NDB has health check- up information that can be linked to individuals, although the proportion of linkage has been previously reported to be low[28], and the participation rate of health check-up is about half[29]. If both the proportion of linkage and participation rate of health check-up increase, we might be able to calcu- late outcome measures (e.g. glycaemic control in patients with diabetes) using the NDB. Moreover, if researchers or pol- icymakers use a consistent method to calculate QIs, more valid international comparison may be possible, which could encourage countries with poorer indicators to improve qual- ity of care. Although not all QIs are available from claims data, understanding the characteristics (e.g. strong and weak areas) of claims data may enable policymakers to plan future data collection about current health services. Before findings such as these can motivate policy changes, the reliability of the data and QI measures must be confirmed. Nevertheless, we hope that the findings of this study promote important dis- cussion of how to improve healthcare for patients with diabetes.
Several limitations should be considered when interpret- ing the findings of this study. First, some important informa- tion was not obtainable due to the observational design using secondary data. For example, it was not possible to precisely identify patients with diabetes not receiving antidiabetic medication. Since QIs for patients with diabetes not receiving medication were reported to be lower than those receiving medication[19], QIs among patients with diabetes in general would have been lower. QIs for urinary examinations in larger institutions could not be measured due to comprehensive payment system. Second, capturing past medical history from claims data was difficult, and therefore, adjustment by
standard marginalisation may not have been perfect. Third, no register of beneficiaries was offered in the NDB; we could not identify whether a beneficiary stayed within an insurer throughout a certain period unless the beneficiary received medical care every month, which particularly mattered when we constructed the denominators of the proportions. Instead, we determined the patients with regular antidiabetic medica- tion (at least every 3 months) to construct denominators.
Fourth, as we only used ID1 to link beneficiaries, we could not link individuals who changed their insurance during the study period. However, this limitation may not have biased the findings of our study because the dropout rate is not overly large (presumably approximately 10%), and there is no reason to believe that the QIs of patients who changed their health insurance differed from those who remained with one insurer during the study period. Fifth, we did not include outcome quality measures of diabetes care which was difficult to extract from the current NDB. A recent ran- domised controlled trial conducted in Japan [30] showed lower incidences of complications even among controls than in the previous study[31], which implied the improved quality of care, particularly in larger JDS-certified hospitals, whereas outcome QIs were not comprehensively measured in Japan.
Future effort should be made to overview the outcome aspects of diabetes care. Although process QIs alone may not necessarily lead to the improvement of outcomes [32], the process measured as QIs in the present study is a well- accepted approach that should be applied to eligible patients.
Monitoring the changes in the outcomes that are linked with these process QIs will be required, but until proven otherwise, we believe that ensuring the delivery of established standard care is the providers’ responsibility.
In conclusion, some key quality measures of diabetes care remain suboptimal and vary greatly across institutions in Japan despite universal health coverage, whereas other mea- sures including glycaemic control examinations were better than or comparable to other developed countries. Therefore, individual and systematic efforts, as well as official measur- ing of QIs followed by careful discussion about pay-for- performance system, are warranted. Claims data from univer- sal health insurance system can be useful for measuring national-level quality of diabetes care and comparing them by region and institutional characteristics.
Acknowledgements
We appreciate helpful comments from the members of the research team: Dr. Naoki Kashihara (Kawasaki Medical University, Japan), Dr. Issei Komuro (the University of Tokyo, Japan), Dr. Yuichiro Ogura (Nagoya City University, Japan), Dr. Hirokazu Okada (Saitama Medical University, Japan), Dr.
Koichi Node (Saga University, Japan), Dr. Toshinori Murata (Shinshu University, Japan), Dr. Naoki Nakashima (Kyushu University, Japan), Dr. Tooru Kikuchi (Saitama Medical Univer- sity, Japan), Dr. Naoko Tajima (Jikei University, Japan), Dr.
Masaomi Nangaku (the University of Tokyo, Japan), Dr.
Hidemi Takimoto (National Institutes of Biomedical Innova- tion, Health and Nutrition, Japan), Dr. Hiroshi Akazawa (the University of Tokyo, Japan), Dr. Ryo Kawasaki (Osaka Univer-
sity, Japan), Dr. Takumi Hirata (Tohoku University, Japan), Dr. Daisuke Sugiyama (Keio University, Japan), Dr. Atsushi Tanaka (Saga University, Japan), Dr. Shun Kosaka (Keio University, Japan), Dr. Tetsuhiro Tanaka (the University of Tokyo, Japan) and Dr. Shinji Kume (Shiga University, Japan).
We also thank Dr. Yasuki Kobayashi (the University of Tokyo, Japan), Dr. Mitsuhiko Noda (Saitama Medical University, Japan), Dr. Yasuyuki Okumura (Tokyo Metropolitan Institute of Medical Science, Japan) and Ms. Tomone Watanabe (National Cancer Center, Japan) for their helpful comments, Dr. Koichi B. Ishikawa (International University of Health and Welfare, Japan) for providing the variable lists, and Ms.
Kayuri Auld-Fujiwara (National Center for Global Health and Medicine, Japan) and Ms. Moe Nakanishi (National Center for Global Health and Medicine, Japan) for their data- collecting contribution. We would like to thank Enago (www.
enago.jp) for the English language review.
The data that support the findings of this study (an extract from the NDB) are available from the Ministry of Health, Labour, and Welfare, but restrictions apply to the availability of these data, which were used under license for the current study, and so are not publicly available. Please contact T.Su ([email protected]) if further clarification is needed.
Funding
This study was supported by Health and Labour Sciences Research Grants (Comprehensive Research on Life-Style Related Diseases including Cardiovascular Diseases and Dia- betes Mellitus, H29-Cardiovascular-General-004, PI: Dr. Taka- shi Kadowaki). The funding agency had no role in the design or conduct of the study; collection, management, anal- ysis, and interpretation of data; preparation, review or approval of the manuscript; and the decision to submit the manuscript for publication.
A part of the present study was presented orally at the 61st Annual Meeting of the Japan Diabetes Society on May 24th, 2018 (Tokyo, Japan).
T.Su., K.I., N,S,-I, T.Sa, T.Y., M.O., and T.K. designed the study. T.Su. and K.I. acquired data. T.Su. and N.S.-I. analysed data. T.Su., K.I., N.S.-I, H.T., A.S.-Y., T.Sa., T.H., T.O., T.Y., K.U., M.O., and T.K. interpreted data. T.Su. drafted the manuscript.
K.I., N.S.-I, H.T., A.S.-Y., T.Sa., T.H., T.O., T.Y., K.U., M.O., and T.
K. critically revised the draft.
T. Su., M.O., and T.K. are the guarantors of this work, and, as such, had full access to all the data in the study and takes responsibility for the integrity of the data and the accuracy of the data analysis. The authors complied with the RECORD statement (ESM Table 7).
Declarations of Competing Interest
None.
Appendix A. Supplementary material
Supplementary data to this article can be found online at https://doi.org/10.1016/j.diabres.2019.05.029.
10
d i a b e t e s r e s e a r c h a n d c l i n i c a l p r a c t i c e 1 5 5 ( 2 0 1 9 ) 1 0 7 7 5 0R E F E R E N C E S
[1] International diabetes federation. IDF diabetes atlas. 8th ed, https://www.idf.org/component/attachments/attachments.
html?id=1405&task=download; 2017 [accessed 26 April 2019].
[2]Yau JWY, Rogers SL, Kawasaki R, Lamoureux EL, Kowalski JW, Bek T, et al. Global prevalence and major risk factors of diabetic retinopathy. Diabetes Care 2012;35:556.
[3] United States Renal Data System. Chapter 11: International Comparisons. Am J Kidney Dis. 2018;71:S461-S500.
[4] American diabetes association. 6. Glycemic targets:
standards of medical care in diabetes—2018. Diabetes Care.
2018;41:S55.
[5]Haneda M, Noda M, Origasa H, Noto H, Yabe D, Fujita Y, et al.
Japanese clinical practice guideline for diabetes 2016.
Diabetol Int 2018;9:1–45.
[6]International Diabetes Federation Guideline Development Group. Global guideline for type 2 diabetes. Diabetes Res Clin Pract 2014;104:1–52.
[7] The Japan diabetes society. Treatment guide for diabetes 2016-2017. Tokyo: Bunkyodo;http://www.fa.kyorin.co.jp/jds/
uploads/Treatment_Guide_for_Diabetes_2016-2017.pdf; 2016 [accessed 26 April 2019].
[8]Palmer SC, Mavridis D, Navarese E, Craig JC, Tonelli M, Salanti G, et al. Comparative efficacy and safety of blood pressure- lowering agents in adults with diabetes and kidney disease: a network meta-analysis. Lancet 2015;385:2047–56.
[9] National committee for quality assurance. HEDIS &
performance measurement,https://www.ncqa.org/HEDIS/;
2018 [accessed 26 April 2019].
[10] National institute for health and care excellence. NICE quality and outcomes framework indicator,https://www.
nice.org.uk/standards-and-indicators/qofindicators; 2018 [accessed 26 April 2019].
[11]Ali MK, Bullard KM, Saaddine JB, Cowie CC, Imperatore G, Gregg EW. Achievement of goals in U.S. diabetes care, 1999- 2010. N Engl J Med 2013;368:1613–24.
[12]Rivera-Hernandez M, Leyva B, Keohane LM, Trivedi AN.
Quality of care for white and hispanic medicare advantage enrollees in the United States and Puerto Rico. JAMA Intern Med 2016;176:787–94.
[13]Levine DM, Linder JA, Landon BE. The quality of outpatient care delivered to adults in the united states, 2002 to 2013.
JAMA Intern Med 2016;176:1778–90.
[14]Stone M, Charpentier G, Doggen K, Kuss O, Lindblad U, Kellner C, et al. Quality of care of people with type 2 diabetes in eight European countries: Findings from the guideline adherence to enhance care (GUIDANCE) study. Diabetes Care 2013;36:2628–38.
[15]Calvert M, Shankar A, McManus RJ, Lester H, Freemantle N.
Effect of the quality and outcomes framework on diabetes care in the United Kingdom: retrospective cohort study. BMJ 2009;338. b1870.
[16]Arday DR, Fleming BB, Keller DK, Pendergrass PW, Vaughn RJ, Turpin JM, et al. Variation in diabetes care among states - do patient characteristics matter? Diabetes Care 2002;25:2230–7.
[17]Ikegami N, Yoo B-K, Hashimoto H, Matsumoto M, Ogata H, Babazono A, et al. Japanese universal health coverage:
evolution, achievements, and challenges. Lancet 2011;378:1106–15.
[18] Tomio J, Toyokawa S, Tanihara S, Inoue K, Kobayashi Y.
Quality of care for diabetes patients using National Health Insurance claims data in Japan. J Eval Clin Pract
2010;16:1164–9.
[19] Tanaka H, Tomio J, Sugiyama T, Kobayashi Y. Process quality of diabetes care under favorable access to healthcare: a 2- year longitudinal study using claims data in Japan. BMJ Open Diabetes Res Care 2016;4. e000291.
[20] Kawamura T, Sato I, Tamura H, Nakao YM, Kawakami K.
Influence of comorbidities on the implementation of the fundus examination in patients with newly diagnosed type 2 diabetes. Jpn J Ophthalmol 2018;62:68–76.
[21] Tanaka H, Sugiyama T, Ihana-Sugiyama N, Ueki K, Kobayashi Y, Ohsugi M. Changes in the quality of diabetes care in Japan between 2007 and 2015: A repeated cross-sectional study using claims data. Diabetes Res Clin Pract 2019;149:188–99.
[22] Ministry of health, labour, and welfare. Website regarding national database of health insurance claims and specific health checkups of Japan,https://www.mhlw.go.jp/
stf/seisakunitsuite/bunya/kenkou_iryou/iryouhoken/
reseputo/index.html; 2018 [accessed 26 April 2019].
[23] Ministry of health, labour and welfare. Situation regarding digitization of health insurance claims,https://www.mhlw.
go.jp/file/06-Seisakujouhou-12400000-Hokenkyoku/
0000099002.pdf; 2015 [accessed 26 April 2019].
[24] Okumura Y, Sakata N, Shimizu S, Matsui H. Academia user’s guide to the national database of health insurance claims and specific health checkups of Japan: Pitfalls. Monthly IHEP 2017;268:16–25.
[25] Shimizu S. Publication of all-Japan health insurance-covered medical facilities (hospitals and clinics), pharmacies, and correspondence table between postal code and secondary medical area (FY 2016). Monthly IHEP 2017;263:18–21.
[26] Japan diabetes society. Certified educational institution search; 2018
[27] Kimura S, Sato T, Ikeda S, Noda M, Nakayama T. Development of a database of health insurance claims: standardization of disease classifications and anonymous record linkage. J Epidemiol 2010;20:413–9.
[28] Okamoto E. Linkage rate between data from health checks and health insurance claims in the Japan National Database.
J Epidemiol 2014;24:77–83.
[29] Ministry of health, labour and welfare. Implementation of specific health checkups and specific health guidance in 2015,https://www.mhlw.go.jp/file/04-Houdouhappyou- 12401000-Hokenkyoku-Soumuka/0000173093.pdf; 2017 [accessed 26 April 2019].
[30] Ueki K, Sasako T, Okazaki Y, Kato M, Okahata S, Katsuyama H, et al. Effect of an intensified multifactorial intervention on cardiovascular outcomes and mortality in type 2 diabetes (J- DOIT3): an open-label, randomised controlled trial. Lancet Diabetes Endocrinol 2017;5:951–64.
[31] Sone H, Tanaka S, Tanaka S, Iimuro S, Oida K, Yamasaki Y, et al. Serum level of triglycerides is a potent risk factor comparable to LDL cholesterol for coronary heart disease in Japanese patients with type 2 diabetes: subanalysis of the Japan Diabetes Complications Study (JDCS). J Clin Endocrinol Metab 2011;96:3448–56.
[32] O’Connor PJ, Bodkin NL, Fradkin J, Glasgow RE, Greenfield S, Gregg E, et al. Diabetes performance measures: current status and future directions. Diabetes Care 2011;34:1651–9.