Simulation of 3‑Staged MPC Using Custom Characteristics of Magnetic Cores
journal or
publication title
IEEE Transactions on Dielectrics and Electrical Insulation
volume 14
number 4
page range 1025‑1032
year 2007‑08
URL http://hdl.handle.net/2298/9552
1070-9878/07/$25.00 © 2007 IEEE
Simulation of 3-Staged MPC Using Custom Characteristics of Magnetic Cores
Jaegu Choi, Takao Namihira, Takashi Sakugawa, Sunao Katsuki and Hidenori Akiyama
Kumamoto University.
Kurokami 2-39-1
Kumamoto, Kumamoto 860-8555, Japan
ABSTRACT
A low inductance circuit has been fabricated in order to obtain shorter time to saturation during core unsaturation and current pulses with shorter widths during core saturation. B-H curves have been derived from the measured voltage and current waveforms. Characteristics of the magnetic core for pulsed-power generators have been investigated and the Electromagnetic Transient Program (EMTP) simulation has been carried out in order to determine the effects of leakage current on the energy efficiency of a 3-staged magnetic pulse compressor (MPC). As results, the derived B-H curves show the following characteristics: a high ratio of unsaturated to saturated permeability (µ
un/µ
sat), a maximum flux swing of about 2.55 T, a high ratio of remanent flux density to saturation magnetic flux density (B
r/B
s) and low core loss. And, it is found that µ
unincreases with time to saturation and that µ
satis strongly influenced by the stray inductances of the core. By applying custom characteristics to each stage in EMTP simulation, more practical energy transfer in MPC is obtained.
Index Terms — B-H curve, leakage current, magnetic core, MPC, EMTP.
1 INTRODUCTION
RECENT developments in ferromagnetic materials [1], [2] and semiconductor switches have allowed high repetitive operation of magnetic switches (MS) [3-7] with very low losses, and have made it possible to use repetitive pulsed power generated by magnetic pulse compressors (MPC) in practical industrial applications such as laser exciters, decomposition of hazardous gases, removal of volatile toxic compounds and water treatment [8-15]. The magnetic switch used in pulsed-power applications is superior in its high repetition rate, high stability, and long lifetime to electrical discharge switches that have unstable switching and short lifetimes due to electrode deterioration.
The saturable inductor (SI) works as a switch by blocking current with a high inductance during the unsaturated state and passing current with a low inductance during the saturated state. Eligible magnetic materials for repetitive pulsed-power applications must have the following characteristics: a high ratio of unsaturated to saturated permeability (µ
un/µ
sat), a high flux swing, a high saturation flux density (B
s) and remnant flux density (B
r), and low core loss.
The dc and ac characteristics of magnetic materials have been well known and easy to obtain from manufacturers.
As the use of magnetic cores has become popular in pulsed- power applications, there have been several studies of the pulse magnetic characteristics that are critical for a multi-
stage MPC [16-20]. However, there are still some necessities for the users of the magnetic cores to measure the pulse characteristics for more efficient MPC design. As the number of stages in an MPC increases, the efficiency of the energy transfer that is one of the dominant measures for overall performance becomes poor.
In this paper, a low inductance circuit fabricated to obtain shorter time to saturation during core unsaturation and current pulses with shorter pulse widths during core saturation is described. Also, the characteristics of the magnetic core for pulsed-power applications are described using the B-H curves derived from the measured voltage and current waveforms. Finally the Electromagnetic Transient Program (EMTP) simulation is carried out in order to determine the effects of leakage current on the energy efficiency of a typical 3-staged MPC.
2 EXPERIMENTAL SETUP AND PROCEDURES
Figure 1 describes the schematic diagram of the low inductance circuit for measuring dynamic properties of the magnetic core. The discharge circuit has a coaxial geometry to reduce the stray inductance of the circuit. The total inductance around the main current loop during saturation of the core has been calculated to be as low as about 85 nH using equation (3). A reset circuit is used to obtain a maximum flux swing. The magnetic core used in this study is a FINEMET core (FT-1H, Hitachi Metal Corp., Japan),
Manuscript received on 29 September 2006, in final form 20 December 2006.
Figure 1. Schematic diagram of the low-inductance circuit for measuring
dynamic properties of the magnetic core.
Figure 2. Derivation method for B-H curves from the measured voltage and current waveforms.
which has a 60 mm inner diameter, 130 mm outer diameter and is 25.4mm in height.
In Figure 1, a dc voltage source (E) is used to charge a capacitor (C) through a high resistance (R). On closure of the triggered spark gap switch (SGS), the SI begins to saturate after time to saturation, τ 1 . The applied voltage across the SI, v
SIand the discharge current, i
SIhave been measured using a voltage divider (EP-50K, Pulse Electronic Engineering Co., Japan) and a current monitor (Model 110A, Pearson Electronics, USA), respectively. An oscilloscope (TDS3054B, 500 MHz, Tektronix) recorded the single-shot signals from the measurement devices.
Figure 2 illustrates the derivation method for the B-H curves from the measured voltage and current waveforms.
The flux density, B, is obtained from [6]:
e SI
A N
dt B v
= ∫ ⋅ (1) where N is the number of winding turns and A
eis the effective cross-section area that is the actual area of the magnetic material in the core excluding the area of the inter-laminar insulation.
core C (nF) E (kV) τ
1(ns) τ
2(ns) (nH)
sat5 20.0 108 65 86 Case 1
25 9.0 187 145 85 Case 2
1
100 4.5 365 395 150 Case 3
5 20.0 203 65 86 Case 4
25 9.0 400 145 85 Case 5
2
100 4.5 755 395 150 Case 6
The magnetic field, H, is given by:
e SI
l N H i ⋅
= (2)
where l
eis average magnetic path length.
Time to saturation, τ
1, and current pulse width τ
2can be used in deriving several physical quantities. However, it is very difficult to exactly determine the boundary line of the two terms in Figure 2 because the current pulse at earlier times is distorted by the saturation of the core.
Therefore, τ
1and τ
2are determined by the following iterative procedure in this study. First, the current pulse width, τ 2 , is roughly determined from the measured current waveform. τ
1is then calculated from the voltage and current waveforms. In order to verify these values, the circuit inductance at SI saturation L
satis obtained from:
L
satC
2 2
/ ) ( τ π
= (3) and the voltage at τ 1 is obtained from [17]:
C I L
v = max ⋅ sat
τ
1(4) where I
maxand C are the maximum current value and capacitance, respectively. τ
1can then be determined in accordance with v τ
1from the voltage waveform. Finally, this τ
1is compared with the roughly determined one. If there is a significant difference between them, a new value of τ
2is taken. The procedure is repeated until the values are equal to each other. The results are shown in Table I with the experimental parameters. L
satof 100 nF is larger than those of others because of the different geometry of the capacitor. The reset current was chosen as 0.5 A or 1.0 A in order to get a more coercive force than the 0.6 A/m that is recommended by the manufacturer. The frequency of the current pulse during saturation can be determined from:
2
21
= τ
f
sat(5)
3 R ESULTS AND D ISCUSSION 3.1 DERIVATION OF B-H CURVES
Figure 3 shows the typical voltage and current waveforms (top) and derived B-H curves (bottom) for the case of one single core and reset current of 1.0 A. In the voltage and current waveforms, on closure of the triggered SGS at 0 ns, most of the charge voltage is applied across the SI. It is observed that the leakage current increases as time increases and that τ
1increases with decreasing voltage because the product of voltage and time is constant. After τ
1, the SI reaches saturation and operates as a closing magnetic switch.
The trend of the maximum current can be explained by equation (4).
The B-H curves are derived from the measured voltage and current waveforms using equations (1) and (2). From the hysteresis loops, it is can be seen that ① the ratio of unsaturated to saturated permeability (µ
un/µ
sat) is very large, which means very good switching performance, ② the maximum flux swing over 2.5 T is obtained by applying a reset current greater than a current value corresponding to the coercive force H
cof the magnetic core, which means that this core can contribute to the compact pulsed-power generators, ③ the ratio of remnant flux density to saturation magnetic flux density (B
r/B
s) is close to 1, which means good switching performance and ④ low core loss is
expected from the narrow area of the hysteresis loop, which means that repetitive operation is possible.
Dependence of unsaturated relative permeability (µ
ru) on time to saturation ( τ
1) is shown in Figure 4. It can be seen that µ
ruincreases with τ
1for a fixed product of voltage and time. This is because µ
ruincreases with decreasing dB/dt, that is, decreasing voltage [16]. From these results, it is considered that the last stage in MPC will show worse switching performance because it has a shorter τ
1and a larger leakage current. Also, it is observed that the permeability of two cores is higher than that of one core due to the fact that dB/dt has been halved by keeping the voltage constant while doubling the number of cores. It is thought that the switching performance of the magnetic core in MPC can be improved as the number of cores increases for the same voltage at the cost of other factors.
Dependence of saturated relative permeability (µ
rs) on frequency is described in Figure 5. It can be seen that µ
rsis almost independent of frequency for a fixed charge energy because the magnetic core behaves as an air core during the saturated state. Also, it is observed that the permeability of two cores is lower than that of one single core. This is because L
satis constant in the saturated state while the core cross section area has doubled. In fact, µ
rsdoes not indicate the relative permeability of the magnetic core but rather the stray inductance of the core holder divided by the cross section area. Also, it is observed that µ
rsdoes not decrease to 1 due to the stray inductance of the core holder. The stray (a) (b) (c)
Figure 3. Typical voltage and current waveforms (top) and derived B-H curves (bottom) in case of 1 core, (a) capacitance of 5 nF and voltage of 20 kV, (b) capacitance of 25 nF and voltage of 9 kV and (c) capacitance of 100 nF and voltage of 4.5 kV.
- 0. 5 0 0. 5 1 1. 5 2 2. 5 3
- 2000 0 2000 4000 6000 8000
B ( T)
H ( A/ m)
- 5 0 5 10 15 20
- 1000 0 1000 2000 3000 4000
- 250 0 250 500 750
Vol t age ( kV) Cur r ent ( A)
Ti me ( ns)
- 5 0 5 10 15 20
- 1000 0 1000 2000 3000 4000
- 250 0 250 500 750
Vol t age ( kV) Cur r ent ( A)
Ti me ( ns)
- 0. 5 0 0. 5 1 1. 5 2 2. 5 3
- 2000 0 2000 4000 6000 8000
B ( T)
H ( A/ m) - 0. 5
0 0. 5 1 1. 5 2 2. 5 3
- 2000 0 2000 4000 6000 8000
B ( T)
H ( A/ m) - 5
0 5 10 15 20
- 1000 0 1000 2000 3000 4000
- 250 0 250 500 750
Vol t age ( kV) Cur r ent ( A)
Ti me ( ns)
0 2500 5000 7500 10000
0 200 400 600 800 1000
1cor e _ 1J 2cor es_ 1J
Ti me t o sat ur at i on, τ
1( ns)
Figure 4. Dependence of unsaturated relative permeability (µ
ru) on time to saturation.
0 2 4 6 8 10 12
0 2 4 6 8
y
1cor e _ 1J 2cor es_ 1J
Fr equency ( MHz)
Figure 5. Dependence of saturated relative permeability (µ
rs) on frequency.
inductance calculated from the geometry of the core holder can be determined from [7]:
a b h
L holder N ln
2
2
0 π
μ ⋅
= (6)
and is about 20 nH where h, a, and b are the height, the outer radius, and the inner radius of the core holder, respectively.
The saturated inductance calculated from µ
rsin Figure 6 using the relation [17]:
e rs e
sat l
A
L N ⋅
= μ 0 μ 2 (7)
is also about 20 nH. These same results indicate that the stray inductance of the core holder directly influences the slope of the B-H curve in the saturated state and that the inherent µ
rsof the magnetic core is nearly unity. From these
Figure 6. Schematic diagram of the simulation circuit for a typical 3-stage MPC.
- 0. 5 0 0. 5 1 1. 5 2 2. 5 3
- 1000 0 1000 2000 3000 4000 5000 6000 7000 SI
0_MPC1 SI
1_MPC1 SI
2_MPC1 SI
3_MPC1 SI s_MPC2
H ( A/ m)
Figure 7. B-H curves for the magnetic cores of MPC1 and MPC2.
results, it is evident that the maximum current and effective energy transfer in the saturated state of a real MPC circuit strongly depend on the stray inductances of the circuit.
3.2 EMTP SIMULATION WITH CUSTOM AND IDENTICAL B-H CURVES FOR EACH MPC STAGE
In this study, EMTP [21, 22] has been used to carry out the comparison studies between an MPC (MPC 1 hereafter) with custom B-H curves and the other MPC (MPC 2 hereafter) with identical B-H curves for each MPC stage.
The B-H curves of the different permeability characteristics derived in the last section and a B-H curve reported by the manufacturer in [2] have been utilized for the magnetic cores of MPC 1 and MPC 2, respectively.
Figure 6 shows the schematic diagram of the EMTP
simulation circuit for a typical 3-staged MPC. The
simulation circuit has a foremost stage for pulse generation
and three subsequent stages for pulse compression, and
consists of capacitors (C
0, C
1, C
2and C
3), saturable
inductors (SI
0, SI
1, SI
2and SI
3), stray inductances (SL
0, SL
1,
SL
2and SL
3), a switch (SW), a pulse transformer (PT) and
a matched load. The capacitances of C
0, C
1, C
2and C
3are
2.3 µF, 16 nF, 16 nF, and 16 nF, respectively. The charge
voltage on C
0is 2.6 kV. Stray inductances used for each
stage are shown in Table 2. These values are based on a
real MPC [23]. PT has a function of an ideal step-up
transformer with the voltage gain of 12. A 2.3 Ω resistor is
used as the matched load.
Table 2. Stray inductances used in the EMTP simulation circuit.
SL
0SL
1SL
2SL
30.847 µH 0.6 µH 0.276 µH 0.06 µH
Table 3. Calculated Inductances of the magnetic cores of MPC 1.
SI
0SI
1SI
2SI
3Lu 0.125 mH 15.0 mH 0.143 mH 0.015 mH Ls 0.024 µH 1.34 µH 0.065 µH 0.011 µH
Lu/Ls 5200 11200 2200 1360
Table 4. Calculated Inductances of the magnetic cores of MPC 2
SI
0SI
1SI
2SI
3Lu 0.105 mH 5.98 mH 0.292 mH 0.047 mH Ls 0.024 µH 1.34 µH 0.065 µH 0.011 µH
Lu/Ls 4370 4460 4490 4270
Table 5. Calculated current pulse widths on each stage of MPC 1
Stage 0 Stage 1 Stage 2 Stage 3
PW (ns) 3140 391 164 75
Figure 7 shows the custom B-H curves for SI
0, SI
1, SI
2and SI
3of MPC 1, and the identical B-H curve for SI
0, SI
1, SI
2and SI
3of MPC 2, respectively. The custom B-H curves for SI
0, SI
1, SI
2and SI
3of MPC 1 were derived from Case 3, Case 6, Case 2 and Case 1 in Table 1, respectively. All the curves show different slopes (that is, µ
ru) during the unsaturated state due to the leakage current characteristics of the magnetic core, and same slopes (that is, µ
rs) during the saturated state due to the transition of the core from the magnetic material to the air.
Figure 8 shows the flux and current relationships for SI
0s, SI
1s, SI
2s and SI
3s of MPC 1 and MPC 2, respectively. The curves were derived from the B–H curves shown in Figure 7 using the following relationships:
A e
B N ⋅ ⋅
=
Φ (8) and
N l H
I = ⋅ e / (9) where Φ is flux [Wb·T], I is current [A]. The numbers of winding turns for SI
0, SI
1, SI
2and SI
3of MPC 1 and MPC 2 are 3, 16, 4 and 2 respectively, and the numbers of cores for SI
0, SI
1, SI
2and SI
3are 1, 2, 1 and 1, respectively.
From the derived flux-current curves, it is possible to calculate the unsaturated and the saturated inductances of the magnetic switches. The results are shown in Table 3 and 4.
The ratios of the unsaturated to the saturated inductance (Lu/Ls) for SI
0, SI
1, SI
2and SI
3of MPC 1 are 5300, 11200,
- 0. 01 0 0. 01 0. 02 0. 03 0. 04 0. 05 0. 06 0. 07
0 200 400 600 800 1000
SI
0_MPC1 SI
1_MPC1 SI
2_MPC1 SI
3_MPC1 SI
0_MPC2 SI
1_MPC2 SI
2_MPC2 SI
3_MPC2
I ( A)
Figure 8. Φ-I curves for the magnetic cores of MPC1 and MPC2.
2200 and 1360, respectively, whereas the ratios of the unsaturated to the saturated inductance for SI
0, SI
1, SI
2and SI
3of MPC 2 are consistently about 4400. It can be expected that the overall performance of MPC 1 decreases as the number of stages increases, whereas that of MPC 2 remains unchanged. Also, it should be noted that this big difference in the ratios plays an important role as a switch in the MPC circuit.
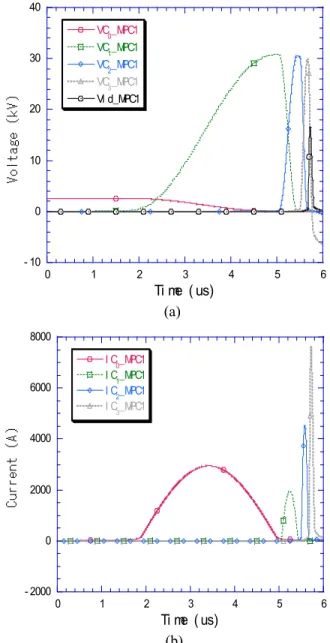
Figure 9 shows the typical voltage and current waveforms on each stage of MPC 1. On switch closure in the pulse generation stage, the magnetic assist by the SI
0follows the switching of the SW for 1.85 ㎲. Magnetic assist has the effect of reducing the switching loss [4]. Thus, an MPC that consists of the magnetic switch and the solid state switch can be operated with higher repetition rate, longer lifetime and higher reliability than conventional ones.
In Figure 9a, the charge energy in C
nis transferred to C
n+1by C-L-C resonance as SI
nsaturates with the following relation [23]:
) 2
( V SIn n dt
t
V = ⋅ τ
∫ ≥ N ⋅ Δ B m ⋅ A e (10) If the leakage current in SI
nis ignored, the voltage V
n(t) on C
nof the n-th stage is given by
) cos 1 2 ( ) cos 1 ( )
( 1
1
1 1 V t
C t C V C t
V n
n n n n
n − ω = − ω
= + −
−
− − (11)
where n = 1, 2 and 3,
T T C L
= 1
ω , L T = L SI
n−1+ SL n − 1 ,
n n
n
T C n C
C C C
= +
−
− 1
1 .
The voltage waveforms are compressed as the number of stages increases because L
Tis designed to decreases with the number of stages in the following way.
V·t for SI
nnot to saturate for τ n − 1 is obtained by
- 10 0 10 20 30
0 1 2 3 4 5 6
VC
0_MPC1 VC
1_MPC1 VC
2_MPC1 VC
3_MPC1 Vl d_MPC1
Ti me ( us) (a)
- 2000 0 2000 4000 6000 8000
0 1 2 3 4 5 6
I C
0_MPC1 I C
1_MPC1 I C
2_MPC1 I C
3_MPC1
Ti me ( us) (b)
Figure 9. Typical voltage (a) and current (b) waveforms on each stage of MPC 1.
) 2
( ⋅ − 1
=
=
⋅ t ∫ V t dt V SI
nn
V τ
(12)
And, the number of winding turns and the cross sectional area are chosen using the following equation.
e
m A
B N t
V ⋅ = ⋅ ⋅ (13) Using equation (6), the saturated inductance of the magnetic core is obtained with the determined geometry of the core.
The current pulse width of the n-th stage can be obtained with the values in Table 2 and Table 3 using the following relation:
τ 2 = π L T ⋅ C T (14)
- 5 0 5 10 15 20 25
4. 5 5 5. 5
VC1_MPC1 VC2_MPC1 VC3_MPC1 Vl d_MPC1
VC1_MPC2 VC2_MPC2 VC3_MPC2 Vl d_MPC2
Ti me ( us)