著者 Sun Chen‑Yi journal or
publication title
International Review for Spatial Planning and Sustainable Development
volume 5
number 4
page range 89‑100
year 2017‑10‑15
URL http://doi.org/10.24517/00053235
doi: 10.14246/irspsd.5.4_89
Creative Commons : 表示 ‑ 非営利 ‑ 改変禁止 http://creativecommons.org/licenses/by‑nc‑nd/3.0/deed.ja
89
DOI: http://dx.doi.org/10.14246/irspsd.5.4_89
Copyright@SPSD Press from 2010, SPSD Press, Kanazawa
Thermal Environment Simulation of an East-West Street in Taipei
Chen-Yi Sun1*
1 Department of Land Economics, National Chengchi University
* Corresponding Author, E-mail: [email protected] Received: Feb 11, 2017; Accepted: May 22, 2017
Keywords: heat island effect, wind path, thermal environment, building heat dissipation Abstract: In order to analyse the relationship between street geometry and thermal
environment in a city, this study collected data using five thermal comfort measuring instruments and applied computational fluid dynamics (CFD) to determine the relationship between street thermal environment (thermal comfort) and street geometry factors. According to this study’s results, street geometry, wind path, and waste heat of buildings all play very crucial roles with regard to effecting air temperature and thermal comfort conditions in the street. Meanwhile, the data from field work and CFD simulation confirmed that creating more wind paths and mitigating waste heat of buildings may be the best strategies for creating a comfortable thermal environment in the street.
1. INTRODUCTION
Taiwan is urbanizing more quickly every day. According to government statistics, about 17.33 million people (about 74%) of the total population (about 23.53 million) were living in metropolitan areas in Taiwan as of the end of 2016. As a result, Taiwan’s urban thermal environment is deteriorating, and the urban heat island effect has recently shown that high urban metropolitan temperatures will significantly impact people's lives if future urban planning and design does not take timely measures. In the past, the research and application methods of the heat island effect and thermal environment were similar, including the use of fixed meteorological station data to study the heat island effect (Magee, Curtis, & Wendler, 1999), using mobile observation methods for urban heat island (Sun, 2011; Sun et al., 2009), and the use of remote sensing as the main tool for measurement (Yuan & Bauer, 2007). However, those studies focused on urban temperature changes rather than human thermal comfort as their research focus.
Studies on the urban thermal environment have led to the emergence of street and community-scale research, such as a study that focused on the relationships between heat island and sky view factors in the cities of the Tama River basin, Japan (Yamashita et al., 1986), research that confirmed that vegetation is a kind of roof material cities can use to cool the
temperature (Sun et al., 2012), an analysis of building clusters and shading in urban canyons for a hot, dry climate (Bourbia & Awbi, 2004), research that claims that vegetation is an urban climate control strategy in the subtropical city of Gaborone, Botswana (Jonsson, 2004), an assessment of thermal stress in a street canyon in pedestrian areas with or without canopy shading (Paolini et al., 2014), a preliminary study on the local cool-island intensity of Taipei City parks (Chang, Li, & Chang, 2007), one research evaluating the cooling effects of greening for improving the outdoor thermal environment at an institutional campus in the summer (Srivanit & Hokao, 2013), and a discussion about characteristics of permeable pavement during hot summer weather and its impact on the thermal environment (Asaeda &
Ca, 2000).
In addition to the thermal environment, more research has paid attention to human feelings closely related to thermal comfort; for example, such research has included a study of the thermal comfort of urban microclimate and the number of space users (Nikolopoulou, Baker, & Steemers, 2001), a thermal comfort analysis in outdoor and semi-outdoor locations in Sydney, Australia (Nikolopoulou & Steemers, 2003), a paper discussing urban thermal comfort for outdoor cities in different European countries (Spagnolo
& De Dear, 2003), a study of urban comfort and psychosocial adaptation as a guide to urban spatial design (Nikolopoulou & Lykoudis, 2006), research focusing on the effects of shading on long-term outdoor thermal comfort (Lin, Matzarakis, & Hwang, 2010), a discussion of the seasonal effects of urban street shading on long-term outdoor thermal comfort (Hwang, Lin, &
Matzarakis, 2011), a paper studying the impact of street environmental characteristics on the microclimate, such as building density, green coverage, and street aspect ratio (Sun, 2011), and a discussion of temperature decreases in an urban canyon due to green walls and green roofs in diverse climates (Alexandri & Jones, 2008).
In fact, more studies have become interested in the thermal environment.
For example, one study compared different streets in Morocco to clarify the relationship between urban street environment and thermal environment (Johansson, 2006). Furthermore, research of low-rise urban street canyons in Israel (Pearlmutter, Bitan, & Berliner, 1999) shows that street hyperthermia is a common phenomenon in the desert climate at night. One study applied objectives to simulate the characteristic role of building aspect ratio and wind speed on air temperatures in various street canyon heating situations (Memon, Leung, & Liu, 2010), its results demonstrated that the air temperature difference between high and low aspect ratio street canyon was the highest at night. In addition, research has been done on temperature and human thermal comfort effects of street trees across three contrasting street canyon environments, focusing on the importance of greening as a potential method for passive cooling and for use in reducing ambient air temperatures (Coutts et al., 2016). Therefore, the results of this study have highlighted the importance of the street canyon aspect ratio and wind speed on urban heating.
To analyse the relationship between street geometry and thermal environment in cities, this study collected data using five thermal comfort measuring instruments and applied computational fluid dynamics (CFD) to determine the relationship between street thermal environment (thermal comfort) and street geometry factors.
2. METHODOLOGY
In this study, we have set up five fixed stations for microclimate and thermal comfort on an East-West Street in Taipei to collect data about street thermal environment temperature and humidity. Then, using CFD simulation data, we analysed the surrounding streets’ environmental factors and thermal environment measurement data so that we could specifically propose an effective approach for reducing the urban street thermal phenomenon.
2.1 Fixed monitoring station (thermal comfort measurement)
“Thermal comfort" is a form of subjective evaluation of ambient temperature, environmental temperature impact, humidity, wind speed, average radiation temperature, human activity, clothing, and other factors. In general, in this study, the actual measurement data includes a variety of thermal comfort indicators for evaluation, which were ultimately analysed using urban street environmental factors in order to clarify the composition of urban streets and thermal comfort.
In this study, the main instrument for measuring thermal comfort was the instrument cluster (Figure 1), which measures temperature, humidity, wind speed, wind direction, solar radiation, black bulb temperature, and wet bulb temperature.
2.2 Study area
Taipei City (25° 03′ N, 121° 30′ E) is the biggest city located in northern Taiwan. Surrounded by mountains, the climate is characterized by hot and humid summers and cold winters. The annual average temperature is 22°C, and the annual rainfall is about 2,100 mm. We selected Taipei City for this study because its weather conditions and street characteristics are representative of most cities in Taiwan. In this study, a number of experimental procedures were performed in urban street canyons, which were oriented with their long axis in an E–W direction and were located in a typical residential neighbourhood near National Cheng-Chi University (Figure 2). We established five measurement sites (Table 1) with the intention of investigating thermal characteristics during March. The centre of the streets consisted of asphalt roads, and the building façades were made of concrete, generally covered with plaster or tiles.
Figure 1. Fixed monitoring station
Figure 2. Fixed monitoring stations (S1 to S5 are the measurement sites)
2.3 Computational Fluid Dynamics
Computational Fluid Dynamics (CFD) is a discipline that has evolved rapidly since the 1960s and has matured significantly over the course of the past 50 years. CFD uses a numerical method to solve the governing equations of fluid mechanics using a computer in order to predict the flow field. This study applied the ANSYS 14.0 version of the FLUENT suite of software for urban street thermal environment simulation analysis, as well as thermal comfort data using the measured thermal environment data for comparison. Through the CFD simulation, the proposed scheme for improving the street environment and the potential benefits are expected to be verified.
Table 1. Measurement sites’ condition and photo Measurement sites’
condition Photo
S1 (Site #1): The north side of the measured area
is adjacent to a commercial building, and the south side is adjacent to a pedestrian walkway and tree-shaded street
beside the university.
S2 (Site #2): The north side of the measured area
is adjacent to a commercial building,
adjacent to the university's pedestrian trail but without a tree-
shaded street.
S3 (Site #3): North and south sides of the measured area are both adjacent to commercial buildings and have no
tree-shaded street.
S4 (Site #4): The north side of the measured area is adjacent
to commercial buildings, and the south side is the
university entrance without a tree-shaded
street.
S5 (Site #5): North and south sides of the measured area are both adjacent to commercial buildings without tree-
shaded street, but very close to a river.
3. SIMULATION 3.1 Model setting
In this study, we performed computational fluid dynamics using the Fluid Flow (FLUENT) suite of software from ANSYS 14.0. When ANSYS 14.0 computational fluid dynamics is carried out in a “finite field”, the relevant parameters are set in the reference range, and the simulation results more easily converge to a steady state. Therefore, the software operation process must first establish the 3D model of the reference field in the simulation area. However, due to the calculation function limit, the plane scale of the reference field model in this study is limited to 500 m * 500 m.
The study area is an east-west street about 450 m long with the highest building on either side being about 8 stories high (each story is about 3 meters high). To ensure accuracy, this study’s simulation uses actual building dimensions. In order to maintain the effectiveness of the model calculation, the model constructed for this study simplifies the model of buildings with the same number of stories. A total of 41 building measurement units are used, and the height of individual arcades and buildings are set according to the current situation survey and building control map (Figure 3).
3.2 Mesh setting
CFD simulation is based on the "mesh" theory. When completing a street model, the "mesh setting" approach is crucial. It includes the shape, size, density, and smoothness of the mesh, as well as some other parameters.
Meshing can be modelled in many ways in accordance with the actual situation (Bakker & Oshinowo, 2004). In general, the use of hexahedrons as mesh-splitting units c`an be achieved by using CFDs for simulations in a variety of instances (Mavriplis, 1997). For the most accurate simulation results, since the CPU performance and data may converge to a stable state, tetrahedron meshing is the most effective approach for this research.
In this study, the mesh is divided into tetrahedrons, the maximum length of the tetrahedral mesh is 5 meters, and the mesh is encrypted in the details of the buildings. The total number of model mesh is 670,183, the total number of mesh nodes is 133,109. To make the model more refined, we used the highest mesh smoothness of 100. Meanwhile, the local encryption part of the baseline field around the vertical boundaries’ subdivision units is 1.25 m, and the building’s unit is 1 m (Figure 4).
3.3 Condition setting
To determine the relationship between street thermal environment and comfort, we set up five fixed monitoring stations to collect data related to environmental factors and measured thermal comfort several times. In this study, the meteorological data obtained on March 23, 2013 were used as the background conditions for CFD simulation.
3.3.1 Wind conditions
In the present study, the wind direction data of the day were taken as the basis of the urban wind field. Said data show that the wind was moving to
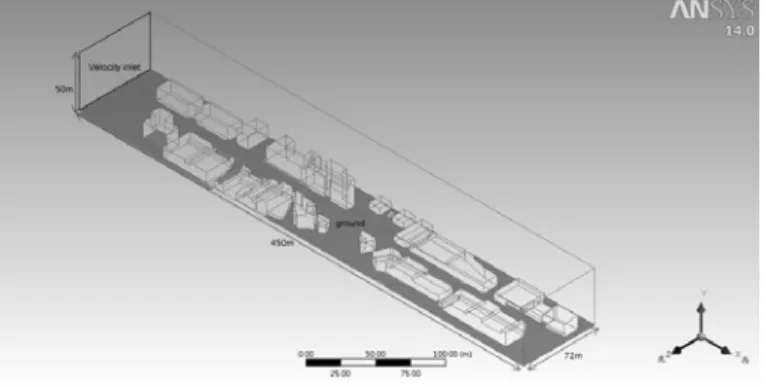
the east. Since the real street environment is open, the outlet is set to the base field in the other direction, except for the ground and the east (Figure 5).
3.3.2 Anthropogenic heat
Buildings emit various forms of artificial heat, but this study does not aim to measure the artificial heat of buildings. Therefore, we only estimate the heat generated through the air conditioning. Assuming a residential unit of approximately 115.70 square meters, the total energy consumption of two rooms with one freezer per ton of refrigeration is approximately 16,000 BTU / hr = 4000 kcal / hr, which is approximately 4600 Joules per second, or 4600 W (watt). Under this assumption, the heat generation per square meter is about 40W (39.76W). Therefore, in this study, 40W was used as the heat value of the external wall of the first floor of the buildings, and the thickness of the wall was set to 0.5 m. We conducted both 80W and 120W input simulations in order to observe the influence of anthropogenic heat on street thermal environment.
3.3.3 Calculation mode
CFDs are categorized into three types based on the following modes of calculation: 1. Direct Numerical Simulation (DNS); 2. Large-Eddy Simulation (LES); and 3. Reynolds Averaged Navier-Stokes Simulation (RANS). In theory, the DNS method can correctly simulate the flow field, but all the eddy currents are required. The LES method can calculate the large eddy and small eddy, but cannot operate on a single small platform.
Therefore, we used the RANS method to calculate the global mean value with the widely used k-ε turbulence model.
Because of its close to infinite eddy motion and nonlinear mathematics, turbulence motion is very complicated. As a result, in the related model establishment, a microcosmic model that considers vortex viscosity and Reynolds stress is established in three-dimensional space based on average property. The model can be divided according to the number of differential equations: zero, one equation, two equations, and multi-equation model. The k-ε turbulence model proposed by Launder and Spalding in 1972 is derived from a large number of experimental deductions of the typical two equations, which means that the model consists of two main variable equations (turbulent kinetic energy and energy consumption rate), with a wide application range of precision and reasonable characteristics.
In the CFD simulation, different parameter settings were established to clarify the correlation between street environment and thermal comfort. In this study, the initial temperature of the reference field was taken from the average temperatures collected at the four thermal comfort stations during the day, and the initial wind speed was measured by the thermal comfort station during four periods (Table 2).
In the second stage of the study, we used 40W, 80W, and 120W as the divergent heating value of the buildings. The initial atmospheric temperature was set at an average temperature of 26.286° C (299.436 K) measured at the five fixed stations between 10:00 and 21:00. Likewise, the initial wind speed was set at an average wind speed of 0.148 m /sec measured at the five fixed stations from 10:00 to 21:00.
Figure 3. 3D model
Figure 4. 3D model with mesh setting
Figure 5. 3D model with outlet setting
Table 2. Setting data
Time Average
Temperature (℃) Average Temperature (K)
Average Wind Speed (m/sec)
11:00-12:00 28.417 301.567 0.267
14:00-15:00 27.447 300.597 0.200
17:00-18:00 25.236 298.386 0.052
20:00-21:00 23.991 297.141 0.052
4. RESULTS AND DISCUSSION
4.1 Street thermal environment states at different time periods
In this research, we carried out CFD simulation of urban street thermal environment for four different time periods (Figures 6, 7, 8, and 9). The main variables come from background temperature and wind speed conditions. Furthermore, the street around the buildings’ heat dissipation in the four simulated calculations was maintained at a fixed value.
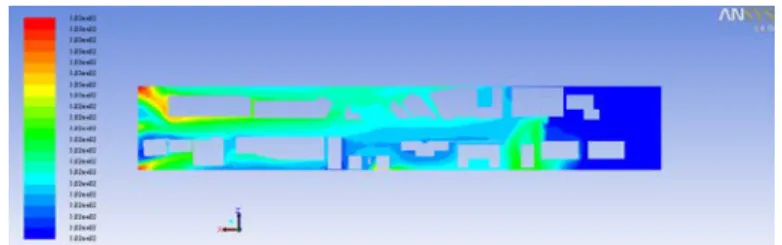
The simulation results demonstrate that high temperatures are mainly concentrated on the west and southeast of the study area. The main reason for the west side of the study area is that it is located in the downwind region; after accumulating a large number of buildings’ heat dissipation on both sides of the street, the region eventually appears to be at a higher temperature. On the other hand, the southeast side of the study area is because the large local area building heat dissipation and ventilation cooling conditions are poor. As a result, it also shows a high temperature situation.
Furthermore, in the middle part of the study area, the buildings are relatively sparse (building heat dissipation is lower), and the ventilation cooling effect is better, thus resulting in a low temperature situation.
The simulation results at three different periods show that even though the background temperature at noon and in the afternoon is higher, the wind speed in the evening is clearly lower than that of the other two periods.
Therefore, the simulated result of the evening indicates several regions with high temperature condition. In the CFD simulation, the background wind speed condition is a significant factor dominating the thermal environment simulation results.
4.2 Simulation of different building heat dissipation
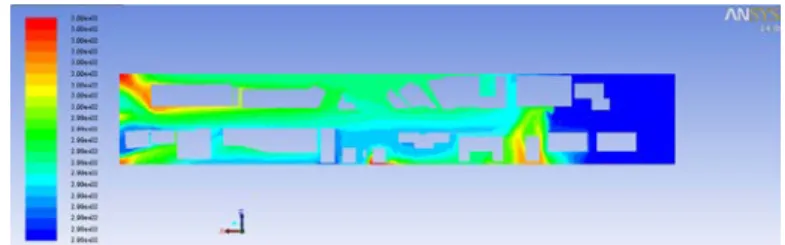
The different building heat dissipation simulation results (Figures 8, 10, and 11) show that as building heat dissipation increases, the overall temperature of the study area also gradually increases, and the temperature difference range of the whole area increases accordingly.
When the building heat dissipation increased from 40W to 120W, the overall temperature difference in the study area increased by 6K, which indicates that although the temperature in the low temperature region only increased slightly, a high temperature area accumulated due to the heat, resulting in other areas with about a 6K temperature difference. This change will seriously deteriorate the urban street thermal environment and thermal comfort, and its impact should not be underestimated.
Figure 6. Simulation result of 40W building artificial heat at 11:00-12:00
The simulation results show that if a building can effectively control its building heat dissipation, it could potentially maintain the urban street thermal environment at a certain condition of thermal comfort.
Figure 7. Simulation result of 40W building artificial heat at 14:00-15:00
Figure 8. Simulation result of 40W building artificial heat at 17:00-18:00
Figure 9. Simulation result of 40W building artificial heat at 20:00-21:00
Figure 10. Simulation result of 80W building artificial heat at 17:00-18:00
Figure 11. Simulation result of 120W building artificial heat at 17:00-18:00
5. CONCLUSION
In Taiwan, the majority of people live in cities, so urban street thermal environment and thermal comfort has a significant impact on quality of life.
Air conditioning, energy consumption, and outdoor activities all make up an important part of this. To investigate the relationship between urban street environment and thermal comfort in Taipei City, this study established five measurement points to determine the change of microclimatic data and then used CFD to simulate the thermal environment of urban streets. The urban street environment and people's field of activity could improve thermal comfort. The specific conclusions and recommendations of this study are described as follows:
According to the results of the study, the high-temperature area of the study area occurred around the west end of the model and the southeast side of the buildings. Therefore, an appropriate reduction in building density and retention of building spacing will be conducive to the flow of the urban micro-climate of the wind and promote urban street cooling.
The simulation results show obvious differences in the following four time periods: 11:00-12:00, 14:00-15:00, 17:00-18:00, and 20:00-21:00. The trend is “the background temperature is lower, and the simulation results are cooler”; furthermore, the simulation result of 20:00-21:00 is the most significant. The background temperature is shown to still be the most important factor affecting CFD simulation results, so controlling the heat dissipation of urban buildings to avoid heat from escaping the building to the streets to maintain a high-temperature state can improve the urban street thermal environment comfort as a strategic direction for improvement.
The greatest contribution of this paper is the use of the micro-weather station in the urban street thermal comfort analysis. In addition, through the analysis of the surrounding buildings, greening, shadows and human activities, this study suggests proposals to improve the thermal comfort of the streets. Based on the results of this study, creating more wind paths and mitigating waste heat from buildings may be the best strategies for mitigating urban warming and creating a comfortable thermal environment.
ACKNOWLEDGEMENTS
We would like to express our gratitude for the support of the National Science Council (project NSC Taiwan 101-2221-E-004-016).
REFERENCES
Alexandri, E., & Jones, P. (2008). "Temperature Decreases in an Urban Canyon Due to Green Walls and Green Roofs in Diverse Climates". Building and Environment, 43(4), 480-493.
Asaeda, T., & Ca, V. T. (2000). "Characteristics of Permeable Pavement During Hot Summer Weather and Impact on the Thermal Environment". Building and Environment, 35(4), 363-375.
Bakker, A., & Oshinowo, L. (2004). "Modelling of Turbulence in Stirred Vessels Using Large Eddy Simulation". Chemical Engineering Research and Design, 82(9), 1169-1178.
Bourbia, F., & Awbi, H. (2004). "Building Cluster and Shading in Urban Canyon for Hot Dry Climate: Part 1: Air and Surface Temperature Measurements". Renewable Energy, 29(2), 249-262.
Chang, C.-R., Li, M.-H., & Chang, S.-D. (2007). "A Preliminary Study on the Local Cool- Island Intensity of Taipei City Parks". Landscape and urban planning, 80(4), 386-395.
Coutts, A. M., White, E. C., Tapper, N. J., Beringer, J., & Livesley, S. J. (2016).
"Temperature and Human Thermal Comfort Effects of Street Trees across Three Contrasting Street Canyon Environments". Theoretical and applied climatology, 124(1-2), 55-68.
Hwang, R.-L., Lin, T.-P., & Matzarakis, A. (2011). "Seasonal Effects of Urban Street Shading on Long-Term Outdoor Thermal Comfort". Building and Environment, 46(4), 863-870.
Johansson, E. (2006). "Influence of Urban Geometry on Outdoor Thermal Comfort in a Hot Dry Climate: A Study in Fez, Morocco". Building and Environment, 41(10), 1326-1338.
Jonsson, P. (2004). "Vegetation as an Urban Climate Control in the Subtropical City of Gaborone, Botswana". International journal of climatology, 24(10), 1307-1322.
Lin, T.-P., Matzarakis, A., & Hwang, R.-L. (2010). "Shading Effect on Long-Term Outdoor Thermal Comfort". Building and Environment, 45(1), 213-221.
Magee, N., Curtis, J., & Wendler, G. (1999). "The Urban Heat Island Effect at Fairbanks, Alaska". Theoretical and applied climatology, 64(1), 39-47.
Memon, R. A., Leung, D. Y., & Liu, C.-H. (2010). "Effects of Building Aspect Ratio and Wind Speed on Air Temperatures in Urban-Like Street Canyons". Building and Environment, 45(1), 176-188.
Nikolopoulou, M., Baker, N., & Steemers, K. (2001). "Thermal Comfort in Outdoor Urban Spaces: Understanding the Human Parameter". Solar energy, 70(3), 227-235.
Nikolopoulou, M., & Lykoudis, S. (2006). "Thermal Comfort in Outdoor Urban Spaces:
Analysis across Different European Countries". Building and Environment, 41(11), 1455- 1470.
Nikolopoulou, M., & Steemers, K. (2003). "Thermal Comfort and Psychological Adaptation as a Guide for Designing Urban Spaces". Energy and Buildings, 35(1), 95-101.
Paolini, R., Mainini, A. G., Poli, T., & Vercesi, L. (2014). "Assessment of Thermal Stress in a Street Canyon in Pedestrian Area with or without Canopy Shading". Energy Procedia, 48, 1570-1575.
Pearlmutter, D., Bitan, A., & Berliner, P. (1999). "Microclimatic Analysis of “Compact”
Urban Canyons in an Arid Zone". Atmospheric Environment, 33(24), 4143-4150.
Spagnolo, J., & De Dear, R. (2003). "A Field Study of Thermal Comfort in Outdoor and Semi-Outdoor Environments in Subtropical Sydney Australia". Building and Environment, 38(5), 721-738.
Srivanit, M., & Hokao, K. (2013). "Evaluating the Cooling Effects of Greening for Improving the Outdoor Thermal Environment at an Institutional Campus in the Summer". Building and Environment, 66, 158-172.
Sun, C.-Y. (2011). "A Street Thermal Environment Study in Summer by the Mobile Transect Technique". Theoretical and applied climatology, 106(3-4), 433-442.
Sun, C.-Y., Brazel, A. J., Chow, W. T., Hedquist, B. C., & Prashad, L. (2009). "Desert Heat Island Study in Winter by Mobile Transect and Remote Sensing Techniques". Theoretical and applied climatology, 98(3-4), 323-335.
Sun, C.-Y., Lee, K. P., Lin, T. P., & Lee, S. H. (2012). "Vegetation as a Material of Roof and City to Cool Down the Temperature". Advanced Materials Research, 461, 552-556.
Yamashita, S., Sekine, K., Shoda, M., Yamashita, K., & Hara, Y. (1986). "On Relationships between Heat Island and Sky View Factor in the Cities of Tama River Basin, Japan".
Atmospheric Environment (1967), 20(4), 681-686.
Yuan, F., & Bauer, M. E. (2007). "Comparison of Impervious Surface Area and Normalized Difference Vegetation Index as Indicators of Surface Urban Heat Island Effects in Landsat Imagery". Remote sensing of Environment, 106(3), 375-386.