Transition of urinary ursodeoxycholic acid 7β-N- acetylglucosaminide and 3α-sulfate from neonates to adolescents using LC-ESI-MS/MS analysis
Hajime Takei
a,b, Tsuyoshi Murai
c, Takao Kurosawa
c, Takashi Iida
d, Hiroshi Nittono
a,b, Masaya Fujishiro
b, Xiao-Pen Lee
b, Junichi Sato
b, Keizo Sato
ba
Junshin Clinic Bile Acid Institute, Haramachi, Meguro-ku, Tokyo 152-0011, Japan
b
Department of Legal Medicine, Showa University School of Medicine.
c
School of Pharmacetical Science, Health Science University of Hokkaido.
d
Department of Chemistry, Colleage of Humanities & Science, Nihon University.
Running title:
Urinary UDCA-7β-NAG & 3α-sulfate by LC-ESI-MS/MS
Abstract
This study evaluated the urinary metabolism of ursodeoxycholic acid (UDCA) by measuring 7β-N-acetylglucosaminide and 3α-sulfate composition in neonates to adolescents using liquid chromatography electrospray ionization tandem mass spectrometry (LC-ESI-MS/MS). We obtained urine from 13 babies, corrected gestational age (CGA) 37-70 weeks, receiving UDCA to treat cholestasis due to total parenteral nutrition (TPN) and 8 patients, aged from 9 months to 15 years, who were treated with oral UDCA administration. The ratios of each UDCA conjugate to total UDCA were as follows: at CGA 37-42 weeks: non-amidated and glycine- or taurine- amidated ursodeoxycholic acid (UDCAs): 44.0 ± 8.0% (mean ± SD), UDCAs 3α-sulfate (UDCAs-3S): 37.8 ± 10.1%, UDCAs 7β-N- acetylglucosaminide (UDCAs-7NAG): 18.1 ± 14.9%; at 9months-3years:
UDCAs: 15.7 ± 23.2%, UDCAs-3S: 37.2 ± 8.8%, UDCAs-7NAG: 47.0 ± 22.1%. The ratios of UDCAs-3S and UDCAs-7NAG increased gradually between the ages of 5 and 15 years, as follows: UDCAs, 2.2 ± 1.3%;
UDCAs-3S, 51.2 ± 22.9%; and, UDCAs-7NAG, 46.6 ± 22.6%. The ratio of
3-sulfooxy-7-N-acetylglucosaminyl-UDCAs (UDCAs-3S-7NAG) lowered
by 0.2% per each age group. Urinary UDCAs-7NAG was not detectable in
2 of 21 patients, who were thus considered to have 7β-hydroxy bile acid N-
acetylglucosaminyl transferase (UGT3A1) deficiency. The enzyme activity of N-acetylglucosaminyl transferase to UDCAs was at the same degree as sulfotransferase to UDCAs in early neonates, but reached the adult values by 3-5 years.
Key words: ursodeoxycholic acid, 7β-N-acetylglucosaminide, 3α-sulfate,
liquid chromatography-tandem mass spectrometry
Introduction
Bile acids (BAs) are synthesized from cholesterol through various enzymatic reactions in the liver. Before being excreted into canaliculi, primary BAs, cholic acid (CA) and chenodeoxycholic acid (CDCA), are conjugated predominantly with taurine or glycine amino acids at the position-24 carboxylic group of BAs. After secretion into the small intestine through the bile duct, secondary BAs, deoxycholic acid (DCA), lithocholic acid (LCA), and UDCA, are converted from the primary BAs by the action of intestinal microbiota. Most primary and secondary BAs are reabsorbed back to the liver via the portal circulation for re-secretion into bile via a process called enterohepatic circulation [1].
BAs consist of free BAs and their conjugated forms, with two amino
acids (glycine and taurine), sulfonic acid, glucoside, glucuronic acid, and N-
acetylglucosamine [2-5]. The compositions of these BAs and their
conjugated forms can differ significantly at different periods of life from
neonates to adults and also between healthy humans and patients with
disorders such as liver disease. In patients with severe cholestasis for
example, BAs are excreted into the urine In patients with severe cholestasis
for example, BAs are more likely excreted into the urine as their sulfate
conjugation (forms mostly at C-3) and increases BA their hydrophilicity. [6-
8]. In lower amounts, BAs are also glucuronidated at C-3 or C24. N- acetylglucosaminidation is seemingly an even more selective glycosidic conjugation reaction because only 7β-hydroxylated BAs seem to be conjugated with N-acetylglucosamine in adult patients treated with UDCA [9-10], and the 7β-N-acetylglucosaminyl-UDCA glycine conjugate (GUDCA-7NAG) is part of the main pathway for excretion into urine together with 3α-sulfooxy-UDCA (UDCA-3S) glycine conjugates in adults.
The safe and efficient drug metabolism and excretion system are established dramatically through neonatal, infant, child, and adolescent periods [11].
During infancy, these changes are dynamic and largely related to organ functions important in metabolism, excretion, and changes in body composition; however, because changes in UDCA metabolism and the resultant metabolites are not known during infancy, we aimed to evaluate the UDCA metabolites, UDCAs-7NAG and UDCAs-3S, in urine.
Reported methods for UDCAs-7NAG analysis in the urine of primary
biliary cirrhosis (PBC) adult patients with UDCA treatment include fast atom
bombardment mass spectrometry (FAB-MS) [12], high performance liquid
chromatography (HPLC) [10], and enzyme-linked immunosorbent assay
(ELISA) [13]. In contrast, LC-ESI-MS/MS has been used for the analysis of
UDCAs-3S [14,15], but not for UDCAs-7NAG analysis. This study sought
to establish a highly sensitive measurement of urinary UDCAs-7NAG using LC-ESI-MS/MS, including its application to clinical samples, especially in low birth weight (LBW) neonates requiring the administration of UDCA for cholestasis induced by TPN (Total Parenteral Nutrition). Using the method, we found that neonates mainly excrete glycoursodeoxycholic acid (GUDCA) and tauroursodeoxycholic acid (TUDCA) and considerable amounts of both UDCAs-3S and UDCAs-7NAG. The urinary UDCAs-3S and UDCAs-7NAG levels gradually increased with age, and the urinary levels of 3 to 5-year olds were close to that of adolescents being administered exogenous UDCA.
Materials and methods Chemicals and reagents
Authentic reference bile acids used in this study were purchased from Sigma-Aldrich (St. Louis, MO, USA) as follows: CA, CDCA, UDCA, DCA, LCA, and d
4-CA (as an internal reference standard for LC-ESI-MS/MS analysis). Glycine- and taurine-conjugated bile acids were also purchased from Sigma-Aldrich. Other internal reference standards were also used, namely d
4-glycocholic acid (d
4-GCA) purchased from C/D/N Isotypes Inc.
(Quebec, Canada) and d
4-taurocholic acid (d
4-TCA), d
4-
glycochenodeoxycholic acid (d
4-GCDCA), and d4-taurochenodeoxycholic acid (d
4-TCDCA) from Toronto Research Chemicals Inc. (Ontario, Canada).
All bile acid 3-sulfates were synthesized in our laboratory by the procedures reported in previous papers [16], as were the glycine- and taurine-conjugates, 7α-hydroxy-3-oxo-4-cholenoic acid and 7α,12α-dihydroxy-3-oxo-4- cholenoic acid [17], and 5-cholenoic acids 3-sulfates, 3β-hydroxy-5- cholenoic acid, 3β,7α-dihydroxy-5-cholenoic acid, and 3β,7α,12α- trihydroxy-5-cholenoic acid [18,19]. In addition, we synthesized 7β-N- acetylglucosaminyl-UDCA (UDCA-7NAG), GUDCA-7NAG, 7β-N- acetylglucosaminyl-UDCA N-(2-sulfoethyl)amide(TUDCA-7NAG), 3α- sulfooxy-7β-N-acetylglucosaminyl-UDCA (UDCA-3S-7NAG), 3α- sulfooxy-7β-N-acetylglucosaminyl-UDCA N-(carboxymethyl)amide (GUDCA-3S-7NAG), and 3α-sulfooxy-7β-N-acetylglucosaminyl-UDCA N-(2-sulfoethyl)amide (TUDCA-3S-7NAG) [20,21]. Chemical structures of the unconjugated and conjugated ursodeoxycholic acids measured in this study are shown in Figure 1.
All solvents and reagents used were analytical reagent grade and
purchased from Kanto Chemical Co., Inc. (Tokyo, Japan). An InertSep C18-
B (100 mg/1 ml) solid phase extraction cartridge was obtained from GL
Sciences Inc. (Tokyo, Japan).
Preparation of standard solutions
The individual stock solutions of bile acids were prepared separately at 5 μmol/ml in ethanol and the stock solutions were stored at -20ºC. The individual stock solutions were mixed equally for analysis of unknown samples and five point-calibration standard solutions (30, 100, 300, 1000, 3000 pmol/ml) for LC-ESI-MS/MS analysis were prepared in 20%
acetonitrile. The calibration standard solutions were stable in analytical glass tubes for at least 2 weeks at 4ºC.
Clinical samples
Randomly collected urine samples were obtained from low birth weight (LBW) and normal birth weight (NBW) controls (UDCA non- administration) and patients who required UDCA for treatment of TPN- induced cholestasis. The age is shown as corrected gestational age (CGA), which is the gestational age plus the weeks after birth. In total, we analyzed samples from 8 controls of 36-44 weeks CGA (LBW; 3; 1198-1857g, NBW;
5), 4 patients of 37-42 weeks CGA, 5 patients of 44-49 weeks CGA (LBW;
4; 764-1980 g, NBW; 1), 4 patients of 55-70 weeks CGA (LBW; 4; 869-
1637 g), 4 patients aged from 9 months to 3 years, and 4 patients aged 5-15
years. All the urine specimens were stored at -20ºC until use. The analysis values were standardized to creatinine excretion, being expressed as mmol/mol creatinine (mmol/molCr) in each specimen. The urinary creatinine levels were determined using the Jaffe method [22].
Sample preparation
A 10-μl volume of deuterium-labeled internal standard, d
4-CA, d
4-GCA, d
4-TCA, d
4-GCDCA, and d
4-TCDCA were mixed equally, and then added at 100 nmol/ml each in 50% ethanol to 100 μl of sample. The solution was transferred onto the solid-phase extraction cartridge (InertSep C18-B 100 mg/1 ml, pre-conditioned with 1 ml of methanol and 3 ml of H
2O), which was washed with 1 ml of H
2O and then eluted with 1 ml of 90% ethanol.
After evaporation of the solvent, the residue was dissolved in 1 ml of 20%
acetonitrile, and then 20 μl of the solution was injected into the LC-ESI- MS/MS.
LC-ESI-MS/MS analysis
The LC-ESI-MS/MS system comprised a TSQ Quantum Discovery Max
mass spectrometer (Thermo Fisher Scientific, San Jose, CA, USA) equipped
with an ESI probe and Surveyor HPLC system (Thermo Fisher Scientific).
A chromatography separation column, InertSustain C18 (150 mm × 2.1 mm ID, 3 μm particle size; GL Sciences Inc., Tokyo, Japan), was employed at 35°C. A mixture of 10 mM ammonium acetate and acetonitrile was used as the eluent, and the separation carried out by linear gradient elution at a flow rate of 0.2 ml/min. The mobile phase composition was gradually changed as follows: ammonium acetate-acetonitrile (90:10, v/v) for 0.5 minutes, ammonium acetate-acetonitrile (78:22, v/v) for 0.5-5 minutes, ammonium acetate-acetonitrile (40:60, v/v) for 5-46 minutes, ammonium acetate- acetonitrile (2:98, v/v) for 46-56 minutes, and ammonium acetate- acetonitrile (2:98, v/v) for 4 minutes. The total run time was 60 minutes.
To operate the LC-ESI-MS/MS, the spray voltage and vaporizer temperature were set at 3500 V and 330°C, respectively. The sheath and auxiliary gas (nitrogen) pressures were set at 50 and 10 arbitrary units, respectively, and the ion transfer capillary temperature was 330°C. The collision gas (argon) pressure and the collision energy were kept at 1.3 mm Torr and 27-55 eV, respectively, all in the negative ion mode [19,23].
Method validation
The method was fully validated, in according to the ICH Q2(R1) [24].
Method linearity was determined by analyzing five point-calibration
standard solutions. Accuracy and precision were assessed using the three concentrations of urine samples spiked with known amount of bile acids, evaluated by analyzing five replicates per run of samples contained in one run per day over a 5-day period. LOD (limit of detection) was established using a method based on the calibration curves, LOD = 3.3σ/S (σ = the standard deviation of the response, S = the slope of the calibration curve used as deviation of y-intercept). Matrix effects were determined by comparing the linearity of working solutions prepared from extracted human urine samples to linearity in 20% acetonitrile.
Results
LC-ESI-MS/MS analysis of unconjugated and conjugated UDCA
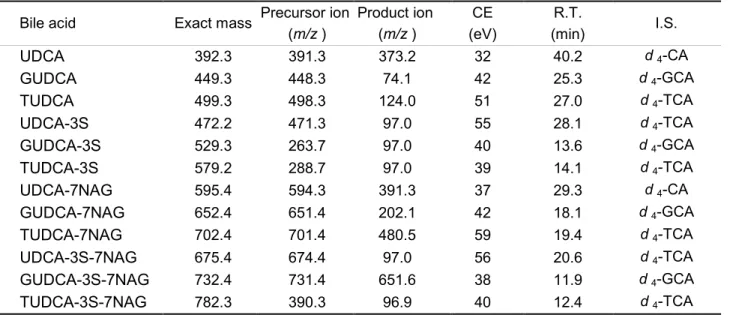
Using ESI-MS operating in the negative-ion mode, the related UDCA compounds analyzed herein possess a sulfooxy group at the 3 position, and a carboxyl group or amides conjugated with glycine or taurine at the 24 position, terminal carbon atom of the side chain. LC-ESI-MS/MS analysis of UDCAs, UDCAs-3S, UDCAs-7NAG, and UDCAs-3S-7NAG were easily ionized by the electron spray ionization and fragmented under the condition of low-energy collision-induced dissociation (CID). The compounds’
precursor ions mainly formed from the deprotonated molecule [M−H]
−or
half of the 3-sulfate compounds formed doubly charged molecules [M−2H]
2−. Those product ions were optimized at m/z 74 for glycine-conjugated bile acids, at m/z 124 for taurine-conjugate bile acids, and at m/z 97 for 3 variants of UDCAs-3S such as bile acid sulfates [19,23]. Whereas UDCAs-7NAG provided [UDCA]
−at m/z 391.3, GUDCA-7NAG produced [NAG−H
2O]
−at m/z 202.1, TUDCA-7NAG gave [M−NAG]
−at m/z 480.5, and GUDCA-3S- 7NAG gave [M−SO
3]
−at m/z 651.6 (Table 1). Typical selected reaction monitoring (SRM) chromatograms for the authentic 12 variants of UDCA and related compounds, as shown in Figure 2, required 60 min for the simultaneous separation and determination of all bile acids.
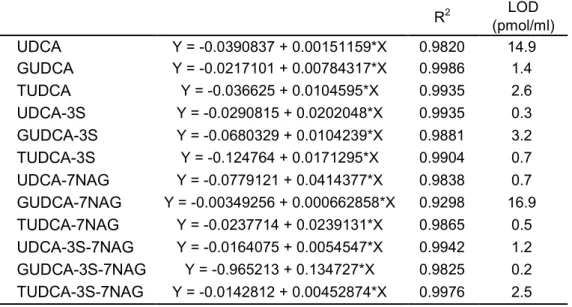
Linearity, sensitivity, and precision
The linearity of the method was entered by 10 variants of conjugated
UDCA standard curve calibrators ranging from 30 to 3000 pmol/ml. For the
other acids, UDCA and GUDCA-7NAG, standard linearity ranged from 100
to 30000 pmol/ml. Peak area ratios (analytes/internal standard) were
proportional to the concentration. The calibration curves appeared linear and
the slopes, the intercepts, and the correlation coefficients were determined
by least square lines with a weighting factor of 1/(concentration)
2. The
correlation coefficients and detection limit LOD = 3.3σ/S (σ = the standard
deviation of the response, S = the slope of the calibration curve used as deviation of y-intercept) are listed in Table 2.
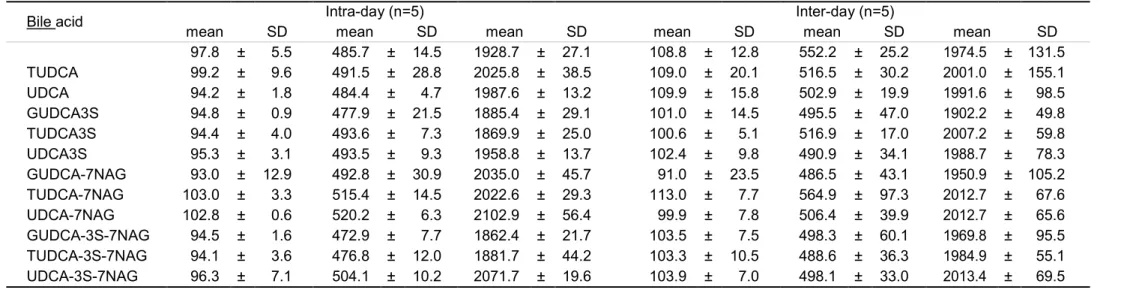
To confirm the precision of UDCA-related quantification using LC-ESI- MS/MS, 5 replicates per run of samples and 1 run per day over a 5-day period were analyzed. Precision of compounds, measured as C.V. (%), ranged from 0.6% to 12.9% and 3.3% to 25.9% for intraday and interday measurements, respectively (Table 3).
Spiked urine samples were derived by adding individual derivative reagents to prepare the solution for recovery test. Five replicates at low and medium quality concentrations for 12 variants of UDCA-related bile acids were determined. Absolute recovery was determined to evaluate the measurement accuracy of the derivatives added to the three male urine samples in known quantities. Recoveries of UDCA-related bile acids from all urine samples are listed in Table 4. The results show no significant ion suppression or enhancement effects, nor were there significant matrix effects for other BAs.
Application
We analyzed 60 variant bile acids, usual bile acids non-amidated and
amidated with glycine or taurine at their carboxylic group, with further
conjugation to sulfonic at the 3 position, in addition 3β-hydroxy-Δ
5-bile acids unconjugated and conjugated with those and 3-oxo-Δ
4-bile acids nonamidated and amidated with glycine or taurine at their carboxylic group.
UDCAs-7NAG and UDCAs-3S-7NAG were newly determined in this study.
Figure 3 shows the level of 60 variant BAs in 8 control samples, 13 urine samples obtained from patients including LBW and NBW being administered UDCA for TPN-related cholestasis from CGAs of 37 to 70 weeks and 8 urine samples obtained from UDCA administration patients aged from 9 months to 15 years. The ratio of total UDCA to total BAs (TBA) in the control urines (n=8) from CGA 36-44 weeks was lower, 0.7%, whereas this ratio in urines from patients of CGA 37-42 weeks ranged from 26.5 to 89.9%. Figure 4 compares UDCA-related BA composition in urines from individuals aged CGA 37-70 weeks to those aged 9 months to 15 year in patients treated with UDCA. The ratio to total UDCA at CGA 37-42 weeks were as follows; UDCAs: 44.0±8.0%, UDCAs-3S: 37.8 ± 10.1%, UDCAs- 7NAG: 18.1 ± 14.9%. And the ratio to total UDCA at 9months-3years were;
UDCAs: 15.7 ± 23.2%, UDCAs-3S: 37.2 ± 8.8%, and UDCAs-7NAG: 47.0
± 22.1%. Followed by UDCAs, the ratios of UDCAs conjugates by N-
acethylglucosamine and sulfonic acid were close to adolescent UDCA
components at 3 years. Of the 21 patients treated with UDCA, 2 did not
excrete UDCAs-7NAG, which may be considered as UDP- glycosyltransferase (UGT3A1) deficiency. UDCAs-3S-7NAG components were detected at levels lower than 0.2% at all ages.
Discussion
We describe here a simple, sensitive, and accuracy LC-ESI-MS/MS method for the determination of UDCA-7NAG, GUDCA-7NAG, TUDCA- 7NAG, and their 3α-sulfonic acid double conjugates in urine. This method also analyzed another 54 BA variants such as usual BAs, 3-oxo-Δ
4- BAs, 3β- hydroxy-Δ
5-BAs, and those conjugated to glycine, taurine, and sulfonic acid simultaneously. We found that the MS/MS conditions of measurement for UDCAs-7NAG and UDCAs-3S-7NAG were different from those for other bile acids in collision fragments. The ordinary product ion (m/z) of conjugated BAs are for glycine conjugate: 74 [H
2NCH
2COO
-], taurine conjugate: 124 [H
2NC
2H
4SO
3-], and sulfate: 97 [HSO
4-], while those for each UDCA conjugate are UDCA-7NAG: 391.3, GUDCA-7NAG: 202.1, TUDCA-7NAG: 480.5, UDCA-3S-7NAG: 97.0, GUDCA-3S-7NAG: 651.6, and TUDCA-3S-7NAG: 96.9 [25,26].
While large amounts of UDCAs-7NAG in the urine and serum of PBC
patients treated with UDCA indicates disease progression [9], the
physiological significance of BA N-acetylglucosaminide is not clear,
although it might be a metabolite of conversion into a form capable of
urinary excretion or of sulfated BA formation. HPLC methods have been
used to analyze UDCAs-7NAG concentrations in adult urine and serum,
including fluorescence labeled treatment, GC/MS method using
trimethylsilylether derivatization, and immunoassay using diluted sample
specimen, but not LC-ESI-MS/MS. In addition the levels of UDCAs-7NAG
in neonates or infants have not been analyzed by any method. BA N-
acetylglucosamination might be considered to occur as UGT3A1, mainly in
the kidney, while sulfation activity is present in both liver and kidney, and
the activity is increased relatively early in the neonatal period. These results
describe the transition of UDCA-7β-N-acetylglucosaminide and 3α-sulfate
urine concentrations from neonates including LBW to adolescents receiving
UDCA using LC-ESI-MS/MS analysis. General enzymes involved in drug
metabolism are those of the cytochrome P450 (CYP) family (phase I
reactions) and the uridine diphosphate glucuronosyltransferase (UGT),
sulfotransferase, glutathione-S-transferase, and N-acetyltransferase families
(phase II reactions). There are also specific isozymes within each family that
mature at different rates during the first several years of life. The effect on
metabolism of a specific medication thus depends on the dominant enzymatic pathways responsible for metabolism of the drug [27,28]. Herein, we compared the level of sulfate conjugation at C-3α-OH and N- acetylglucosaminidation at C-7β-OH to UDCA to metabolites of UDCA in neonatal urine from patients treated with UDCA, and found that there are activities of both N-acetylglucosaminidation to UDCA and sulfate conjugation, already existing in the early neonatal period (CGA 37-42w).
This expression gradually increases in the first 1–2 years after birth and stabilizes at 3–5 years. The urinary concentration ratios of GUDCA-3S and GUDCA-7NAG to total UDCA are about 40% respectively, which could be related to the maturation of this pathway after UDCA administration in the neonate age groups compared to the adolescents group. Sulfate or glycine conjugation of general drug metabolism appears to be very efficient at birth [27,28], while the maturation of sulfation to UDCA was not likely to be earlier than N-acethylglucosaminidation. The UGT3A1 deficiency is reported as about 10% in the study of the Niemann Pick Type C biomarker analyzing 3α-sulfooxy-7β-N-acethylglucosaminyl-Δ
5-cholen-24-oic acid [29], and similarly in this study, 2 of 21 samples showed no UDCAs-7NAG.
Conflict of interest disclosure
The authors have no conflicts of interest to declare.
References
1 ) Hofmann AF. Bile acids and the enterohepatic circulation. Arias IM. ed.
The liver: Biology and Pathobiology, 5th edn. Wiley; 2009. pp 287–304.
2 ) Back P, Spaczynski K, Gerok W. Bile-salt glucuronides in urine. Hoppe Seyler’s Z Physiol Chem. 1974; 355: 749-752.
3 ) Goto J, Kato H, Saruta Y, et al. Separation and determination of bile acid 3-sulfates in human bile by high-performance liquid chromatography. J Chromatogr. 1981; 226: 13-24.
4 ) Goto J, Suzaki K, Ebihara M, et al. Separation and characterization of bile acid 3-glucuronides in human urine by high performance liquid chromatography. J Chromatogr. 1985; 345: 241-250.
5 ) lkegawa S, Okuyama Y, Oohashi J, et al. Separation and detection of bile acid 24-glucuronides in human urine by liquid chromatography combined with electrospray ionization mass spectrometry. Anal Sci.
1999; 15: 625-631.
6 ) Raedsch R, Lauterburg BH, Hofmann AF. Altered bile acid metabolism in primary biliary cirrhosis. Dig. Dis. Sci. 1981; 26: 394-401.
7 ) Stiehl A. Disturbances of bile acid metabolism in cholestasis. Clin.
Gastroenterol. 1977; 6: 45- 67.
8 ) Makino I, Hashimoto H, Shinozaki K, et al. Sulfated and nonsulfated
bile acids in urine, serum, and bile of patients with hepatobiliary diseases. Gastroenterology 1975; 68: 545-553.
9 ) Marschall HU, Green G, Egestad B, et al. Isolation of bile acid glucosides and N-acetylglucosaminides from human urine by ion- exchange chromatography and reversed-phase high-performance liquid chromatography. J Chromatogr. 1988; 452: 459-468.
10 ) Niwa T, Fujita K, Goto J, et al. Separation and characterization of ursodeoxycholate 7-N-acetylglucosaminides in human urine by high- performance liquid chromatography with fluorescence detection. J Liquid Chromatogr. 1993; 16: 2531-2544.
11 ) Kearns GL, Abdel-Rahman SM, Alander SW, et al. Developmental pharmacology drug disposition, action, and therapy in infants and children. N Engl J Med. 2003; 349: 1157–1167.
12 ) Meng LJ, Reyes H, Palma J, et al. Effects of ursodeoxycholic acid on conjugated bile acids and progesterone metabolites in serum and urine of patients with intrahepatic cholestasis of pregnancy. J Hepatol. 1997;
27: 1029-1040.
13 ) Kobayashi N, Oiwa H, Goto J. Production and characterization of
group-specific monoclonal antibodies recognizing nonamidated,
glycine- and taurine-amidated ursodeoxycholic acid 7-N-
acetylglucosaminides. J Steroid Biochem Mol Biol. 1998; 64: 171-177.
14 ) Goto T, Myint KT, Sato K, et al. LC/ESI-tandem mass spectrometric determination of bile acid 3-sulfates in human urine 3beta-sulfooxy- 12alpha-hydroxy-5beta-cholanoic acid is an abundant nonamidated sulfate. J Chromatography B. 2007; 846: 69-77.
15 ) Bathena SP, Mukherjee S, Olivera M, et al. The profile of bile acids and their sulfate metabolites in human urine and serum. J Chromatogr B.
2013; 942-943: 53-62.
16 ) Goto J, Kato H, Nambara T. Synthesis of monosulfates of unconjugated and conjugated bile acids. Chem Pharm Bull (Tokyo) 1979; 27: 1402- 1411.
17 ) Leppik RA. Improved synthesis of 3-keto, 4-ene-3-keto, and 4,6-diene- 3-keto bile acids. Steroids. 1983; 41: 475-484.
18 ) Tohma M, Mahara R, Takeshita H, et al. A convenient synthesis of 3beta,12alpha-,3beta,7alpha- and 3beta,7beta- dihydroxy-5-cholen-24- oic acids: unusual bile acids in human biological fluids. Steroids. 1986;
48: 331-338.
19 ) Murai T, Oda K, Toyo T, et al. Detection of 3β-hydroxy-Δ
5-bile acids
and related compounds in biological fluids of patients with
cholestasis by liquid chromatography-tandem mass spectrometry. J
Chromatography B. 2013; 923-924: 120-127.
20 ) Marschall HU, Egestad B, Matern H, et al. N-acetylglucosaminides. A new type of bile acid conjugate in man. J Biol Chem. 1989; 264: 12989- 12993.
21 ) Niwa T, Koshiyama T, Goto J, et al. Synthesis of N- acetylglucosaminides of unconjugated and conjugated bile acids.
Steroids. 1992; 57: 522-529.
22 ) Roy W. Bonsnes and Hertha H. Taussky. ON THE COLORIMETRIC DETERMINATION OF CREATININE BY THE JAFFE REACTION.
J. Biol. Chem. 1945 158: 581-591.
23 ) Muto A, Takei H, Unno A, et al. Detection of delta4-3-oxo-steroid 5beta-reductase deficiency by LC-ESI-MS/MS measurement of urinary bile acids. J Chromatogr B. 2012; 900: 24–31.
24 ) International Council for Harmonization of Technical Requirements for Pharmaceuticals for human use. Validation of Analytical Procedures:
Text and Methodology (Internet). 2005. (accessed 2017 02 24)
Available form: http://www.ich.org/products/guidelines/quality- single/article/validation-of-analytical-procedures-text-and-
methoddology.html
25 ) Maekawa H, Ohno K, Nittono H, et al. LC/ESI-MS/MS analysis of
urinary 3β-sulfooxy-7β-N-acetylglucosaminyl-5-cholen-24-oic acid and its amides: new biomarkers for the detection of Niemann-Pick type C disease. Steroids. 2013; 78: 967-972.
26 ) Maekawa M, Shimada M, Iida T, et al. Tandem mass spectrometric characterization of bile acids and steroid conjugates based on low- energy collision-induced dissociation. Steroids. 2014; 80: 80–91.
27 ) Hines RN. Developmental expression of drug metabolizing enzymes:
impact on disposition in neonates and young children. Int J Pharm.
2013; 452: 3–7.
28 ) Lu H, Rosenbaum S. Developmental Pharmacokinetics in Pediatric Populations. J Pediatr Pharmacol Ther. 2014; 19: 262-276.
29 ) Mazzacuva F, Mills P, Mills K, et al. Identification of novel bile acids
as biomarkers for the early diagnosis of Niemann-Pick C disease. FEBS
Lett. 2016; 590: 1651-1662.
Legends for figures
Fig. 1. Chemical structures of the unconjugated and conjugated ursodeoxycholic acids measured in this study.
Fig. 2. SRM chromatograms of unconjugated and conjugated UDCA.
Fig. 3. The concentration of total UDCA and other bile acids in urine samples from controls and patients administered with UDCA treatment. The error bars show mean + SD measured total bile acids.
Fig. 4. Bile acid composition of unconjugated and conjugated UDCA in urine
samples with patients administered with UDCA treatment.
OH OH
COR COR
HO HO3S
COR COR
Ac : CH3CO Ac : CH3CO
AcHN
HO H O O
OH
CHOH 2OH HO3S
H
AcHN
O O
OH CHOH 2OH
UDCAs-7NAG UDCA-7NAG GUDCA-7NAG TUDCA-7NAG
R OH NHCH2COOH NH(CH2)2SO3H
UDCAs-3S-7NAG UDCA-3S-7NAG GUDCA-3S-7NAG TUDCA-3S-7NAG
R OH NHCH2COOH NH(CH2)2SO3H UDCAs
H
R UDCAs-3S
H
R
UDCA OH UDCA-3S OH
GUDCA TUDCA
NHCH2COOH NH(CH2)2SO3H
GUDCA-3S TUDCA-3S
NHCH2COOH NH(CH2)2SO3H
10 20 30 40 50 Time (min)
UDCA UDCA-3S UDCA-7NAG UDCA-3S-7NAG GUDCA
GUDCA-3S GUDCA-7NAG GUDCA-3S-7NAG TUDCA
TUDCA-3S TUDCA-7NAG TUDCA-3S-7NAG
Intensity
700
600
500
400
300
200
100
0
36-44w 37-42w 44-46w 55-60w 9m-3y 5-15y 49w 70w (n=8)
controls
(n=4) (n=4) (n=3) (n=4) (n=4) (n=1) (n=1)
UGT3A1 defect other bile acids
total UDCA
Concentration (mmol/molCr)
0 20 40 60 80 100 (%) 37–42 w
(n=4)
44–46 w (n=4)
55-60 w (n=3)
9 m–3 y (n=4)
5–16 y (n=4)
49 w (n=1) 70 w (n=1)
UDCAs UDCAs-3S UDCAs-7NAG UDCAs—3S-7NAG
UGT3A1 defect
Table 1 LC-ESI-MS/MS parameters of reference bile acids
Bile acid Exact mass Precursor ion Product ion CE R.T. I.S.
(m/z ) (m/z ) (eV) (min)
UDCA 392.3 391.3 373.2 32 40.2 d 4-CA GUDCA 449.3 448.3 74.1 42 25.3 d 4-GCA TUDCA 499.3 498.3 124.0 51 27.0 d 4-TCA UDCA-3S 472.2 471.3 97.0 55 28.1 d 4-TCA GUDCA-3S 529.3 263.7 97.0 40 13.6 d 4-GCA TUDCA-3S 579.2 288.7 97.0 39 14.1 d 4-TCA UDCA-7NAG 595.4 594.3 391.3 37 29.3 d 4-CA GUDCA-7NAG 652.4 651.4 202.1 42 18.1 d 4-GCA TUDCA-7NAG 702.4 701.4 480.5 59 19.4 d 4-TCA UDCA-3S-7NAG 675.4 674.4 97.0 56 20.6 d 4-TCA GUDCA-3S-7NAG 732.4 731.4 651.6 38 11.9 d 4-GCA TUDCA-3S-7NAG 782.3 390.3 96.9 40 12.4 d 4-TCA
Table 2 Linearity and sensitivity by LC-ESI-MS/MS
R2 LOD
(pmol/ml) UDCA Y = -0.0390837 + 0.00151159*X 0.9820 14.9 GUDCA Y = -0.0217101 + 0.00784317*X 0.9986 1.4 TUDCA Y = -0.036625 + 0.0104595*X 0.9935 2.6 UDCA-3S Y = -0.0290815 + 0.0202048*X 0.9935 0.3 GUDCA-3S Y = -0.0680329 + 0.0104239*X 0.9881 3.2 TUDCA-3S Y = -0.124764 + 0.0171295*X 0.9904 0.7 UDCA-7NAG Y = -0.0779121 + 0.0414377*X 0.9838 0.7 GUDCA-7NAG Y = -0.00349256 + 0.000662858*X 0.9298 16.9 TUDCA-7NAG Y = -0.0237714 + 0.0239131*X 0.9865 0.5 UDCA-3S-7NAG Y = -0.0164075 + 0.0054547*X 0.9942 1.2 GUDCA-3S-7NAG Y = -0.965213 + 0.134727*X 0.9825 0.2 TUDCA-3S-7NAG Y = -0.0142812 + 0.00452874*X 0.9976 2.5
Table 3 intra-day (n-5) and inter-day (n=5)
Bile acid Intra-day (n=5) Inter-day (n=5)
mean SD mean SD mean SD mean SD mean SD mean SD
97.8 ± 5.5 485.7 ± 14.5 1928.7 ± 27.1 108.8 ± 12.8 552.2 ± 25.2 1974.5 ± 131.5 TUDCA 99.2 ± 9.6 491.5 ± 28.8 2025.8 ± 38.5 109.0 ± 20.1 516.5 ± 30.2 2001.0 ± 155.1 UDCA 94.2 ± 1.8 484.4 ± 4.7 1987.6 ± 13.2 109.9 ± 15.8 502.9 ± 19.9 1991.6 ± 98.5 GUDCA3S 94.8 ± 0.9 477.9 ± 21.5 1885.4 ± 29.1 101.0 ± 14.5 495.5 ± 47.0 1902.2 ± 49.8 TUDCA3S 94.4 ± 4.0 493.6 ± 7.3 1869.9 ± 25.0 100.6 ± 5.1 516.9 ± 17.0 2007.2 ± 59.8 UDCA3S 95.3 ± 3.1 493.5 ± 9.3 1958.8 ± 13.7 102.4 ± 9.8 490.9 ± 34.1 1988.7 ± 78.3 GUDCA-7NAG 93.0 ± 12.9 492.8 ± 30.9 2035.0 ± 45.7 91.0 ± 23.5 486.5 ± 43.1 1950.9 ± 105.2 TUDCA-7NAG 103.0 ± 3.3 515.4 ± 14.5 2022.6 ± 29.3 113.0 ± 7.7 564.9 ± 97.3 2012.7 ± 67.6 UDCA-7NAG 102.8 ± 0.6 520.2 ± 6.3 2102.9 ± 56.4 99.9 ± 7.8 506.4 ± 39.9 2012.7 ± 65.6 GUDCA-3S-7NAG 94.5 ± 1.6 472.9 ± 7.7 1862.4 ± 21.7 103.5 ± 7.5 498.3 ± 60.1 1969.8 ± 95.5 TUDCA-3S-7NAG 94.1 ± 3.6 476.8 ± 12.0 1881.7 ± 44.2 103.3 ± 10.5 488.6 ± 36.3 1984.9 ± 55.1 UDCA-3S-7NAG 96.3 ± 7.1 504.1 ± 10.2 2071.7 ± 19.6 103.9 ± 7.0 498.1 ± 33.0 2013.4 ± 69.5
Table 4 Relative recoveries of unconjugated and conjugated ursodeoxycholic acids from urine.
Bile acid Concentration added 100 pmol/ml Concentration added 500 pmol/ml Concentration added 2000 pmol/ml recovery (%, mean ± SD) recovery (%, mean ± SD) recovery (%, mean ± SD)
GUDCA 97.8 ± 5.5 97.1 ± 2.8 96.4 ± 1.3
TUDCA 99.2 ± 9.6 98.3 ± 5.7 101.3 ± 1.9
UDCA 94.2 ± 1.8 96.9 ± 0.9 99.4 ± 0.7
GUDCA3S 94.8 ± 0.9 95.6 ± 4.1 94.3 ± 1.4
TUDCA3S 94.4 ± 4.0 98.7 ± 1.4 93.5 ± 1.2
UDCA3S 95.3 ± 3.1 98.7 ± 1.8 97.9 ± 0.7
GUDCA-7NAG 93.0 ± 12.9 98.6 ± 6.1 101.7 ± 2.3
TUDCA-7NAG 103.0 ± 3.3 103.1 ± 3.0 101.1 ± 1.5
UDCA-7NAG 102.8 ± 0.6 104.0 ± 1.3 105.1 ± 3.0
GUDCA-3S-7NAG 94.5 ± 1.6 94.6 ± 1.5 93.1 ± 1.0
TUDCA-3S-7NAG 94.1 ± 3.6 95.4 ± 2.3 94.1 ± 2.1
UDCA-3S-7NAG 96.3 ± 7.1 100.8 ± 2.1 103.6 ± 1.0