Characterization of Structure, Ligand-binding
Ability, and Thermal Stability of Mouse
Lipocalin-type Prostaglandin D Synthase
著者
Miyamoto Yuya
内容記述
学位授与大学: Osaka Prefecture University(大阪
府立大学), 学位の種類: 博士(応用生命科学), 学
位記番号: 論生命第40号, 学位授与年月日:
2012-03-31, 指導教員: 乾 隆.
Characterization of Structure, Ligand-binding
Ability, and Thermal Stability of Mouse
Lipocalin-type Prostaglandin D Synthase
D
Yuya Miyamoto
2012
Contents
List of Abbreviations
... VGeneral Introduction
... 1Chapter 1
... 8Structural analysis of mouse lipocalin-type prostaglandin D synthase
complexed with biliverdin by small-angle X-ray scattering and
multi-dimensional NMR
... 81.1. Abstract ... 9
1.2. Introduction ... 10
1.3. Materials and methods ... 12
1.3.1. Chemicals ... 12
1.3.2. Expression of recombinant mouse C65A L-PGDS ... 12
1.3.3. Fluorescence quenching assay ... 12
1.3.4. Small-angle X-ray scattering measurements ... 13
1.3.5. Ab initio modeling ... 15
1.3.6. NMR measurements and signal assignments for C65A L-PGDS ... 15
1.3.7. Structure calculation ... 18
1.3.8. Electrostatic potential calculation ... 19
1.3.9. Measurements of chemical shift perturbations upon binding of biliverdin ... 19
1.3.10. Relaxation measurements ... 19
1.4.1. Binding affinity of biliverdin for C65A L-PGDS ... 21
1.4.2. SAXS analysis ... 22
1.4.3. NMR solution structure of C65A L-PGDS ... 27
1.4.4. Chemical shift perturbations of L-PGDS induced by binding of biliverdin ... 36
1.4.5. Relaxation analysis ... 38
1.5. Discussion ... 41
Chapter 2
... 46NMR and CD analysis of an intermediate state in the thermal unfolding
process of mouse lipocalin-type prostaglandin D synthase
... 462.1. Abstract ... 47
2.2. Introduction ... 48
2.3. Materials and methods ... 51
2.3.1. Protein preparations ... 51
2.3.2. NMR analysis ... 51
2.3.3. CD analysis ... 52
2.3.4. DSC analysis ... 53
2.3.5. Fluorescence quenching assay ... 53
2.4. Results ... 55
2.4.1. Thermal unfolding process of C65A L-PGDS characterized by multi-dimensional NMR measurements ... 55
2.4.2. Thermal transition of upper region of -barrel characterized by 1D 1H-NMR measurements ... 58
2.4.3. Thermal transition of bottom region of -barrel in W54F/C65A mutant characterized by CD spectroscopy ... 61
2.4.4. Thermal transition of W54F/C65A mutant characterized by DSC measurements 63
2.4.5. Binding ability of biliverdin for C65A L-PGDS during thermal unfolding ... 65
2.5. Discussion ... 66
Conclusions
... 69References
... 71List of Publications
... 84List of Abbreviations
Cp heat capacity change
G Gibbs energy change
H(Tm) van’t Hoff enthalpy change
Hcal molar calorimetric enthalpy change tot composite chemical shift difference
molar ellipticity
e internal correlation time
CD circular dichroism
CSF cerebrospinal fluid
CSI chemical shift index
DSC differential scanning calorimetry
Dmax maximum diameter of particle
E.coli Escherichia coli
HSQC heteronuclear single quantum coherence
I intermediate state
I(0,C) forward scattering intensity
I(S,C) scattering intensity
Kd dissociation constant
L-PGDS lipocalin-type prostaglandin D synthase
Mr relative molecular mass
N native state
NMR nuclear magnetic resonance NOE nuclear Overhauser effect
NOESY nuclear Overhauser effect correlated spectroscopy
P(r) intraparticle distance distribution function
PDB protein data bank
PG prostaglandin
R1 longitudinal relaxation rate
R2 transverse relaxation rate
RMSD root mean square deviation
RNase ribonuclease
Rex chemical exchange rate
Rg radius of gyration
S reciprocal vector
S2 order parameter
SAH subarachnoid hemorrhage
SAXS small-angle X-ray scattering
Tm transition temperature
TOCSY total correlation spectroscopy
Gener
L D-isome 9-hydro actively patholog somnog is abund human h (CSF), s a second such as three C Two of replacem catalytic (12) enz by L-PG Fig. G-(arrow) disulfidral Introd
Lipocalin-ty erase; EC 5 oxy and 11 y produced gical and ph gen (2) and dantly expr heart, and i seminal pla d major pro glutathione Cys residues these Cys ment of Cy c activity o zymes, indi GDS. -1. Amino ), the catalyt de bond (opeduction
ype prosta 5.3.99.2) is -keto group in a variety hysiologica a nocicepti ressed in th is secreted a asma, and p otein in the e, -mercap s, Cys65, C residues, C ys65 with S f the recom icating that acid seque tic cysteine en circles) o aglandin s the key en ps from PG y of tissues l functions; ive modulat he central n actively into lasma, resp human CSF ptoethanol, Cys89, and Cys89 and C er/Ala by s mbinant rat ( the Cys65 nce of mou residue (as of L-PGDS (PG) D nzyme resp GH2 with as a major ; for instanc tor (3) as w nervous sys o various bo pectively (1) F (7). L-P or, dithioth d Cys186, c Cys186, for site-directed (10), human residue is t use L-PGD sterisk), and are shown. synthase ponsible for 9,11-endop r prostanoid ce, PGD2 is well as an al stem of var ody fluids, ). L-PGD GDS requir hreitol for i conserved a rm a disulfi d mutagenes n, mouse, c the key resiDS. Cleava d two cystein (L-PGDS, r the forma eroxide gro d and is inv known as a lergic medi ious mamm such as the S is the sam res free sulf its reaction among all
de bridge ( sis led to co chicken (11)
idue for the
age site of t ne residues prostagla ation of PG oup (1). P volved in nu a potent end iator (4). L mals, male e cerebrospi me as -trac fhydryl com (8). L-PG species (Fi (9). Moreo omplete los ), and bull e reaction c the signal s forming an andin-H2 GD2 with PGD2 is umerous dogenous L-PGDS genitals, nal fluid ce (5, 6), mpounds, GDS has ig. G-1). over, the ss of the and frog catalyzed sequence n internal
L-PGDS is a member of the lipocalin superfamily (9). Lipocalins are small globular proteins and are defined on the basis of amino acid sequence similarity. Up until now the lipocalins are found in bacteria, plants, invertebrates and vertebrates (13), and the number of assigned lipocalin sequences has grown beyond 1,200 (14). Figure G-2 shows a representative alignment. Most lipocalins share three characteristic conserved sequence motifs, motif 1 (GxWY), motif 2 (TDYxxY), and motif 3 (R/K) (Fig. G-2), and are grouped into kernel and outlier members depending on the degree of amino acid sequence identities (15). The kernel lipocalins share all three conserved sequence motifs, whereas the outlier lipocalins only have one or two in common (Fig. G-2). As shown in Fig. G-2, the lipocalins exhibit unusually low levels of sequence identity (20%) even if they share one to three conserved sequence motifs. However, members of this family share a common fold comprising an eight-stranded antiparallel -barrel forming an internal ligand-binding cavity and an attached -helix (Fig. G-3, (16)). The lipocalins bind a small hydrophobic compound within their internal binding cavity, and play a role in the storage and transport of small hydrophobic compounds such as vitamins, steroids and secondary metabolites (15). Some members of this family also have more specialized functions, for example in olfaction (e.g. odorant-binding protein) (17), invertebrate colouration (e.g. lobster -crustacyanin, (18)), mediation of cell homeostasis (e.g. neutrophil gelatinase-associated lipocalin, (19)) and immune regulation (e.g. neutrophil gelatinase-associated lipocalin (20); complement factor 8 chain (21)). L-PGDS has also been shown to bind a large variety of hydrophobic molecules such as retinoids, heme metabolites, thyroid hormones, and gangliosides in vitro (22-25). Thus, L-PGDS is a multi-functional protein, acting as both a PGD2 synthase and an extracellular transporter for small hydrophobic compounds. However, the detailed binding mechanism and the compound recognition of L-PGDS have remained unclear due to lacks of the structural information on complexes of L-PGDS with various compounds.
Fig. G-2 A manu superfam L-PGDS epididym -crusta urinary (21); G bacteria (41); AG protein residue; and glyc 2. Multiple ual multiple mily produ S, lipocalin mal retinoi acyanin (32 protein (34 GLY, glycod al lipocalin GP, 1-acid (44). The ; magenta, p cine. The e sequence e sequence uced using n-type pros ic acid-bind 2); NGAL, 4); RBP, re elin (36); T (39); Can f d glycoprote e color cod positively-c conserved alignment alignment ClustalW2 staglandin D ding protei neutrophil etinol-bindin TLC, tear li f 1, dog dan ein (42); Bla ding reads: charged resi motifs are i of member of represen program D synthase in (30); Ap l gelatinase ng protein ipocalin (37 nder allerge a g 4, cockr red, hydro idue; green indicated by rs from lipo ntative mem (28). Non e; BLG, -po D, a-pol e-associated (35); C8 , 7); Equ c 1 en 1 (40); C roach allerg phobic resi n, hydroxyl, y yellow box ocalin fami mbers of th n-standard a -lactoglobu lipoprotein d lipocalin complemen 1, horse alle Can f 2, dog gen (43); OB idue; blue, sulfhydryl xes. ily. he lipocalin abbreviation ulin (29); E D (31); C (33); MUP nt factor 8 ergen 1 (38 g dander al BP, odorant negatively-l and amine n protein ns read: E-RABP, Crust A, P, major chain 8); BLC, llergen 2 -binding -charged e residue
M systems structur Fig. G-3 Ribbon codes 3 protein dog dan dark blu Many group s, ranging re-stability 3. Gallery o representat 3UEU), neu (MUP, 3KF nder allergen ue for helice ps have stu from simp relationship of ribbon st tion of the utrophil ge FG), bacteri n 2 (Can f 2 es and -stra died the str ple model p ps of a pr tructures o crystal stru elatinase-ass ial lipocalin 2, 3L4R). ands, respec ructural mec proteins to rotein unde of members uctures of si sociated lip n (BLC, 3M The second ctively. chanisms of o modular er different s from lipoc ix lipocalin pocalin (N MBT), 1-ac dary structur f unfolding proteins. conditions calin family ns: -lactogl GAL, 3UO cid glycopro re elements in several Understand s is fundam y. lobulin (BL O3), major otein (AGP are colored different ding the mentally LG, PDB urinary P, 3BX6), d red and
important for both theoretical and applied aspects. For example, insight into the molecular basis of protein stability can help in the construction and design of artificial proteins with special properties for biotechnological applications (26). Our group has also investigated the folding and unfolding mechanism of L-PGDS to understand the relationship between structure and stability of the lipocalins. In a previous study, differential scanning calorimetry (DSC) and circular dichroism (CD) measurements revealed that under acidic conditions (pH 4.0), the thermal unfolding of mouse C65A L-PGDS without PGDS activity is also a completely reversible process, and Iida et al. proposed a three-state unfolding between the native state (N) and the unfolded state (U) through an intermediate state (I) in which L-PGDS still maintained a significant amount of the secondary structure (27). Thus, L-PGDS is particularly interesting because it has multiple functions and a multi-state equilibrium unfolding. However, the structural information about the conformational changes and intermediate structure of L-PGDS during thermal unfolding remains to be elucidated.
In the present study, to understand the physiological relevance of L-PGDS as a transporter protein, I firstly investigated a molecular structure of mouse C65A L-PGDS complexed with biliverdin, a hydrophobic molecule, by small-angle X-ray scattering (SAXS) and multi-dimensional nuclear magnetic resonance (NMR) measurements, and characterized the binding mechanism in detail. NMR measurements revealed that the solution structure of C65A L-PGDS exhibited the typical lipocalin fold, consisting of an eight-stranded antiparallel -barrel and a long -helix. The interior of the -barrel formed a hydrophobic cavity opening to the upper end of the -barrel. Furthermore, the combination of SAXS and NMR measurements revealed that the conformation of the upper region of the -barrel changes upon binding of biliverdin and then L-PGDS becomes compact. This directly demonstrates the structural flexibility of mouse L-PGDS (Chapter 1).
Secondary, in order to understand the relationship between structure and stability, I investigated the intermediate state during the thermal unfolding process of mouse L-PGDS and clarified the local conformational changes in the upper and bottom regions by using NMR and CD spectroscopy. The NMR measurements revealed that the backbone conformation was disrupted in the upper region of the -barrel around the transition temperature value for the N I transition, but that the signals of the residues located at the bottom region of L-PGDS remained at 54 °C, where the maximum accumulation of the intermediate state was found. 1H-NMR and CD measurements showed that the conformational change in the upper region of the -barrel occurred at a lower temperature than that in the bottom region. These findings demonstrate that the backbone conformation of the bottom region is still maintained in the intermediate state. Moreover, fluorescence quenching experiments revealed that the intermediate state of C65A L-PGDS retained binding ability for biliverdin. Thus, the bottom structure of the -barrel in L-PGDS is considered to be a minimal architecture for compound binding as a transporter protein (Chapter 2).
Chapter 1
Structural analysis of mouse lipocalin-type prostaglandin D
synthase complexed with biliverdin by small-angle X-ray
1.1. Abstract
Lipocalin-type prostaglandin D synthase (L-PGDS) acts as both a PGD2 synthase and an extracellular transporter for small hydrophobic molecules. From a series of biochemical studies, it has been found that L-PGDS has an ability to bind a variety of hydrophobic compounds such as biliverdin, bilirubin and retinoids in vitro. Therefore, I considered that it is necessary to clarify the molecular structure of L-PGDS upon binding compound in order to understand the physiological relevance of L-PGDS as a transporter protein. I investigated a molecular structure of L-PGDS/biliverdin complex by small-angle X-ray scattering (SAXS) and multi-dimensional NMR measurements, and characterized the binding mechanism in detail. SAXS measurements revealed that L-PGDS has a globular shape and becomes compact by 1.3 Å in radius of gyration on binding biliverdin. NMR experiments revealed that L-PGDS possessed an eight-stranded antiparallel -barrel forming a central cavity. Upon the titration with biliverdin, some cross-peaks for residues surrounding the cavity and EF-loop and H2-helix above the -barrel shifted, and the intensity of other cross-peaks decreased with signal broadenings in 1H-15N heteronuclear single quantum coherence spectra. These results demonstrate that L-PGDS holds biliverdin within the -barrel, and the conformation of the loop regions above the -barrel changes upon binding biliverdin. Through such a conformational change, the whole molecule of L-PGDS becomes compact.
1.2. Introduction
Lipocalin-type prostaglandin D synthase (L-PGDS) was found to be a -trace protein which is secreted into cerebrospinal fluid (CSF) from the leptomeninges and arachnoid membrane (45), and is the second most abundant protein constituent in human CSF (5, 6). L-PGDS is also known as a member of the lipocalin superfamily which is composed of various secretory hydrophobic compound transporter proteins such as -lactoglobulin, retinoic acid binding protein, odorant-binding protein, apolipoprotein D, and tear lipocalin (16,
46-49). The lipocalin proteins have a highly symmetrical all- structure dominated by a
single eight-stranded antiparallel -sheet closed back on itself to form a continuously hydrogen-bonded -barrel (50, 51). This -barrel commonly encloses a ligand-binding site composed of both an internal cavity and an external loop scaffold (16). A number of biochemical studies showed a strong possibility of usage of lipocalins for storage or transport of the physiologically important hydrophobic compounds (15, 52). In the case of L-PGDS, a series of studies showed that it could bind a large variety of hydrophobic compounds, such as retinoids, biliverdin, bilirubin, thyroid hormones, and gangliosides in vitro (22-25). Thus, Inui et al. defined such a feature as ‘broad ligand selectivity’ (53). Shimamoto et al. reported the molecular structure of C89A/C186A L-PGDS, which is lacking the native disulfide bond, determined by NMR spectroscopy (54). In that study, it was revealed that C89A/C186A L-PGDS had a typical lipocalin fold, which consists of an eight-stranded antiparallel -barrel and a long -helix associated with the outer surface of the barrel, and the interior of the barrel formed a hydrophobic cavity. Recently, small-angle X-ray scattering (SAXS) measurements revealed that L-PGDS becomes compact upon binding a hydrophobic compound at pH 8.0, at which the maximum enzymatic activity is observed (55). Through this work, the structural flexibility of L-PGDS molecule was directly demonstrated and it was also suggested that such a structural flexibility was related to the broad ligand selectivity.
In terms of clinical importance, some reports have indicated that the concentration of L-PGDS in CSF is a useful clinical marker to diagnose neurological diseases. The concentration of L-PGDS increased in CSF of patients in spinal canal stenosis (56), while it was significantly lower in patients with schizophrenia (57), brain tumor (58), bacterial meningitis (56), and normal pressure hydrocephalus (59). L-PGDS was also proposed to be a diagnostic marker for N-glycosylation defects in the central nervous system (60). In addition, Inui et al. previously found that the concentration of L-PGDS in CSF increased transiently in patients with aneurysmal subarachnoid hemorrhage (SAH) in its acute stage and the L-PGDS purified from the CSF of SAH patients bound bile pigments, the metabolites of hemoglobin (61, 62). These reports suggest that L-PGDS physiologically plays an important role in CSF of patients with SAH. Therefore, I considered that in order to understand the physiological relevance of L-PGDS in CSF it is necessary to clarify the molecular structure of L-PGDS upon binding bile pigments.
Although a number of studies have been done so far, the detailed mechanism of compound binding on L-PGDS remains elusive, because of insufficient data from structural studies on the protein molecule itself. In the present study, therefore, I performed SAXS and multi-dimensional NMR measurements in order to elucidate the molecular structure and conformational changes of L-PGDS upon binding biliverdin, a hydrophobic compound. The combination of SAXS and NMR measurement is very useful not only for resolving protein structure but also characterizing conformational dynamics and changes in the size and the overall shape of proteins under solution conditions. These structural studies on the L-PGDS molecule will lead to detailed understanding for the mechanism of broad ligand selectivity as well as to predictive clinical applications of L-PGDS for SAH, especially for the improvement of prognosis. On the view point of physiological importance, biliverdin was chosen as a representative compound, because it was one of the bile pigments.
1.3. Materials and methods
1.3.1. ChemicalsThrombin and biliverdin were purchased from Sigma Chemical Co. (St. Louis, MO). All other chemicals were in the analytical grade.
1.3.2. Expression of recombinant mouse C65A L-PGDS
A mouse 1-24-C65A L-PGDS mutant, which preserves a disulfide bond between Cys89 and Cys186, was used. The mouse 1-24-C65A L-PGDS mutant, in which the N-terminal signal peptide sequence was removed, was expressed as a glutathione
S-transferase fusion protein in Escherichia coli BL21(DE3) (TOYOBO, Tokyo, Japan) as
described previously (24). The fusion protein was bound to glutathione-sepharose 4B (GE Healthcare Bio-Sciences, Little Chalfont, UK) and incubated with thrombin (Sigma Chemical Co., St. Louis, MO, USA) (100 U/100 l) to release the L-PGDS. This mutant protein possessing an intrinsic disulfide bond is more stable than the mouse C89A/C186A recombinant protein used previously (53). The recombinant protein was further purified using size-exclusion chromatography as described previously (53, 63). Then, the purified protein was dialyzed against 20 mM sodium acetate (pH 4.0). The protein concentration was determined spectroscopically by using the molar extinction coefficient at 280 nm, 280 nm = 23,000 M-1·cm-1 (64).
1.3.3. Fluorescence quenching assay
Biliverdin was dissolved in dimethyl sulfoxide to give a 2 mM stock solution. The concentrations were determined spectroscopically based on their respective molar absorption coefficients of 377 nm in methanol for biliverdin = 51,500 M-1·cm-1 (63). Various concentrations of biliverdin were added to L-PGDS, in 20 mM sodium acetate for pH 4.0 to
give a final L-PGDS concentration of 1.5 M. After incubation at 25 °C for 30 min, the intrinsic tryptophan fluorescence was measured as described previously (53).
The dissociation constant (Kd) and the molar ratio (n) for binding between biliverdin and L-PGDS were calculated by fitting to equation 1-1:
(1-1)
where P0 and L0 are the total protein and compound concentration, respectively. F represents the fluorescence intensity at a certain L0, Fmin represents the fluorescence intensity upon saturation of all the apo-protein molecules, and F0 is the initial fluorescence intensity.
1.3.4. Small-angle X-ray scattering measurements
Small-angle X-ray scattering (SAXS) data collection was carried out at BL40B2, which is a bending magnet beamline in the SPring-8 synchrotron radiation facility (Hyogo, Japan). The X-ray wavelength was tuned to 1.0 Å, the sample-to-detector distance was set to 1,050 mm, and the X-ray flux at the sample was estimated as 4×10¹⁰ photons/s. All the experiments were performed at 25 °C. Data were collected using an R-AXIS IV++ system (RIGAKU, Tokyo, Japan) as a detector (65). A sample cell with a thickness of 3.0 mm was used to maximize scattering of X-ray. The windows of the cell were made of 0.02 mm thick quartz plates. The exposure times for each measurement were from 10 s to 20 s depending on the concentration of the sample, long enough to obtain a sufficient signal-to-noise ratio and but short enough to avoid the radiation damage. In order to check for the radiation damage, I routinely compared the scattering curves with several different exposure times and confirmed that no aggregates of the protein were formed by the radiation damage in 10 s to 20 s. To avoid systematic errors, I measured sample and buffer solutions alternately. For SAXS measurements, L-PGDS was mixed with biliverdin in a 1:3 molar concentration ratio. After 1 h of stirring, in order to remove dimethyl sulfoxide and free biliverdin from the
F
(Kd L0 nP0) (Kd L0 nP0)2 4nP
0Kd (F0 Fmin)
solvent and aggregates, the mixture was applied to a PD10 column (GE Healthcare Bio-Sciences); and only the fractions containing complexes were gathered. Data were recorded for protein concentrations of 2.5 mg/ml, 5.0 mg/ml, 8.0 mg/ml, and 12.0 mg/ml. In each series of experiments, SAXS profiles of ovalbumin (Mr = 45,000, Sigma) and lysozyme (Mr = 14,300, SEIKAGAKU CORPORATION, Tokyo, Japan) were collected as a reference for molecular mass determination.
Two-dimensionally recorded scattering patterns were transformed to a one-dimensional profile by circular averaging. Contributions to scattering intensities from the solvent were eliminated from the raw data by subtracting the intensity curve obtained for the buffer solution. Scattering profiles in the small-angle region were analyzed by Guinier’s approximation for monodispersive systems (66): the scattering intensity (I(S,C)) as a function of the reciprocal vector (S) and protein concentration (C), is expressed by the forward scattering intensity (I(0,C)) and the radius of gyration (Rg(C)) as
I(S,C) I (0,C)exp 4 3 2 R g(C) 2S2 (1-2) S 2sin (1-3) where 2 is the scattering angle relative to the incident beam and is the X-ray wavelength. The reciprocal vector (S) was calibrated by meridional reflections from chicken tendon collagen. In order to eliminate interparticle interference, I made measurements at 4 different protein concentrations and then extrapolated these data points to zero protein concentration. Intraparticle distance distribution functions (P(r)), were calculated from the experimental scattering data using the GNOM package (67). The values of the maximum diameters of the particle (Dmax) were determined empirically by examining the quality of the fit to the experimental data for a range of Dmax values. Assuming a partial specific volume of 0.73 cm3/g for soluble proteins, the molecular mass of a protein is determined by using I(0,C = 0)
of a reference protein with a known molecular mass.
1.3.5. Ab initio modeling
Ab initio model structures of L-PGDS was calculated using ab initio structure
determination program GASBOR package (68) to scattering profiles weighted by S-4 to ensure Porod’s law in S < 0.015 Å-1. The programs minimized the discrepancy between the experimental Iexp(S) and calculated Imodel(S) profiles by keeping a compactly interconnected configuration of dummy particles. Discrepancies were examined with the 2 values (69, 70) defined as
2 1
N 1
Iexp(Sj) KmodelImodel(Sj) (Sj)
2
(1-4)
where N is the number of experimental datum points, Kmodel is a scaling factor, and (Sj) is the
statistical error of Iexp(Sj) at the scattering vector Sj (68). The modeling calculations were
repeated until the 2 of each model became less than 2.0. The 10 models having almost the same overall structures were superimposed and averaged with SUPCOMB (71).
1.3.6. NMR measurements and signal assignments for C65A L-PGDS
Isotopically labeled C65A L-PGDS was prepared as reported previously (53) except that Escherichia coli cells were cultured in M9 minimal medium containing 15NH4Cl (1 g/l) and/or 13C glucose (5 g/l) as sole nitrogen and carbon sources. At first, I tried to measure 1H-15N heteronuclear single quantum coherence (HSQC) spectrum of C65A L-PGDS at pH 6.5. However, most of the signals were broadened and the signals of the residues at EF-loop and H2-helix could not be assigned (Fig. 1-1A).
This mi and/or t the spec acidic p Fig. 1-1 The HS ight be due the conform ctral quality pH (Fig. 1-1 1. 1H-15N H QC spectra e to the fast mational exc y we change B). HSQC spect a of C65A L ter exchang change of EF ed the cond tra of C65A L-PGDS wer ge of amide F-loop and dition of NM A L-PGDS a re obtained e protons of H2-helix at MR measure at pH 6.5 a at 25 °C, pH f L-PGDS w t pH 6.5. I ement from and pH 4.0. H 6.5 (A) an with water In order to m a neutral p . and pH 4.0 ( (72, 73) improve pH to an (B).
The far same as seconda NMR sa mixture 5-mm m and thre spectrom and 15N WATER Transmi 4.77, 2,2-dim Fig. 1-2 C65A L -UV circula s that at pH ary structur amples wer e at pH 4.0 microcell NM ee-dimensio meter or a V N) probe a RGATE (74 itter frequen 119.0, methyl-2-sila 2. Far-UV C L-PGDS (10 ar dichroism H 6.5, indica es of C65A re prepared 0. The pro MR tube (S onal NMR Varian INO and shielde 4) were ut ncies for 1H 60.8, 4 apentane-5-CD spectra 0 M) were m (CD) spe ating that th A L-PGDS in 20 mM otein concen Shigemi Inc. experiment OVA600 spe ed z-gradien tilized in a H, 15N, 13C 43.0, and sulfonate w a of C65A L obtained at ectrum of C here is no s between pH sodium ace ntration wa ., Tokyo, Ja ts were perf ectrometer e nt. The p all H2O ex , aliphatic 1 d 110.0 was used a L-PGDS at t 25 °C, pH C65A L-PG significant s H 4.0 and p etate of D2O as adjusted apan) for all formed at 2 equipped wi pulsed-field xperiments 13C, and aro ppm, as an extern t pH 6.5 an 6.5 (dashed GDS at pH structural d pH 6.5 (Fig O or 90% H to approxi NMR expe 25 °C on a ith a triple-r d gradient for the so omatic 13C w respective nal referenc d pH 4.0. d line) and p 4.0 was alm difference in g. 1-2). T H2O/10% D imately 0.5 eriments. Varian INO -resonance ( techniques olvent supp were typical ely. ce of 1H c The CD sp pH 4.0 (soli most the n overall Then, the D2O (v/v) mM in All two- OVA500 (1H, 13C, with a pression. lly set to Sodium chemical pectra of id line).
shifts. 15N and 13C chemical shifts were indirectly calibrated from each gyromagnetic ratio (75). For backbone and side-chain assignments of C65A L-PGDS, 2D 1H-15N HSQC, 2D 13C-1H HSQC, 2D 13C-1H (HB)CB(CGCD)HD (76), 3D HNCACB, 3D CBCA(CO)NH, 3D HBHA(CBCACO)NH, and 3D HCCH-TOCSY (77, 78) spectra were recorded. NMR distance restraints were derived from 3D 15N-edited NOESY (100 ms mixing time) and 3D 13C-edited NOESY (100 ms mixing time) experiments (77, 78), as well as from the 2D NOESY (100 ms mixing time) experiment acquired. All the NMR spectra were processed and analyzed using NMRPipe (79) and Sparky (Goddard, T.D., and Kneller, D.G., SPARKY 3, University of California, San Francisco).
1.3.7. Structure calculation
Nuclear Overhauser effect (NOE) restrains were classified into four categories: strong, medium, weak, and very weak corresponding to the distance restraints of 1.8-2.8 Å, 1.8-3.4 Å, 1.8-4.2 Å, and 1.8-5.0 Å, respectively. A total of 1479 NOE restraints were employed for this structure calculation, including 492 intraresidues, 481 sequential, and 181 medium-range (i-i+2, i-i+3, i-i+4) and 325 long-range restraints. In addition, the 202 and torsion angle restraints were evaluated from backbone chemical shifts of 15N, H , 13C , and 13C using the program TALOS (80). The structure calculation was performed with a simulated annealing algorithm in the program CNS 1.2 (81). Finally, the structural ensemble comprised 10 lowest energy structures were selected and analyzed by using the programs MOLMOL (82) and PROCHECK 3.54 (83). Graphical representations were prepared using PyMOL (84). Chemical shift assignments and distance constraints for the free form of L-PGDS have been deposited in the Biological Magnetic Resonance Data Bank (http://www.bmrb.wisc.edu) with an accession number 11062. Atomic coordinates and structure factors for solution structure of L-PGDS possessing an intrinsic disulfide bond have been deposited in the Protein Data Bank (http://www.rcsb.org) with PDB code 2RQ0.
1.3.8. Electrostatic potential calculation
Electrostatic calculation was done in PyMOL (84), using the Adaptive Poisson-Boltzmann Solver plug-in (85). The calculation was performed at 310 K, using a 150 mM NaCl environment with protein and solvent dielectric constants of 2.0 and 78.0, respectively.
1.3.9. Measurements of chemical shift perturbations upon binding of biliverdin
Titration with biliverdin was monitored by an NMR titration of 15N-labeled L-PGDS with unlabeled biliverdin using 1H-15N HSQC experiments. Biliverdin was added to 0.5 mM L-PGDS to a final concentration of 0.3 mM. The composite chemical shift differences ( tot were calculated as
tot ( HN WHN) 2 (
N WN) 2 1/2
(1-5) where HN and N are the chemical shift changes of 1H and 15N, respectively. The weighting factors used were WHN = 1 and WN = 0.2.
1.3.10. Relaxation measurements
The 15N relaxation measurements of 0.5 mM L-PGDS with or without 0.3 mM biliverdin were carried out at 25 °C and pH 4.0 on a Varian INOVA600 spectrometer, using the pulse schemes described by Kay et al (86). Longitudinal (R1) and transverse relaxation rate (R2) values were obtained by fitting peak intensities of each peak against mixing time using a single exponential curve. The fittings were performed using Sparky (Goddard, T.D., and Kneller, D.G., SPARKY 3, University of California, San Francisco), and the error values were obtained from the fitting error. The steady-state 1H-15N NOE were measured from the ratios of peak intensities in the saturated spectrum to those in the unsaturated spectrum.
Errors of 1H-15N NOE for each peak intensities were estimated from the single deviations of the background noise intensities sampled from a part of the same spectra, in which no peak exists. Order parameters (S2), chemical exchange rates (R
ex), and internal correlation time ( e) were calculated for each residue by applying the R1, R2, 1H-15N NOE, and their errors to the Modelfree package (87). The spectral density functions were considered to be appropriate if they satisfied a condition: all three relaxation parameters must be fit within 90% confidence limits.
1.4. R
1.4.1. B A fluoresc concent position of L-PG a conce decrease From th 72 nM exhibite Fig. 1-3 The con C65A L are expr structurResults
Binding affin At first, to cence quen trations of b ns 43 and 54 GDS by the entration-de ed to less t he quenchin with a bi ed a high bin 3. Fluoresce ncentration L-PGDS in ressed as th re and molec nity of bilive investigate nching of biliverdin at 4, and both binding of ependent m than 10% o ng curve, the inding stoi nding affini ence quenc of protein w the presenc he mean ± S cular mass o erdin for C6 the bindin intrinsic t pH 4.0. M tryptophan compound anner with of that of L e Kd value o chiometry ity for biliveching of try was adjusted ce of variou S.D. of 3 ind of biliverdin 65A L-PGD ng affinity o tryptophan Mouse L-PG n residues co (53). L-P biliverdin L-PGDS its of biliverdin of 1:1. T erdin under yptophan re d to 1.5 M us concentr dependent m n. DS of biliverdin residues GDS contai ontributed t PGDS show (Fig. 1-3). self in the p n for L-PGD This result r an acidic c esidues by b M. The rela ations of bi measuremen n to L-PGD of L-PGD ins two tryp to the fluore wed fluoresc The fluo presence of DS was calc demonstra condition. binding of ative fluores iliverdin we nts. Inset DS, I measu DS with ptophan resi escence que cence quenc orescence in f 5 M bili culated to b ates that L biliverdin. scence inten ere obtained shows the c ured the various idues at enching ching in ntensity iverdin. e 590 ± L-PGDS . nsities of d. Data chemical
1.4.2. SA overall particul takes pl central small m The sca presenc changes analyzin Fig. 1-4 L-PGDS obtained the zero reciproc AXS analys SAXS is a shape, an arly useful lace (66). peak at a r maximum at attering inte e or absen s in the scat ng scatterin 4. SAXS pr S (black lin d by extrap o concentra cal vector (S sis a powerful d compact for studyin The scatter reciprocal v S = 0.078 Å ensity curv nce of biliv ttering curv ng curves v rofiles of L ne) and L-P polating of a ation. The S). Inset s technique tness of m ng systems ring curves vector (S) < Å-1 (Fig. 1-4 ves revealed verdin. Th ve in the sm very careful L-PGDS an PGDS/biliv all data at d e logarithm hows the lo for directly molecules u in which a of L-PGDS < 0.033 Å-1, 4). d that L-PG he binding mall-angle re lly, a small nd L-PGDS verdin (gree different co m of scatter ogarithm of y obtaining under soluti a structural S and L-PG , a second GDS had a of biliverd egion (S < 0 l but signif S/biliverdin en line) are oncentration ring intensi scattering i and chara ion conditi l or a confo GDS/biliverd peak at S = a globular s din to L-PG 0.02 Å-1, Fi ficant peak n complex. shown. T ns (12, 8, 5, ty is show ntensity in t acterizing th ions, and formational din showed = 0.044 Å-1 shape both GDS cause ig. 1-4 inse shift towa SAXS pr These profi , and 2.5 m wn as a fun the small S he size, thus is change a large 1, and a h in the ed clear t). By ards the rofiles of les were mg/ml) to nction of region.
higher S peak (S become the nor intercep the scat and the concent upward mono-d The Gu Fig. 1-5 and I(0, 1.3) of vector l and 12.0 S region wa S = 0.078 Å e compact a rmalized fo pt, respectiv ttering data e slope of t trations of curvature dispersed wi uinier plot o 5. Guinier p ,C) were de the scatteri length of L-0 mg/ml ( as found for Å-1, Fig. 1-after binding rward scatt vely, of the showed a l this plot pr L-PGDS (F even at th ithout aggre of the SAXS plots at var etermined b ing profiles -PGDS at c ) are shown the second 4). All su g the compo tering inten linear regre inear correl rovided Rg Fig. 1-5) sh he low S2 egation even S data obtai rious conce by the Guin s. Logarith concentratio n. They ha peak (S = 0 uch change ound. The nsity (I(0,C ession lines lation betwe of the mo howed a li region, in n at the high ined from L entrations o nier approxi hms of inte ons of 2.5 m ave been sh 0.044 Å-1, F s imply tha e apparent r C)) were ca s in the Gui een ln (I(S) olecules. T near regres ndicating th hest concen L-PGDS/bil of C65A L-imation fro ensities plot mg/ml ( ), 5 hifted along Fig. 1-4), an at the L-PG radius of gy alculated fro inier plot. /C) and S2 a The Guinier ssion line w hat the sam
tration (12.0 liverdin com -PGDS. T m the low tted against 5.0 mg/ml ( the ordinate nd also for th GDS molec yration (Rg(C om the slo A Guinier at low valu er plot at d without sign mple solutio 0 mg/ml). mplex also s The values o S regions ( t squared s ( ), 8.0 mg e for clarity he third ule has C)) and ope and plot of es of S, different nificant on was showed of the Rg (2 SRg < cattering g/ml ( ), y.
the sam I(0,C)/C the valu concent virial c L-PGDS Fig. 1-6 Concen L-PGDS indepen me feature a C values we ues obtaine tration-depe coefficient, S molecules 6. Example ntration dep S/biliverdin ndent experi as that of L ere plotted ed from L-P endency. T and the n s. s of analysi pendence o n (green lin iments. L-PGDS (d as a functio PGDS and The slope o negative slo is of data o of Rg2 (A) ne) is show
data not sho on of the pr L-PGDS/b of the plot ope indicat obtained fro and I(0,C wn. Data own). Wh rotein conc biliverdin sh (Fig. 1-6A ted the rep
om SAXS e
C)/C (B) o
are express
hen the calc entration (F howed a lin A) correspon pulsive inte experiment of L-PGDS sed as the culated Rg( Figs. 1-6A inear and n nds to the eractions b ts. S (black li mean ± S C)2and and B), negative second between ine) and .D. of 3
From the linear extrapolations of Rg(C)2 to infinite dilution, which eliminated interparticle interferences, Rg(0) values of L-PGDS and L-PGDS/biliverdin were evaluated to be 19.2 ± 0.26 and 17.9 ± 0.20 Å, respectively (Table 1-1). Thus, L-PGDS became compact by approximately 1.3 Å in radius after binding biliverdin. The molecular masses of L-PGDS and L-PGDS/biliverdin were estimated to be 2.0×10⁴ and 2.1×10⁴ Da, respectively, by the linear relation between the forward scattering intensity and the molecular mass of the protein (Table 1-1). The estimated molecular mass of L-PGDS was in good agreement with that of L-PGDS calculated from its amino acid sequence (1.9×10⁴ Da). The estimated molecular mass of L-PGDS/biliverdin was larger than that of L-PGDS due to the binding of biliverdin (Mr = 582.6). The slope of the concentration-dependent curves of
Rg(C)2 and I(0,C)/C was slightly different for each sample. These results indicated that interparticle interferences in solution were different between the presence and absence of biliverdin.
The intraparticle distance distribution functions, P(r) were calculated as the inverse Fourier transform of the scattering curves of L-PGDS and L-PGDS/biliverdin (Fig. 1-7). The profiles of P(r) of L-PGDS showed a single peak at 23 Å and were very similar in the presence and absence of biliverdin. The P(r) functions indicate that L-PGDS remains essentially globular after binding biliverdin. The calculated maximum diameters (Dmax) for
Kd for biliverdin (nM) Rg (0) (Å) I(0,0) Molecular mass (Da) L-PGDS - 19.2 ± 0.26 59.5 ± 2.00 2.0 × 10⁴ L-PGDS/biliverdin 590 ± 72 17.9 ± 0.20 63.8 ± 0.56 2.1 × 10⁴
Table 1-1. Binding affinity of L-PGDS for biliverdin, and changes in Rg and molecular mass of L-PGDS induced by binding of biliverdin
the L-P towards other d GASBO filtered initio m molecul was sm biliverd L-PGDS next me Fig. 1-7 L-PGD are sho shows a model w PGDS/bilive s compactio data. Ab in OR package and averag models of L le was glob maller than t din binding S/biliverdin easured the 7. Distance DS/biliverdi own. The ab initio mo was calculat erdin were on of L-PGD nitio model e (68). Th ged (DAMA L-PGDS an bular in sha that of L-PG revealed b n complex, multi-dimen e distribut in. The P( curves wer odels of L-ted from a P slightly s DS upon bil ls of L-PG he models AVER (88) d L-PGDS/ ape and tha GDS (Fig. by SAXS p and also th nsional NM ion functio (r) of L-PG re calculate PGDS (bla P(r) functio maller than liverdin bin GDS and L resulting f )) to obtain /biliverdin at the L-PG 1-7 inset). prompted m he binding m MR of L-PG ons (P(r)) GDS (black ed from the ack) and L-P on by using n that for nding was co L-PGDS/bili from 10 ind n the most showed tha GDS molecu The comp me to eluci mode of bi DS and L-P and ab ini line) and L e SAXS pr PGDS/biliv GASBOR p L-PGDS. onsistent wi iverdin wer dividual GA likely mol at the over ule complex pact packing date detaile liverdin to PGDS/bilive itio models L-PGDS/bil rofiles of e verdin (gree program. Such a t ith tendenci re calculate ASBOR ru lecular mod rall structur xed with b ng of L-PGD ed structure L-PGDS. erdin compl s of L-PGD liverdin (gre each protein en). Each tendency ies in all ed using uns were del. Ab re of the iliverdin DS upon e of the Thus, I lexes. DS, and een line) n. Inset ab initio
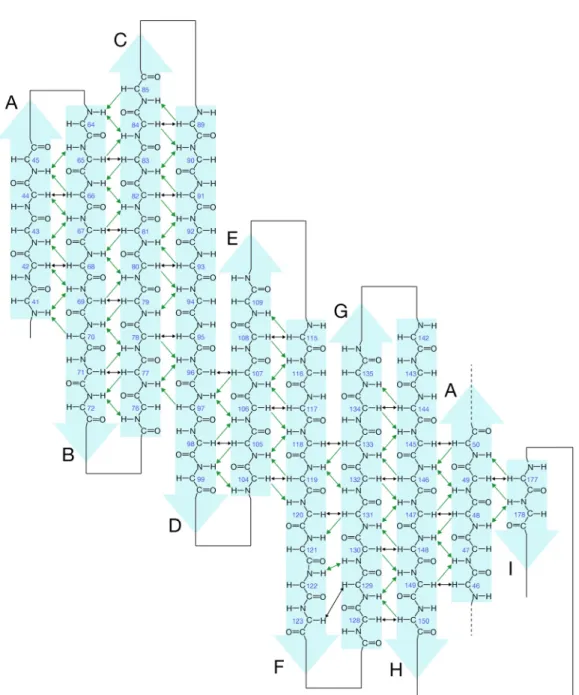
1.4.3. N T achieve 4.0 (Su recorded In this s well-fol (89) wa chemica of C65A Fig. 1-8 Backbo resonan NMR solutio Through a d for backb upplementar d on the 15N spectrum m lded at pH 4 as used to al shifts. T A L-PGDS ( 8. 1H-15N H ne amides nces are con
on structure series of N bone and si ry Table S N-labeled C most of the c 4.0. After evaluate C The consens (Fig. 1-9). HSQC spect and Trp nnected by s of C65A L-NMR expe ide-chain 1H 1). Figure 65A L-PGD cross-peaks sequential C65A L-PG sus CSI valu trum of C65 indole HN olid lines. -PGDS eriments, al H, 13C, and e 1-8 show DS. are well-di assignment GDS second ues were pl 5A L-PGD N groups ( lmost comp 15N resona ws the assig ispersed, ind ts, the chem dary structu lotted as a f S at 25 °C ( NH) are plete signal ances of C6 gned 1H-15N dicating tha mical shift in ure from 1H function of a and pH 4.0 labeled. l assignmen 65A L-PGD N HSQC s at C65A L-P ndex (CSI) H , 13C a amino acid 0. Amide sid nts were DS at pH spectrum PGDS is program and 13C residues de-chain
As show supporte observe that C6 and d N of two h from res Fig. 1-9 chemic -strand wn in Fig. ed by the ed for the pr 65A L-PGD N(i,i+4) NOE helices. T sidues 35 to 9. Secondar al shift in d secondary 1-9, eight analysis of redicted -s DS possesse Es were obs The d N(i,i+2 o 40. This ry structur ndex (CSI) y structures -strands an f backbone structures in s an antipa served in th 2), d N(i,i+3 result sugg re predictio ) program. are named nd two -he NOEs. F n C65A L-P aralled -ba he predicted 3) and dNN( gests that thi
on for C65A . The reg and , res elices were Figure 1-10 PGDS. Th arrel (Fig. 1 d -helix re (i,i+2) NOE is region as A L-PGDS gions ident spectively. predicted. shows the hese interstr 1-10). Fur gions, sugg Es were obs sumes 310-h S as obtaine tified to ad This pred e interstran trand NOEs rther, the d gesting the p served in th helix. ed from co dopt -heli diction is d NOEs s suggest d N(i,i+3) presence he region onsensus ical and
Fig. 1-1 Black a arrows proton N 10. Schema arrows indic indicate int NOEs, respe atic drawing cate interst terstrand H ectively. g of antipa rand H -H to amide rallel -str H NOEs. proton NO ructures in Green arro Es and inte C65A L-PG ows and gr rstrand ami GDS. reen double ide proton t e-headed to amide
T was de structur restraint sequent addition the CNS 1-2. T superim no torsi Fig. 1-1 The seq NOEs, connect The solutio termined b re calculatio ts were em tial, and 181 n, the 202 d S program, The final stru mposed in Fi
on angle res 11. Summa quential NO
d N(i,i+2), ting the two
on structure by means o on of C65A mployed fo 1 medium-r dihedral ang 5,000 struc uctural ense ig. 1-12. T straint viola ary of sho OEs, d N(i,i+ d N(i,i+3), o residues be of C65A L of simulate L-PGDS a or this stru range (i-i+2 gle restraint ctures were emble comp These had n ations above rt sequent +1) and dNN , d N(i,i+4) etween whi L-PGDS, wh ed annealin are summari ucture calcu 2, i-i+3 and ts were obt calculated. prised 10 str no distance e 5 ˚. tial and m N(i,i+1) are r ), d (i,i+3) ch an NOE hich possess ng. The d ized in Tabl ulation, inc i-i+4) and ained from . Structura ructures of restraint vio edium-ran represented ) and dNN( was observ ses an intrin detailed rest le 1-2. A t cluding 492 325 long-ra the TALOS al statistics the lowest t olations gre ge NOEs i by lines. i,i+2) are ved. nsic disulfid straint data total of 1,4 2 intraresid ange restrai S program. are shown total energy eater than 0 in helical The mediu indicated b de bond, for the 79 NOE due, 481 ints. In Using in Table y that are .5 Å and regions. um-range by lines
Fig. 1-energy. -strand 12. Final . The sec ds, respectiv No. of restraints NOE distan Intrare Seque Mediu Long Dihedral an Deviations from Bonds (Å) Angle (º) Impropers ( Mean coordinat Overall stru Backb All he Secondary e Backb All he Ramachandran p Residues in Most Addit Gener Residues in a Calculated from Table 1-2 structural ondary stru vely. s nce restraints esidue ential um range range ngle restraints m idealized covalen (º) te RMSD from mea ucture (residue 30-1 bone heavy atoms eavy atoms elements bone heavy atoms eavy atoms
plot analysis (%) n most favored regio
favored regions tionally allowed reg rously allowed regi n disallowed region m the final structur
2. Data colle ensemble ucture elem nt geometry an structurea (Å) 189) ons gions ions s ral ensemble (10 str ection and comprised ments are c 0.00 0.37 0.29 1 1 0 1 ructures) refinemen d 10 struc colored in r 1479 492 481 181 325 202 034 ± 0.0000 784 ± 0.0026 937 ± 0.0050 .19 ± 0.14 .88 ± 0.13 .48 ± 0.08 .10 ± 0.08 99.2 83.9 12.8 2.6 0.8 t statistics ctures with red and blu
h the lowe ue for heli
est total ices and
The sup well con at the C value w 0.13 Å The ave heavy a 105-107 calculat Ramach Fig. 1-1 shows t and cro residues indicate perposition nverged, ex C terminus was 1.19 ± 0 for those w erage RMSD atoms in the 7, 117-121, ted structure handran plo 13. Ramach the backbon oss symbol s are indicat e additional of the back xcept for the
(Fig. 1-12 0.14 Å for t with all hea D values fo e regular sec , 129-133, es in terms ts for the en handran pl ne and s correspon ted by squa allowed reg kbone atom e first eight 2). The ov the mean str avy atoms i or backbone condary stru 144-149, 1 of the backb nsemble of lot of the c angle distr nd to proli re. A, B, a gions; ~a, ~ ms clearly s residues at verall avera ructure with including si e heavy ato ucture elem 158-167) w kbone and 10 structure calculated s ribution of ine and gly
and L indic ~b, ~l, and ~ shows that the N term age root me h backbone ide-chains o oms was 0.4 ents (residu was 1.10 ± d angle di es (Fig. 1-13 structures the 10 struc ycine resid
ate the mos ~p indicate g
the calculat inus and the ean square heavy atom of L-PGDS 48 ± 0.08 Å ues 41-48, 6 0.08 Å. stribution is 3). of C65A L ctures of L-ues, respec st favored re generously ated structur e last three deviation ( ms only, an S (residues Å, and thos 65-70, 76-83 The quality s represente L-PGDS. T -PGDS. T ctively. Th egions; a, b, allowed reg res were residues (RMSD) d 1.88 ± 30-189). se for all 3, 90-97, y of the ed by the The plot Triangles he other , l, and p gions.
The Ramachandran plots indicate that 83.9% of the non-glycine and non-proline residues were found in the most favored regions, 12.8% were found in the additional allowed regions, and 2.6% were found in the generously allowed regions (Fig. 1-13, Table 1-2). Several residues at the N terminus are found around the border of the disallowed region probably due to the lack of experimental information of the angle values (90).
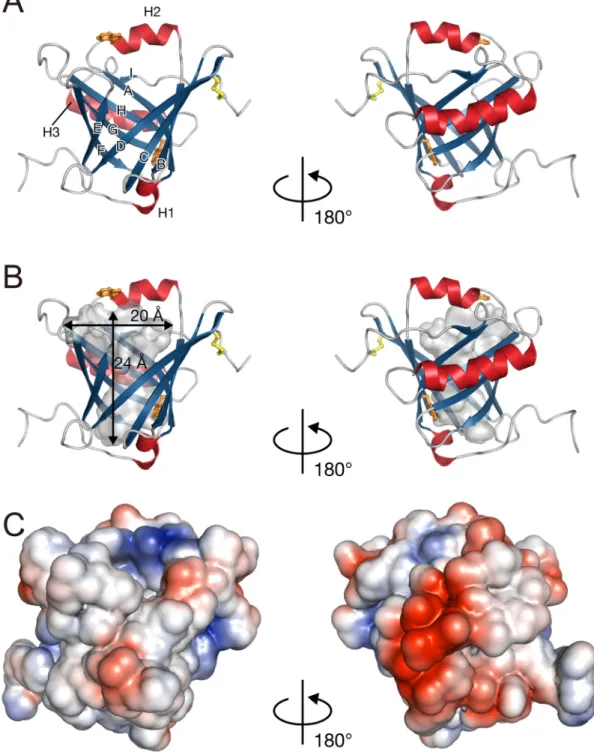
A ribbon diagram of a representative lowest energy NMR structure of L-PGDS is shown in Fig. 1-14A. Secondary structural elements of L-PGDS were comprised of nine -strands (A, residues 41-50; B, 64-71; C, 77-84; D, 89-98; E, 104-109; F, 114-123; G, 128-135; H, 143-150; I, 177-178) plus a short 310-helix (H1, 35-40) and two -helices (H2, 53-60; H3, 156-171) (Fig. 1-14A). L-PGDS possessed an eight-stranded antiparallel -barrel which formed a central cavity at pH 4.0 (Fig. 1-14B). The cavity opens to one end of the -barrel, where a short helix and three loops, CD-loop, EF-loop, and GH-loop, connect neighboring -strands in a pairwise fashion. All these structural features are typical and well conserved for the lipocalin superfamily, and the same is true for L-PGDS. The electrostatic potentials were calculated using the Adaptive Poisson-Boltzmann Solver program (Fig. 1-14C). The polar and charged residues were found on the outer molecular surface of C65A L-PGDS.
L-PGDS has three cysteine residues, Cys65, Cys89, and Cys186, and two of these cysteine residues, Cys89 and Cys186, form a disulfide bridge, which is also highly conserved among most lipocalins. The Trp43 residue is located at the bottom of the hydrophobic cavity, whereas the Trp54 residue is located in the H2-helix. Shimamoto et al. previously reported that the molecular structure of C89A/C186A L-PGDS determined by NMR exhibited the typical lipocalin fold at pH 6.5 and showed that C89A/C186A L-PGDS possessed a short 310-helix (residues 56-60) between the A and B strands (54). In the present study, however, a full turn of -helix was exhibited in C65A L-PGDS at the residues of 53-60 (Fig. 1-15).
Fig. 1-1 typical orange, for helic surface wide an L-PGDS 14. Solution lipocalin fo respectivel ces and -st of the cavi nd is bifur S. The m n structure old of L-PG ly. The se trands, resp ity is shown rcated with molecular is e of C65A GDS with d condary str pectively. n in gray. h 2 pocket shown in L-PGDS. disulfide bo ructure elem (B) Illustra The bindi ts. (C) S the same (A) Ribbo ond in yello ments are lab
tion of L-PG ng pocket i urface cha orientations on represen ow and tryp beled and c GDS cavity is about 24 rge represe s as in (A) ntation show ptophan res colored red a y. Inner ac 4 Å deep, an entations o ). The reg wing the sidues in and blue ccessible nd 20 Å of C65A gions of
I think i 15N res L-PGDS L-PGDS structur differen proteins structur structur structur C89A/C L-PGDS Fig.1-15 The H2 in red a and are it demonstra onances fo S. Further S to investi re was obtai nce of back s (residues re of C65A ral similarit re of L-PG C186A L-PG S. 5. Structur -helices of and orange, superimpos
ates that the or C65A L-r, I compar igate the im ined by aver kbone RMS 30-186) w L-PGDS w ty suggeste GDS. In o GDS was ve ral compari C65A L-PG respectivel sable for 52 e signal assi -PGDS wer red the stru mportance of raging coor SD for the was 1.054 ± was very si d that the other word ery similar ison of C65 GDS and C8 ly. The tw 2 C positio ignments of re done m ucture of C f an intrinsi rdinates of f e overall st ± 0.002 Å imilar to th intrinsic d ds, it was to that of w 5A L-PGDS 89A/C186A wo structure ons in the -f the backbo much better 65A L-PGD ic disulfide final 10 stru tructure of Å. This res hat of C89A disulfide bo suggested wild-type L-S with C89A A L-PGDS ( es are presen -barrel (sho
one and side than those DS with tha bond (Fig. uctures for b mean struc sult reveale A/C186A L nd did not that the o PGDS as w A/C186A L PDB ID co nted as the wn in blue) e-chain 1H, e for C89A at of C89A . 1-15). Th both protein ucture betw ed that the L-PGDS and t affect the overall stru well as that o L-PGDS. ode 2E4J) ar trace of C ). 13C, and A/C186A A/C186A he mean ns. The een two e overall d such a e overall cture of of C65A re shown atoms,
1.4.4. C I with bil was fix HSQC concent peaks d To allow in the c 1-17 pre backbon displaye Fig. 1-1 biliverd mM; red Chemical shi In order to liverdin usin xed at 0.5 m spectra w tration of b ecreased wi w quantifica complex wi esents the m ne amide p ed along the 16. Overlay din concent d, 0.3 mM b ift perturba investigate ng two-dim mM, and th were record iliverdin in ith signal br ation of the ith 0.3 mM magnitude o protons and e primary se y of 1H-15N trations. biliverdin. tions of L-P the biliverd ensional 1H hat of biliv ded at the ncreased, so roadening (F observed c M biliverdin of the comp d nitrogen equence. W N HSQC sp The color c PGDS induc din interacti H-15N HSQC verdin was respective ome cross-p Fig. 1-16). chemical sh n were assig posite 1H an atoms caus With 0.3 mM pectra of 0 coding reads ced by bindi ion sites of C spectra. varied from e concentra peaks shifte hift changes gned (Supp nd 15N chem sed by the M biliverdin 0.5 mM C6 s: black, 0 m ing of bilive L-PGDS, I The concen m 0 to 0.3 ation of bi d and inten , backbone lementary T mical shift p binding o n, 16 percen 65A L-PGD mM; blue, 0 erdin I monitored ntration of L mM. The iliverdin. nsity of som signals of L Table S2). perturbation of biliverdin nt of the sig DS with a s 0.05 mM; g titration L-PGDS e 1H-15N As the me other L-PGDS Figure ns of the n. It is gnals (26 series of reen, 0.2
of 167 c The ma revealed (Fig. 1 environ binds w disappe were su orange) contacts Fig. 1-1 backbo perturba changes disappe cross-peaks apping of th d that they -18A, resid nment of th within the ared on the urrounding . From th s with a rath 17. Chemic one amide ations ( to s ( tot 0 ared upon b ) showed ch hese residue were locate dues colore hese residue -barrel of e 1H-15N HS the cavity hese results her broad ar cal shift pe groups o ot) versus t 0.10 ppm) binding of b hemical shif s ( tot > 0. ed in the C ed in blue es altered u f L-PGDS. SQC spectru or located , it was co rea of the in erturbation of L-PGDS he amino a are represe biliverdin (0 ft perturbati .10 ppm) on C, D, E, F, G e). These upon bindin Further, um (Figs. 1 d in the H2 oncluded th nner side of ns induced S. The c acid sequen ented by bl 0.3 mM) are ions larger t n the soluti G, and H s signal per ng of bilive 20 percen -16 and 1-1 2-helix (Fig hat a bound the L-PGD d by bindin composite nce. The lue bar. T e represente than 0.10 pp on structure trands, EF-rturbations erdin, show t of the si 17), and the g. 1-18A, r d biliverdin S molecule ng of bilive 1H and 1 residues w The residue d by orange pm (Fig. 1-e of C65A L -loop, and H indicated wing that b ignals (33 ese missing residues co n was held e. erdin obse 5N chemic with relative es with sign e boxes. 17). L-PGDS H2-helix that the iliverdin of 167) residues olored in through rved on cal shift ely large nals that
1.4.5. R T relaxatio each re resonan analysis Fig. 1-1 (A) Ma presenc large ch binding views o perturba acid (54 residues Relaxation a To investig on paramet sidue at a nces and tho
s. The ave 18. Interact apping of N e of 0.3 mM hanges in c g of biliverd of the solut ation on C8 4). The pr s with relati analysis gate the d ers (15N-R1 field streng ose with ver erage values tions of L-P NMR signa M biliverdin chemical sh din, respectiv tion structu 89A/C186A otein and th ively large c dynamics o , 15N-R2 and gth of 600 ry poor sign s of the R1, PGDS and al perturbat n. Blue an ift ( tot vely. In th ures of L-P L-PGDS b he compoun changes in c of C65A L d 15N-heter MHz, pH nal-to-noise R2 and het biliverdin. tion on C6 nd orange sh 0.10 ppm) he panels, le PGDS, resp ackbone str nd were com chemical sh L-PGDS an ronuclear N 4.0 and 25 e ratios were teronuclear 65A L-PGD
how the bac and those eft and righ pectively. ructure by th mbined at a hift ( tot nd L-PGDS OE values) °C (Fig. 1 e excluded NOEs were DS backbon ckbone resid with signa ht images ar (B) Mappin he binding molar ratio 0.08 ppm) a S/biliverdin ) were meas 1-19). Ov from the re e 1.2 s-1, 12 ne structure dues with re al disappear re the front ng of NMR of all-trans of 1:1. B are colored n, NMR sured for erlapped elaxation 2 s-1, and e in the elatively red upon and side R signal s retinoic ackbone in blue.
0.66 for the som distribu (Fig. 1-and the suggesti Fig. 1-1 Plots as MHz, t correlat (green c residues r C65A L-P me residues utions of tho -19). For t e heteronuc
ing that the
19. NMR R s a function together w tion time ( e circles) of s are indicat PGDS, resp for L-PGDS ose paramet the N-termi clear NOE backbone a Relaxation p of residue ith order p e) were calc biliverdin. ted above th pectively. A S/biliverdin ters for oth inal residue E much mo at the N-term parameters number of parameter ( culated from The posit he plots and Although th n could not her residues es the value ore negativ minal regio s of C65A L 15N R 1, R2, (S2), excha m the data in tion of the d by grey bo he the R1, R be obtained were very es of R1 and ve than th n is highly L-PGDS an and 1H-15N ange terms n the absen secondary oxes, respec R2 and hete d due to sig similar to d R2 were si hose of int flexible (Fig nd L-PGDS N NOE valu (Rex), and ce (black ci structures ctively. eronuclear N gnal broaden those for fr ignificantly tervening r g. 1-19). S/biliverdin ues measure d effective ircles) and and the un NOEs of ning, the ree form y smaller residues, n. ed at 600 internal presence nassigned
Then, R1, R2 and heteronuclear NOEs data were analyzed by Modelfree package (87). The order parameters (S2) and internal correlation times ( e) characterize the amplitude and frequency of local motions on fast (picoseconds to nanoseconds) timescales, respectively. The chemical exchange rate (Rex) identifies the conformational flexibility on slower (microseconds to milliseconds) timescales. The estimated S2, Rex and e values are shown in Fig. 1-19. The globally optimized overall rotation time of C65A L-PGDS was 8.1 ns. The
S2 values for most of the residues in C65A L-PGDS with or without biliverdin were between 0.75 and 0.90, and showed little correlation with secondary structure (Fig. 1-19). The S2 value of G100 (S2 = 0.50) was lower than those of other residues, suggesting the presence of internal motion (picoseconds to nanoseconds timescale). The S2, Rex, and e distributions calculated for L-PGDS/biliverdin were very similar to those for free form, indicating that internal motions of L-PGDS are not changed by the binding of biliverdin. Moreover, the largest Rex was observed at A60, indicating conformational exchange on a time scale of microseconds to milliseconds for the C-terminal region of H2-helix of L-PGDS (Fig. 1-19).
1.5. D
I biliverd molecul good a CRYSO The com The NM broad ar 1-18A). the resid a time s helix b solution Fig. 1-2 line) w Evaluat made wDiscussio
In this stud din to C65A le possesses agreement ( OL (91) (Fi mpactness w MR analysi rea of the . On the o dues locate scale of mi y 15N rela n (Fig. 1-19) 20. Superim with the c tions of the with CRYSOn
dy, the fluor A L-PGDS s a globular ( =2.7) wi
g. 1-20). was also cle
s showed t -barrel, the other hand, i d in H2-hel croseconds xation mea ). mposition alculated quality of th OL version 2 rescence qu S (Kd = 59 r shape and ith the SA After bindi arly sugges the changes e EF-loop a in the absen lix on 1H-15 to millisec asurements, of the SAX curve from he fit of the 2.6 (91). uenching as 90 nM). T d the experi AXS profile ing biliverd sted in the a s in the che and the H2-nce of bilive 5N HSQC s conds was o , indicating XS scatter m the NM e scattering ssay reveale The SAXS imental SA e calculated din, L-PGD ab initio mo emical shif helix upon erdin broad pectrum an observed fo g that H2-h ing curve MR struct data to the ed the high data reve AXS profile d from NM DS molecule del structur ft and signa the binding cross-peaks nd conforma or the C-term helix is ori obtained o ure of L-various stru binding af ealed that L of L-PGDS MR structu e became c res using GA al broadenin g of biliverd s were obse ational exch minal regio iginally fle on L-PGDS -PGDS (re uctural mod ffinity of L-PGDS S is in a ure with compact. ASBOR. ngs in a din (Fig. erved for hange on on of the exible in S (black ed line). dels were
C on the L-PGDS binding the com in the m keeping family p bovine especial suggesti conform conform flexibili compou selectiv Fig. 1-2 upon b large ca the edg Combining EF-loop an S after bin mechanism mpound bind molecule, s g the global proteins rep -lactoglob lly the D st ing that th mations of mational cha ity is consi und, but also vity’. 21. Concep binding of avity of the e of the -b these resul nd the H2 nding bilive m of the hy ds to L-PGD such as in t l -barrel s ported conf bulin, NMR trand and th he -barre the bound anges in the dered to le o to the abi ptual illustr a hydroph -barrel via barrel lean lts, it is con -helix caus erdin. Con drophobic c DS by hydro the EF-loop structure un formational R spectrosco he EF- and l entrance d palmitic e loop region ead not only ility to bind ration of c hobic comp a hydropho and the L-P nsidered tha sing a com nsidering a compound t ophobic inte p and the H nchanged. changes du opy revealed d GH-loops, can chan acid (92). ns above th y to a prop d a variety o conformati pound. A obic interact PGDS mol at the confor mpact packin
all these lin to L-PGDS eractions, an H2-helix, in So far, on ue to comp d that the e , fluctuate u nge its con This rep he -barrel o per interacti of compoun onal chang small hydr tions, then t ecule becom rmational c ng in the nes of evid S (Fig. 1-21 nd then som nduce a com nly a few s ound bindin ntrance reg upon bindin nformation port suppor of L-PGDS. ion between nds, the so-c ges of the L rophobic co the loops w mes compac changes are entire mole dence, I pr ): at the ini me local mo mpact pack studies on l ng. In the gion of the ng of palmi to allow rts our res . Such a s n L-PGDS called ‘broa L-PGDS m ompound en which are lo act. This s induced ecule of ropose a itial step ovements king still lipocalin e case of -barrel, itic acid, various sults for tructural and the ad ligand molecule nters the cated on tructural