鳥取大学研究成果リポジトリ
Tottori University research result repository
タイトル
Title Acidic Property of BEA Zeolite Synthesized by Seed-directed Method
著者
Auther(s) Suganuma, Satoshi; Zhang, Haiyan; Yang, Chengguang;Xiao, Feng-Shou; Katada, Naonobu
掲載誌・巻号・ページ
Citation Journal of porous materials , 23 (2) : 415 - 421 刊行日
Issue Date 2016 資源タイプ
Resource Type 学術雑誌論文 / Journal Article 版区分
Resource Version 著者版 / Author 権利
Rights © Springer Science+Business Media New York 2015
DOI 10.1007/s10934-015-0095-6
1
Acidic Property of BEA Zeolite Synthesized by Seed-directed Method
Satoshi Suganuma*1, Haiyan Zhang2, Chengguang Yang2, Feng-Shou Xiao3, and Naonobu Katada4
1 Center for Research on Green Sustainable Chemistry, Graduate School of Engineering, Tottori
University, 4-101 Koyama-cho Minami, Tottori 680-8552, Japan
2 State Key Lab of Inorganic Synthesis and Preparative Chemistry, Jilin University, Changchun
130012, China
3 Key Lab of Applied Chemistry of Zhejiang Province, Zhejiang University, Hangzhou 310028, China
4 Department of Chemistry and Biotechnology, Graduate School of Engineering, Tottori University,
4-101 Koyama-cho Minami, Tottori 680-8552, Japan
* Corresponding author, [email protected] Phone/fax +81-857-31-5684
Abstract
The acidic property of a BEA zeolite prepared by a seed-directed synthesis (SDS) method
without organic structure directing agent (OSDA) was analyzed by a method of ammonia infrared /
mass spectroscopic (IRMS) temperature-programmed desorption (TPD). The number of Brønsted
acid sites on the SDS-BEA zeolite was larger than that on a conventional BEA zeolite synthesized
from using OSDA. The enthalpy of ammonia desorption, distributed mainly in a range between 115
and 145 kJ mol-1, was in agreement with the acid strength region generated by isomorphous
substitution of Si4+ by Al3+ in the BEA framework. These observations confirm that the
microstructure around the incorporated Al in the SDS-BEA zeolite was equivalent to that in the
conventional one.
Keywords
2
IntroductionZeolite with a *BEA structure (zeolite β, hereafter BEA zeolite) shows high catalytic
activities generally for alkylation [1] and acylation reactions including so-called Friedel-Crafts type
reactions in liquid phase [2]. Therefore this type of zeolite is promising for use in chemical industries
in place of liquid acid catalysts, as strongly demanded from a view of environmental protection [3].
Its characteristic microporous structure consisting of 12-ring (12 oxygen-membered ring) channels is
believed to show the efficient activities for reactions of relatively large molecules, as supported by a
theoretical study [ 4 ]. In addition, the strong or moderate Brønsted acid sites, generated by
isomorphous substitution of Si4+ by Al3+, are the origin of catalytic activity.
Niwa et al. have developed a method of ammonia infrared / mass spectroscopic (IRMS)
temperature-programmed desorption (TPD) [5], and have measured the Brønsted acid strength of the
BEA zeolite prepared by a dry gel conversion (DGC) method [6]. The enthalpy of ammonia
desorption (hereafter ΔH) was within 120 - 140 kJ mol-1 [7, 8]. The values of ΔH on industrially
important zeolites were shown to be MOR > MWW > MFI > BEA > FAU [9]. The sequence MFI >
BEA > FAU in acid strength was generally in agreement with such preceding studies as those based
on microcalorimetry of ammonia [ 10 ], infrared (IR) spectroscopy of adsorbed N2 [ 11 ] and
hydrocarbon reactivity [12,13]. It means that the stronger Brønsted acid sites can be found in the
MWW and MFI zeolites, but in the crystals of these zeolites, reactant molecules must pass 10-rings
to reach most of the active sites: the MWW zeolite has 12-ring-sized cavities, but they are connected
by 10-ring channels, and therefore without specific techniques to create mesopores, to delaminate
[14] or to enlarge interlayer spaces [15], the molecules have to pass 10-rings to reach the 12-ring
cavity. The MOR zeolite may have both of 12-ring channels and strong Brønsted acid sites (its
3
channels [5]. The FAU zeolite has a supercage connected by 12-ring channels, but its original
Brønsted acid site is weak (ΔH = 100-110 kJ mol-1) [ 17 ], unless specific modification with
extraframework cation species is carried out [18]. Thus, the BEA type is only the species possessing
the Brønsted acid sites due to the isomorphous substitution of Si4+ by Al3+ with moderate acid strength
in the 12-rings among aluminosilicate zeolites applied as catalysts to industrial processes.
More than half of the cost for industrial production of zeolite is owing to the use of organic
structure directing agent (OSDA) especially in cases where the composition of zeolite is highly
siliceous. Therefore, OSDA-free synthesis methods have been studied extensively. Xie et al. have
recently developed a method of OSDA-free synthesis of the BEA zeolite using seed crystals [19,20].
Other research groups also presented the synthesis of BEA by seeding [21,22]. Crystalline and textual
properties of the BEA zeolite prepared by the seed-directed synthesis method (hereafter, SDS-BEA)
have been analyzed to show the high crystallinity comparable to the conventional sample synthesized
in the presence of OSDA. A high catalytic activity for cracking of light vacuum gas oil has been
found [20].
From a view of catalytic application, the acidic property, especially the number and strength
of Brønsted acid sites, should be the subject of discussion. Particularly, the comparison of acidic
properties between the SDS sample and conventional BEA should be necessary to establish a truly
practical method. The ammonia IRMS-TPD method has been applied to the BEA zeolite to find the
acid strength sequence MFI > BEA > FAU as above [7]. We apply the same method to these BEA
zeolites in the present study in order to evaluate the acid properties of BEA zeolites.
Methods
1. Experimental
4
[19], 0.07 g of NaAlO2 and 0.312 g of NaOH were dissolved in 8.64 cm3 of H2O, followed by addition
of 0.72 g of fumed silica. After stirring for 10 min, 0.086 g of Beta zeolite seeds were introduced into
the gel. After a further stirring for 3 min, the mixture was transferred into an autoclave to crystallize
at 413 K for 18.5 h. Products were obtained by filtration at room temperature and drying at about 353
K. The elemental analysis showed that the Si/Al molar ratio was 5.3, as already reported [19].
In comparison, a sample of BEA zeolite with Si/Al = 5.3 was prepared in the presence of
OSDA (hereafter, cntl -BEA). At first, 0.16 g of NaOH and 0.30 g of NaAlO2 were dissolved in 30
cm3 of tetraethylammonium hydroxide (TEAOH, 20 wt%), then 4.8 g of fumed silica was added.
After stirring for 1 h at room temperature, the mixture was transferred into an autoclave to crystallize
at 413 K for 120 h. The product was collected by centrifugation, dried in air, and calcined at 823 K
for 5 h to remove the OSDA. In addition, a sample with Si/Al = 12.5 was supplied by Catalysis
Society of Japan as a reference catalyst JRC-Z-B25 (1). This catalyst is Na-form zeolite similar to
SDS-BEA and cntl-BEA.
The H-form of BEA zeolites were obtained by ion-exchange with 1 mol dm-3 NH4NO3
solution at 353 K for 3 h (1 g of zeolite in 50 cm3 of solution), followed by calcination at 773 K for
3 h. This ion-exchange process was repeated twice. The H-form samples were prepared from SDS-
and cntl-BEA, and JRC-Z-B25.
The Ammonia IRMS-TPD method was carried out using an automatic IRMS-TPD analyzer
(MicrotracBEL). The measurement conditions referred to our previous paper, in which homemade
IRMS-TPD analyzer was used [5]. The powder samples (5.5, 6.8, and 3.9 mg of SDS- and cntl -BEA,
and JRC-Z-B25, respectively) were compressed into a self-supporting disk with 1 cm of the diameter
under ca. 20 MPa of the pressure. The disk was placed in an in-situ IR cell equipped with an electric
furnace. The cell was evacuated, 100 kPa of oxygen was introduced in flow of 37 μmol s-1, and then
5
cell was evacuated at 823 K for 20 min. IR spectra were recorded before and after NH3 adsorption. A
helium flow (89 μmol s-1) was introduced to pass through the IR cell. The sample was heated at a
ramp rate of 2 K min-1 during the elevation temperature from 373 to 803 K in a helium flow at 6.0
kPa, and an IR spectrum was collected before ammonia adsorption at an interval of 0.5 min. These
IR spectra will be referred as background spectra N(T) hereafter. The temperature was subsequently
cooled down to 343 K, supply of the helium flow was stopped, the cell was evacuated, and ammonia
(13 kPa) was kept contact with the sample disk at 343 K for 30 min. The gaseous ammonia was then
removed by evacuation at 343 K for 30 min, and the helium flow was again. After the stabilization
step, the temperature was elevated. The flow rate of helium (89 μmol s-1), total pressure (6.0 kPa) and
ramp rate (2 K min-1) were the kept as those employed before the ammonia adsorption. IR spectrum
[sample spectrum A(T)] was taken at each 1 K, and a mass spectrum at m/e = 16 showing NH3 was
collected using a mass spectrometer (MS) during the temperature elevation. Other selected signals
of mass spectrum with different m/e ratios were also recorded in order to confirm that the signal at
m/e = 16 did not contain noises due to other materials such as water and carbon dioxide. Finally an
ammonia/helium mixture with a known concentration of ammonia (1 - 4 10-5 mol m-3) was fed to the mass spectrometer to calibrate the intensity.
Results
IR spectra of the BEA zeolites after pretreatment at 373 K is shown in Figure 1. Two signals
for stretching mode of Si-OH (ca. 3745 cm-1) and acidic OH (ca. 3610 cm-1) were observed in each
spectrum. The peak at 3660 cm-1 assignable to acidic OH was detected in the spectrum of SDS-BEA
(Figure 1 (A)).
6
ammonia adsorption on zeolite. The thermal behaviors of -OH stretching vibration on the catalysts
are shown in Figure 3. The negative absorption peaks at 3743-3722 and 3607-3582 cm-1 ascribed to
the terminal Si-OH and the framework bridged OH groups was observed in these spectra [23,24]. In
the spectra of SDS- and cntl-BEA (Figure 3 (A), (B)), the detected negative absorption peak at
3783-3756 cm-1 was assignable to terminal Al-OH [23,24]. The negative absorption peak at 3654-3643
cm-1 was found in the spectrum of SDS-BEA, at the similar peak position in Figure 1 (A). It is
speculated that this peak corresponds to Al-OH where the aluminum atom is connected with the
zeolite framework only by one or two remaining chemical bonds [24]. These results indicate that
SDS-BEA possesses four types of OH groups than the other BEA zeolites. The thermal behaviors of
ammonia desorption from Brønsted and Lewis acid sites were analyzed from bending vibrations
shown in Figure 4. At a low temperature, a band of NH4 species presumably NH4+ cations bonded to
Brønsted acid sites was observed at 1450 cm-1; the vibration mode is shown in Figure 5 (A) [25]. A
band due to NH3 coordinated to the Lewis acid sites around 1320 cm-1 [26] was small. The intensities
of these bands were quantitatively evaluated by deconvolution of the spectrum as shown in Figure 6.
Differentiation of the peak intensities by the temperature gives IR-TPD spectra, i.e., the relative
desorption rates of ammonia, from Brønsted and Lewis acid sites as functions of the temperature.
Quantification of the Brønsted and Lewis acid sites was carried out by fitting the MS-TPD and sum
of IR-TPDs of Brønsted and Lewis acid sites multiplied with adjusted coefficients, as shown in Figure
7, based on the assumption that the sum of numbers of ammonia molecules desorbed from Brønsted
and Lewis acid sites were equal to the number of ammonia detected by MS. By this procedure, the
TPD spectrum of Brønsted and Lewis acid sites are obtained with the vertical axis in the unit of mol
m-3.
On the cntl-BEA and JRC-Z-B25, a separated peak at ca. 400 K in the MS-TPD was not
so-7
called l-peak (low temperature peak) is ascribed to NH3 hydrogen-bonded to NH4 which had been
formed on the Brønsted acid site [27-29]. It has been known that the wavenumber of NH3-M strongly
depends on the element of M [26], and therefore the hydrogen-bonded NH3 must have the band
position and width different from those of Lewis acid site-bounded NH3, and it is possible that the
former is hidden by the skeletal absorption of zeolite. In conclusion, we can say that there was at
least one kind of NH3 species bonded to non-acidic adsorption site, and it was ignored by the IRMS
analysis. Also on the SDS-BEA, the low temperature part of MS-TPD was not fitted with the
IR-TPDs and therefore ignored.
Figure 7 shows the MS-TPD spectra whose vertical axis is shown in the unit of mol m-3. The
integration of desorption peak gives the total number of ammonia molecules adsorbed, which should
be equal to the number of acid sites (hereafter A0), as listed in Table 1. The Lewis acid sites were less
than the Brønsted acid sites. The strength distribution of Brønsted acid sites was analyzed according
to a method previously proposed [30]. The desorption profile is calculated based on assumed
distribution of ammonia adsorption heat, and the distribution which gave the curve fitted best to the
experimental curve (Figure 8) was selected as shown in Figure 9.
Discussion
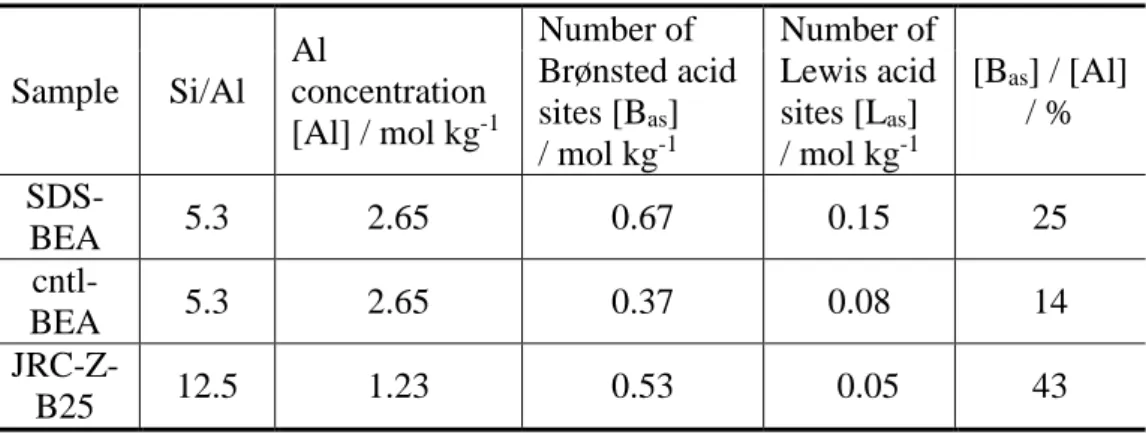
Number (A0) and strength (ΔH) of the Brønsted and Lewis acid sites on the two samples
were quantified in detail. Most of the acid sites were Brønsted type on both samples. The
conventional BEA synthesized with using OSDA (cntl-BEA) had much smaller acid sites or much
smaller Brønsted acid sites than the seed synthesized, SDA-free BEA (SDS-BEA). The numbers of
Brønsted acid sites on the cntl-BEA and SDS-BEA was 14 and 25 % of the number of Al atoms (2.65
8
terminal Al-OH. Al atoms in SDS-BEA may exist as terminal Al-OH and AlO4 tetrahedra partially
connected with the zeolite framework [31]. The stoichiometric generation of acid sites where the
number of Brønsted acid sites is equal or slightly smaller than the number of Al atoms is easily
realized on the MOR and MFI structure,[32] but it is difficult to obtain on the BEA zeolite, probably
due to the easiness of formation of crystallographic faults [ 33 , 34 ]. It has been shown that
commercially available samples generally possessed the Brønsted acid sites less than 70% of Al
content [7,35]. We have presented that the DGC method could realize the sample with Si/Al = 15
([Al] = 1.0 mol kg-1) in which the number of total acid sites were close to the number of Al atoms,
but it had considerable fraction (16%) of Lewis acid sites [36], and it was impossible to obtain a
sample with such a high quality at a lower Si/Al ratio, i.e., higher Al concentration [7]. In addition,
the DGC method, to the best of our knowledge, has to use OSDA. We believe that the present
Brønsted acid amount, 0.67 mol kg-1 and 25% of Al concentration, are sufficiently high to
demonstrate the efficiency of OSDA-free synthesis method.
We have presented that the strength (or at least the ammonia desorption enthalpy ΔH from a
view to avoid from a philosophical controversy about which parameter represents the intrinsic acid
strength) of a Brønsted acid site generated by a framework Al atom is principally controlled by the
framework structure and therefore the acid strength is small in one zeolite [9], and this is because the
acid strength is controlled by the compression from the both ends of Al-OH-Si bridge induced by the
forcefield due to the framework tension [37]. The peak position of ΔH distribution of Brønsted acid
strength on cntl-BEA and JRC-Z-B25 was about 143 kJ mol-1. However, the acid strength distribution
of cntl-BEA was narrower than those of BEA and JRC-Z-B25. The distribution of ΔH on
SDS-BEA was obviously broad compared to cntl-SDS-BEA and JRC-Z-B25, but ΔH of most of the Brønsted
acid sites was within 115 - 145 kJ mol-1. These are approximately consistent with previously reported
9
[38,39] in which ΔH of the *BEA zeolite was ca. 130 kJ mol-1, while the standard deviation was close
to 10 kJ mol-1 [40]. In addition, density functional theory (DFT) calculations, which giving the ΔU
(inner energy change) values generally consistent with the experimentally observed values over a
wide range of zeolites, showed that acid sites at several crystallographically non-equivalent positions
in the BEA structure possessed 127-133 kJ mol-1 of ΔU [8], corresponding to 132-138 kJ mol-1 of ΔH
(= ΔU+RTm where R and Tm are the gas constant and peak temperature of TPD, respectively) in the
present experimental conditions. The presently observed range 115 - 145 kJ mol-1 was wider but
different from the theoretically shown range 132 - 138 kJ mol-1.
The ΔH distribution of the SDS-BEA was broader on low range. It had Brønsted acid sites
exceptionally weak with ca. 120 kJ mol-1 of ΔH. On the other hand, the acid strengths of various
zeolites are distributed from 100 to 160 kJ mol-1 [9]. From this knowledge, it has to say that the
SDS-BEA contained a considerable amount of Al atoms whose structural environment was different from
the Al atoms in proper *BEA zeolite. There are two possibilities.
[A] For example, some Al atoms in the SDS-BEA exist at the terminal on structural defects.
Acidic OH around such irregular environments is speculated to be lower acid strength sites.
[B] Al was mainly contained in an amorphous region.
The latter has a low probability because the number of Lewis acid sites was small although
the amorphous silica-alumina must have a large amount of Lewis acid sites, inconsistent with the fact
that the SDS-BEA had negligible amount of Lewis acid sites. In the thermal behaviors of -OH
stretching vibration on the catalysts (Figure 3), it is expected that SDS-BEA possesses defect sites,
that brought formation of terminal Al-OH and OH group on AlO4 tetrahedra partially connected with
the zeolite framework. According to the DFT calculations [8], weaker acid sites were supposed to
exist not at intersection of two 12-ring channels, but in a 12-ring channel. The generation of the
10
Therefore, OSDA-free method in the synthesis of SDS-BEA probably forms the weaker Brønsted
acid sites, whereas it is difficult to form such weaker acid sites into the conventional BEA zeolites
synthesized from using OSDA. It is concluded that most of Al atoms in the SDS-BEA generated
Brønsted acidity equivalent to the conventional BEA zeolite, and a fraction of Al were in different
environment to show slightly low Brønsted acid strength.
Conclusions
The BEA zeolite synthesized using no OSDA possessed little of Lewis acid sites. The
number of Brønsted acid sites was ca. 25% of the number of Al atoms. Much of Al atoms may exist
as terminal Al-OH and AlO4 tetrahedra partially connected with the zeolite framework. The enthalpy
of ammonia desorption of Brønsted acid sites as a measure of acid strength was 115-145 kJ mol-1,
approximately equivalent to the conventional zeolite with the same framework structure with a
fraction of Brønsted acid sites with slightly low strength.
Acknowledgement
This study was partly supported by a Grant-in-Aid for Scientific Research (B) 23360358
from the Ministry of Education, Culture, Sports, Science and Technology, Japan.
[1] G. Bellussi, G. Pazzuconi, C. Perego, G. Girotti, G. Terzoni, J. Catal. 157 (1995) 227‒234.
[2] G. Sartori, R. Maggi, Chem. Rev. 106 (2006) 1077‒1104.
[3] K. Shimizu, A. Satsuma, Energy Env. Sci. 4 (2011) 3140‒3153.
[4] C. Perego, S. Amarilli, R. Villini, G. Bellusi, G. Girotti, G. Terzoni, Micropor. Mespor. Mater. 6
(1996) 395‒404.
[5] M. Niwa, K. Suzuki, N. Katada, T. Kanougi, T. Atoguchi, J. Phys. Chem. B 109 (2005) 18749‒
11
18757.
[6] P.R.H.P. Rao, M. Matsukata, Chem. Commun. (1996) 1441‒1442.
[7] M. Niwa, S. Nishikawa, N. Katada, Micropor. Mesopor. Mater. 82 (2005) 105‒112.
[8] N. Katada, H. Tamagawa, M. Niwa, Catal. Today 226 (2014) 37-46.
[9] M. Niwa, N. Katada, K. Okumura, Characterization and Design of Zeolite Catalysts: Solid
Acidity, Shape Selectivity and Loading Properties; Springer, Berlin, 2010.
[10] A. Auroux, Top. Catal. 19 (2002) 205‒213.
[11] F. Lonyi, A. Kovacs, J. Valyon, J. Phys. Chem. B 110 (2006) 1711‒1721.
[12] S. Walspurger, Y. Sun, A.S.S. Sido, J. Sommer, J. Phys. Chem. B 110 (2006) 18368‒18373.
[13] N. Katada, K. Suzuki, T. Noda, W. Miyatani, F. Taniguchi, M. Niwa, Appl. Catal. A: Gen. 373
(2010) 208‒213.
[14] A. Corma, V. Fornes, S.B. Pergher, Th.L.M. Maesen, J.G. Buglass, Nature 396 (1998) 353‒356.
[15] S. Inagaki, T. Tatsumi, Chem. Commun. (2009) 2583‒2585.
[16] G. Busca, Chem. Rev. 107 (2007) 5366‒5410.
[17] K. Suzuki, N. Katada, M. Niwa, J. Phys. Chem. C 111 (2007) 894‒900.
[18] K. Suzuki, T. Noda, G. Sastre, N. Katada, M. Niwa, J. Phys. Chem. C 113 (2009) 5672‒5680.
[19] B. Xie, J.W. Song, L.M. Ren, Y.Y. Ji, J.X. Li, F.-S. Xiao, Chem. Mater. 20 (2008) 4533‒4535.
[20] B. Xie, H. Zhang, C. Yang, S. Liu, L. Ren, L. Zhang, X. Meng, B. Yilmaz, U. Müller, F.-S. Xiao,
Chem. Commun. 47 (2011) 3945‒3947.
[21] G. Majano, L. Delmotte, V. Valtchev, S. Mintova, Chem. Mater. 21 (2009) 4184‒4191.
[22] Y. Kamimura, W. Chaikittisip, K. Itabashi, A. Shimojima, T. Okubo, Chem.-Asian J. 5 (2010)
2182‒2191.
[ 23 ] E. Loeffler, U. Lohse, Ch. Peuker, G. Oehlmann, L.M. Kustov, V.L. Zholobenko, V.B.
12
[24] E. Bourgeat-Lami, P. Massiani, F.D. Renzo, P. Espiau, F. Fajula, Appl. Catal. 72 (1991)
139-152.
[25] K. Nakamoto, Infrared and Raman Spectra of Inorganic and Coordination Compounds, 6th
Edition, Part B; John Wiley & Sons, Hoboken, 2009, p. 194.
[26] K. Nakamoto, Infrared and Raman Spectra of Inorganic and Coordination Compounds, 6th
Edition, Part A; John Wiley & Sons, Hoboken, 2009, p. 3.
[27] W.L. Earl, P.O. Fritz, A.A.V. Gibson, J.H. Lunsford, J. Phys. Chem. 91 (1987) 2091‒2095.
[28] F. Lónyi, J. Valyon, Thermochim. Acta 373 (2001) 53‒57.
[29] A. Zecchina, L. Marchese, S. Bordiga, C. Pazé, E. Gianotti, J. Phys. Chem. B 101 (1997) 10128‒
10135.
[30] N. Katada, T. Tsubaki, M. Niwa, Appl. Catal. A: Gen. 340 (2008) 76‒86.
[31] H. Zhang, B. Xie, X. Meng, U. Müller, B. Yilmaz, M. Feyen, S. Maurer, H. Gies, T. Tatsumi,
X. Bao, W. Zhang, D.D. Vos, F.S. Xiao, Micropor. Mesopor. Mater. 180 (2013) 123-129.
[32] N. Katada, H. Igi, J.-H. Kim, M. Niwa, J. Phys. Chem. B 101 (1997) 5969‒5977.
[33] J.C. Jansen, E.J. Creyghton, S.L. Njo, H. van Koningsveld, H. van Bekkum, Catal. Today 38
(1997) 205‒212.
[34] C. Jia, P. Massani, D.J. Barthomeuf, Chem. Soc. Faraday Trans. 89 (1993) 3659‒3665.
[35] N. Katada, S. Iijima, H. Igi, M. Niwa, Stud. Surf. Sci. Catal. 105 (1996) 1227‒1234.
[36] Y. Miyamoto, N. Katada, M. Niwa, Micropor. Mesopor. Mater. 40 (2000) 271‒281.
[37] N. Katada, K. Suzuki, T. Noda, G. Sastre, M. Niwa, J. Phys. Chem. C 113 (2009) 19208‒19217.
[38] F. Collignon, R. Loenders, J.A. Martens, P.A. Jacobs, G. Poncelet, G. J. Catal. 182 (1999) 302‒
312.
[39] F. Collignon, G. Poncelet, J. Catal. 202 (2001) 68‒77.
13
Table 1: Determined parameters showing the acidic property
Sample Si/Al Al concentration [Al] / mol kg-1 Number of Brønsted acid sites [Bas] / mol kg-1 Number of Lewis acid sites [Las] / mol kg-1 [Bas] / [Al] / % SDS-BEA 5.3 2.65 0.67 0.15 25 cntl-BEA 5.3 2.65 0.37 0.08 14 JRC-Z-B25 12.5 1.23 0.53 0.05 43
14
Figure captionsFigure 1: IR spectra in a region of 3300 - 3800 cm-1 on (A) SDS-BEA, (B) cntl-BEA, and (C)
JRC-Z-B25 measured at 373 K after pretreatment at 823 K.
Figure 2: Difference spectra of IR A(T)-N(T) [(spectrum after ammonia adsorption) - (spectrum
before ammonia adsorption)] on (A) SDS-BEA, (B) cntl-BEA, and (C) JRC-Z-B25.
Figure 3: Enlarged portion at -OH stretching vibration region (3450 - 3820 cm-1) of Figure 2 on (A)
SDS-BEA, (B) cntl-BEA, and (C) JRC-Z-B25. The baseline for each of these spectra was corrected.
Figure 4: Enlarged portion at bending vibration region (1100 - 2000 cm-1) of Figure 2 on (A)
SDS-BEA, (B) cntl-SDS-BEA, and (C) JRC-Z-B25.
Figure 5: Vibration modes of 1450 (A, NH4) and 1300 cm-1-bands (B, NH3). The symbols ○, ●
and show H, N and metal (Lewis acid site) atoms, respectively.
Figure 6: Examples of deconvolution of bending vibration region of IR spectrum. (A) and (B): SDS
-BEA, (C) and (D): cntl-BEA, (E) and (F): JRC-Z-B25, (A), (C) and (E): 373 K, (B), (D), and (F):
523 K.
Figure 7: Fitting of IR- and MS-TPD giving TPD spectra of Brønsted and Lewis acid sites on (A)
15
Figure 8: Curve fitting for determination of strength distribution on (A) SDS-BEA, (B) cntl-BEA,
and (C) JRC-Z-B25.
16
Figure 1
3300
3400
3500
3600
3700
3800
A
bs
orba
nc
e
=
0.5
(A)
(B)
(C)
Wavenumber / cm
-1
17
18
19
20
Figure 3 (A)
3500
3600
3700
3800
-0.1
0
Wavenumber / cm
-1A
bs
orba
nc
e
773 K
at 50 K
intervals
423 K
21
Figure 3 (B)
3500
3600
3700
3800
-0.1
0
Wavenumber / cm
-1A
bs
orba
nc
e
773 K
at 50 K
intervals
423 K
22
Figure 3 (C)
3500
3600
3700
3800
-0.1
0
773 K
at 50 K
intervals
423 K
Wavenumber / cm
-1A
bs
orba
nc
e
23