Estimation of Peak Ground Acceleration from Horizontal Rigid Body Displacement: A Case Study in Port-au-Prince, Haiti
Susan E. Hough1, Tomoyo Taniguchi2, and Jean-Robert Altidor3 1
U.S. Geological Survey, Pasadena, CA USA 2
Dept. of Civil Engineering, Tottori University, Tottori, Japan 3
Bureau des Mines et de l’Energie, Port-au-Prince, Haiti
Abstract.
The Mw7.0 Haiti earthquake of 12 January 2010 caused catastrophic damage and loss of life in the capital city of Port-au-Prince. The extent of the damage was primarily due to poor
construction and high population density. The earthquake was recorded by only a single seismic instrument within Haiti, an educational seismometer that was neither bolted to the ground nor able to record strong motion on scale. The severity of near-field mainshock ground motions, in Port-au-Prince and elsewhere, has thus remained unclear. We present detailed, quantitative analysis of the marks left on a tile floor by an industrial battery rack that was displaced by the earthquake in the Canape Vert neighborhood in the southern Port-au-Prince metropolitan region. Results of this analysis, based on a recently developed formulation for predicted rigid body displacement caused by sinusoidal ground acceleration, indicate that mainshock shaking at Canape Vert was approximately 0.5g, corresponding to MMI VIII. Combining this result with the weak-motion amplification factor estimated from aftershock recordings at the site as well as a general assessment of macroseismic effects, we estimate peak acceleration of ≈0.2g for sites in central Port-au-Prince that experienced relatively light-to-moderate damage, and where estimated weak-motion site amplification is less severe than at the Canape Vert site. We also analyze a second case of documented rigid body displacement, at a location less than 2 km from the Canape Vert site and estimate peak acceleration of approximately 0.4g at this location. Our results illustrate how observations of rigid body horizontal displacement during earthquakes can be used to estimate peak ground acceleration in the absence of instrumental data.
Introduction
The M7.0 Haiti earthquake occurred at 21:53 UTC (16:53 LT) on 12 January 2010, with an epicenter near the town of Leogane, approximately 25 km west of Port-au-Prince. The epicenter is almost directly along the mapped trace of the Enriquillo Plaintain Garden fault (EPGF), the primary plate boundary fault in southern Haiti (e.g., Mann et al., 1991; Calais et al., 2002). Analysis of available data, including regional seismic data, GPS, and InSAR data, has yielded several different mainshock rupture models (Calais et al., 2010; Hayes et al., 2010). Although the solutions differ in detail, all involve moment release on a north-dipping fault adjacent to the EPGF and a predominantly unilateral rupture towards the west, although fault rupture with relatively minor moment release is inferred to have extended 5-10 km east.
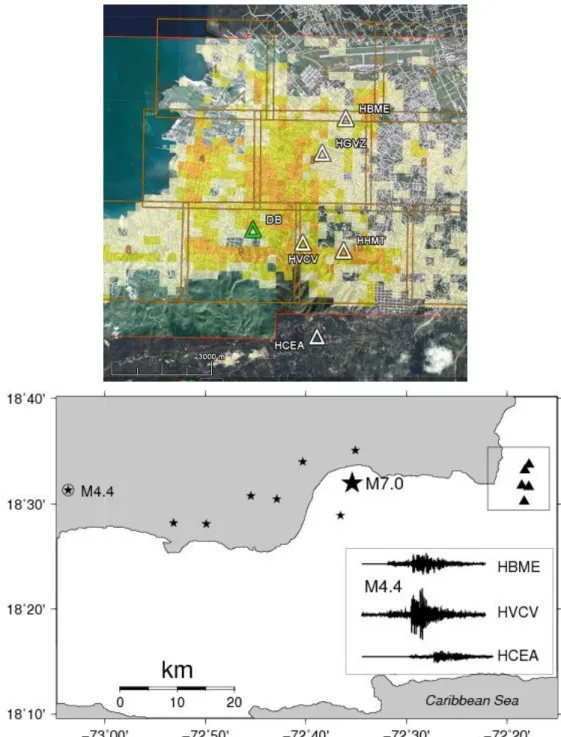
The earthquake caused catastrophic damage and loss of life in Port-au-Prince. A massive building assessment program undertaken in the months following the earthquake revealed that 52% of the houses were safe for habitation (“green,” following the color coding convention used by FEMA), 26% could be made safe with repairs (“yellow”), and 21% were in need of major repair or demolition (“red”; Miyamoto et al., 2011). Some parts of the city were more heavily damaged than others, but no corner of the metropolitan region escaped unscathed (Figure 1a). The scale and scope of damage suggested severe mainshock ground motions. However it is clear that the damage from this earthquake was primarily due to the prevalence of poor construction.
Although the 2010 earthquake was well recorded at teleseismic and regional distances, it was not recorded by any strong motion instruments in Haiti. The severity and distribution of mainshock ground motions in the metropolitan Port-au-Prince region thus remains very poorly constrained. Faced with the near-certainty of a future earthquake on the EPGF system east of the 2010
mainshock (e.g., closer to Port-au-Prince), key questions emerge: 1) What level of shaking could occur during a future earthquake, and how does predicted shaking compare with that during the 2010 mainshock? And, 2) does shaking severity vary significantly throughout the Port-au-Prince metropolitan area due to local geological structure?
Figure 1a. Damage distribution for mainshock determined from analysis of remote-sensing imagery. Colors indicate estimated percent building damage: 0-10% (tan), 10-40% (yellow), >40% (orange). Portable seismic stations also shown (white triangles): foothill stations HVCV and HHMT, reference station HCEA, and valley stations HBME, HVGZ. The house shown in Figure 2b is close to the location of HVGZ. Location of Digicel Building (DB) indicated by green triangle. 1b (bottom). Approximate epicenter of 12 January 2010 earthquake (large star); portable stations deployed to record aftershocks (triangles); inset panel NS component of motion at stations HBME, HVCV, and HCEA for M4.4 aftershock on 21 September 2010 (circled star). Peak acceleration at HVCV is 0.88g. Area of damage map shown in Figure 1a corresponds to inset box upper right.
In the absence of instrumental strong-motion data, careful analysis of macroseismic effects can be useful to determine ground motion parameters including peak ground acceleration (PGA) and peak ground velocity (PGV) (e.g., Atkinson and Wald, 2007). Macroseismic intensities for the Haiti earthquake were determined from a total of almost 1000 reports submitted to the
Community Internet Intensity Map (“Did You Feel It?”) site (Wald et al., 1999). A total of 15 accounts were submitted from Port-au-Prince, from which an average numerical intensity of 7.4 was determined. It is not known where within the city the accounts were from: the overall
damage distribution (Figure 1a) suggests significant variability of shaking across the metropolitan region.
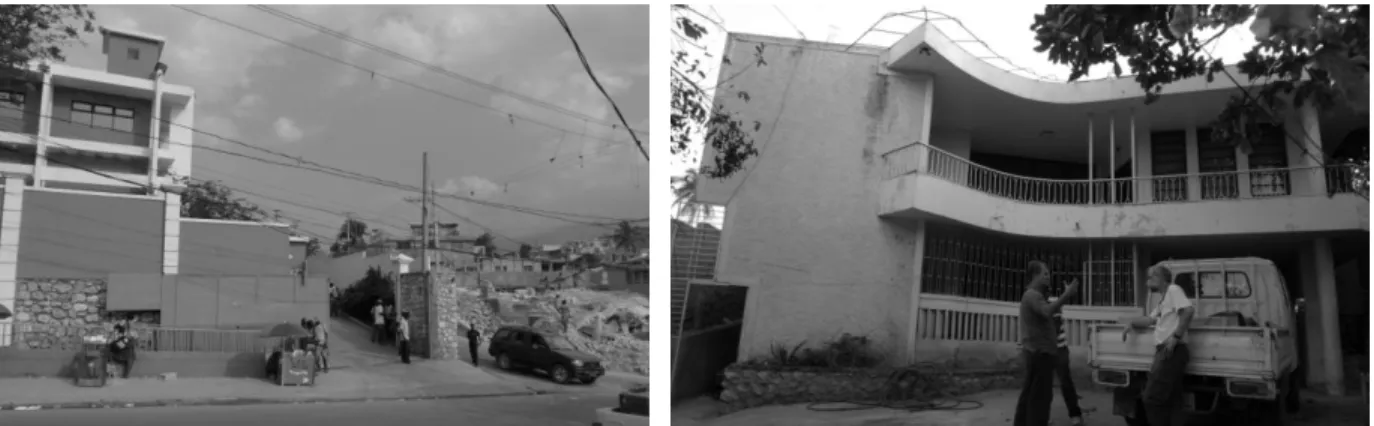
Figure 2a (left) A good-quality commercial structure in which MMI V-VI is estimated based on an eyewitness interview; 2b (right) a private home, masonry C construction, for which MMI VI is estimated. The structures on both sides of the structure shown in 2a collapsed catastrophically, as did a school building adjacent to the house shown in 2b.
A thorough, systematic survey of seismic intensities – properly taking vulnerability into account – has not been done to-date. A handful of well documented direct eyewitness accounts suggest relatively moderate shaking severity. For example, a direct eyewitness survey revealed that, in the well-built commercial structure shown in Figure 2a, shaking severity was only Modified Mercalli Intensity (MMI) V: a few small objects overturned, no cracks or structural damage, pictures hung on nails knocked askew but not off of the walls, etc. The buildings on both sides of this structure collapsed catastrophically. Similarly, the house shown in Figure 2b, which can reasonably be assumed to be of ordinary masonry construction ordinary workmanship, neither reinforced nor designed to resist lateral forces), sustained only very minor, surficial cracks, and
some toppling of small objects, indicating MMI VI. Many nearby structures, including a school building directly adjacent to the house, sustained catastrophic damage or collapse.
The severity of mainshock ground motions was considered by Goodno et al., (2011), who
evaluated the performance of mechanical and electrical systems at selected critical facilities at ten sites located between 13-22 km of the mainshock epicenter. Goodno et al. (2011) obtain rough estimates of PGA based on correlations established from damage observations from the 1971 San Fernando, California, earthquake and from established associations between MMI and PGA. They estimate 0.13-0.2g, 0.15-0.3g, and 0.3-0.47g, respectively, at sites that experienced light, moderate, and major damage, respectively.
To investigate the severity of mainshock shaking quantitatively, we use a recently developed formulation for the predicted displacement of a rigid body in response to an input sinusoidal acceleration (Taniguchi and Miwa, 2007; see also Taniguchi and Miwa, 2004). The displacement of a rigid body subjected to horizontal accelerations was first investigated by Newmark (1965). Choi and Tung (2001) re-derive this formula in terms of the displacement response spectrum. A small handful of forensic studies, i.e., analysis of observed displacement to infer PGA, have been done. For example, MEDAD (2007) apply Newmark’s formulation to estimate PGA based on observed displacement of tombstones during a M6.8 earthquake in Japan. Related studies have focused on the estimation of PGA based on observations of toppled artifacts such as free-standing columns: these studies focus on the rocking rather than the sliding response of rigid bodies (e.g., Hinzen, 2009). To our knowledge, the improved formulation of Taniguchi and Miwa (2007) has not been used previously to estimate PGA based on observed rigid body displacement. We employ the approach in this study to analyze two specific cases documented following the 2010 Haiti earthquake. The first site, HVCV, is in the Canape Vert neighborhood in the southern Port-au-Prince metropolitan region, a location where a portable seismometer was deployed to record aftershocks (Hough et al, 2010; 2011). The second site is located approximately 2 km west of the first site: the commercial Digicel Corp. (DC) building (Figure 1a), one of the sites investigated by Goodno et al. (2011). We consider the results of our quantitative analyses in light of the weak-motion amplification observed at HVCV and the generalized assessment of shaking severity by Goodno et al. (2011). We further consider the implications of these results for assessment of the
overall severity and distribution of shaking in the Port-au-Prince metropolitan area. We note that some studies have concluded that, as a single parameter, peak ground velocity correlates with damage better than PGA. However, we focus on PGA in this study because the formulation of Taniguchi and Miwa (2007) is based on acceleration, and to facilitate comparison with the results of other studies.
Shaking Intensity at Canape Vert (HVCV)
In March, 2010, eight portable digital strong motion instruments were deployed throughout Port au-Prince by the Bureau des Mines et de l’Energie working in partnership with the U.S.
Geological Survey. Working within the constraints imposed by highly challenging field conditions, the array was designed to investigate the variability of shaking due to local site
conditions (Hough et al., 2010). Two stations, HVCV and HHMT, were installed at foothill sites, where local geological conditions were expected to be intermediate between the hills to the south and the valley to the north (Figure 1a). The instruments were installed at, respectively, a cell phone facility owned by the Voila Corporation and the Hotel Montana. Analysis of aftershocks recorded across the array revealed that inferred amplification was higher at these two stations than at adjacent stations in the valley. The results of this investigation are presented by Hough et al. (2011), who concluded that the amplification at HHMT and HVCV is due to topographic effects.
The Hotel Montana suffered catastrophic damage during the mainshock. In this study we focus on a unique case of documented horizontal rigid body displacement at HVCV. The apparently well built, well engineered two-story building at this site sustained little structural damage (Figure 3a). On the grounds of the cell phone facility a retaining wall and part of the parking lot
collapsed (Figure 3b) and cinderblock walls fell. Interviews with employees who were in the building at the time reveal that shaking within the building was strong enough to topple computer monitors, free-standing counters and other furniture, and to knock people to their feet several times when they tried to run. Employees also reported that the building itself sustained light damage to the upper right corner visible in Figure 3a; the extent of the damage, which had been repaired by March, 2010, is not clear.
Figure 3a. (left) Canape Vert Voila cell phone facility; 3b. (right) collapse of retaining wall in parking lot. The face of the building seen in the photograph is aligned roughly N-S; the battery racks discussed in this study are located on the ground floor, in a large room behind the doors seen at left in Figure 3a.
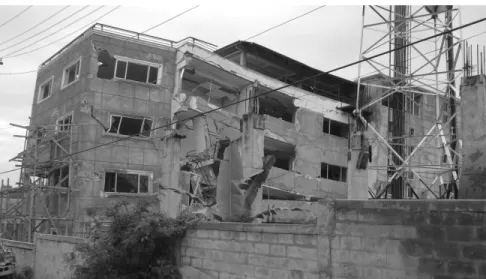
In the residential neighborhood to the immediate west of HVCV almost all houses collapsed catastrophically. All of these structures, however, were unreinforced masonry of extremely poor construction. Within approximately ½ km of HVCV a recently completed, apparently well built commercial structure sustained substantial damage (Figure 4); this structure was not salvageable, and by November, 2010 it had been demolished.
Figure 4. Damage to recently built commercial building approximately 0.5 kilometer west of HVCV. The building was later demolished.
Figure 5a. (left) Rack of batteries that was moved across the floor during the mainshock. The near (short) edge of the front rack is aligned roughtly N-S, with the closest edge towards the south; 5b (right) close-up of scratches left on tile, including pen marks drawn to indicate inferred trajectory. (The loop is inferred to have been left by a remnant of the bolt that was dragged as the rack moved)
At HVCV shaking was strong enough to displace heavy industrial battery racks on the ground floor of the Voila building shown in Figure 3a. The battery rack shown in Figure 5 was one of several rows of similar racks in a large room on the ground floor of the northwest side of the building. Several individual racks had been moved by the earthquake; the one shown in Figure 5 experienced the most displacement and left the most clear and accessible marks on the floor. This rack holds a total of 24 batteries: six rows of four. Each battery weighs approximately 320 lbs; the weight of the batteries is thus approximately 7680 lbs. The rack is 141 cm wide, 172 cm tall, and 56 cm wide including the full width of the feet, approximately 40 cm without the feet. The height/width aspect ratio is thus approximately 4:1.
The close-up photograph of the floor near the rack (Figure 5a) reveals two adjacent holes where two adjacent racks were anchored. The southernmost rack (to right in Figure 5b) was initially set into motion towards the south; the neighboring rack moved towards the north. We suggest the most likely explanation for the opposite directions of motion is that the racks collided with each other as a result of rocking motion due to the initial shaking, since rocking motion is generally the most feasible movement for tall and insufficiently anchored structures. He further suggest that the bolts holding down both racks were broken at least in part as a consequence of the force of the reaction due to the collision. Once the racks were free to move, the northern rack may have interacted with the neighboring rack on the other side (towards the back of the photograph), but
the southern rack moved only in response to earthquake ground motions. According to this interpretation, the initial southward displacement of the rack, approximately 30 cm, resulted from a combination of collisional forces and the force associated with ground acceleration. During this excursion towards the south the rack also moved approximately 24 cm to the west. This
westward component of motion cannot have been a consequence of the collision, which acted in a nearly perpendicular direction. The two subsequent displacements, approximately 22 cm and 27 cm, respectively, are also inferred to be a consequence of ground acceleration.
Once the bolts were broken, the coefficient of friction was significantly reduced, allowing the rack to slide. The scratch marks on the floor reveal no evidence for subsequent rocking after the bolts were broken. The coefficient of friction during sliding is unknown, but we can estimate an upper bound given that the rack did not rock after the bolts were broken. We can then explore the range of PGA and predominant period of motion that will generate a displacement of 22-27 cm.
The coefficient of friction between the steel legs of the rack and the floor is a key parameter for our analysis, and is unknown. Established values for the coefficient of friction between steel and other materials are almost universally higher than 0.2, except for extremely slippery materials such as graphite and Teflon. The ceramic tile floor is relatively slippery, but presumably less slippery than Teflon. We therefore consider = 0.15-0.20 to be a reasonable estimate, and consider values of 0.15 and 0.20 in our calculations.
We use the results of Taniguchi and Miwa (2007), who consider the slip displacement of a rigid body subjected to sinusoidal horizontal motions as an approximation for motion caused by earthquake shaking. (We will discuss the additional complication of vertical acceleration in a following section.) Taniguchi and Miwa (2007) show that, in response to horizontal sinusoidal motion, the maximum relative displacement of a rigid body is given by:
2 1 11 2 2 2 1 sin 2 sin 4 2 1 D t D t T gT A μgt x gx (1) where 1 0 0 2 cos 2 T t π gT A μgt D gx , 0 0 0 2 2 2 0 2 2 cos 2 2 sin 4 2 1 t T gTt A t T gT A μgt D gx gx
gx A Sin T t 1 0 2 2 1 2 2 2 2 1 gx gx gx A A A T t (2) and Agx, gx gx gx A Sin A A Sin 1 1 cos
where Agxg is the peak acceleration and T is the period. We use equation (1) to calculation xd for Agx = 0.1 – 1.5g and T = 0.1 – 1.3 s, assuming values of 0.15 and 0.20.
A further consideration is that, as discussed by Taniguchi and Miwa (2007), predicted slip from input sinusoidal motions, xsin ,will differ from predicted slip from earthquake ground motions. On average, the mean ratio between exact displacement and xsin is approximately 1. That is, 50% of earthquakes with a given Agx are expected to produce a horizontal displacement greater than xsin. Considering 104 earthquake records from sites around Japan, Taniguchi and Miwa (2007) determine the probability density function (pdf) for a slip ratio, prob for including the aspect of earthquake shaking complexity that elongates or shortens the displacement relative to that predicted for input sinusoidal acceleration:
xeq = prob. xsin (7) Using the 104 recordings, Taniguchi and Miwa (2007) derive values of prob of 1.84 and 2.32 corresponding to probabilities of nonexceedance of 90% and 95%, respectively. That is, if we start with the observed displacement due to an earthquake, xeq, the target displacement we seek to match using equation (1) is xeq/prob, where we choose prob for a desired probability of nonexceedance. Thus, to obtain a more statistically rigorous estimate of acceleration due to earthquake shaking, Agxeq, we should consider a target displacement of (22-27 cm)/1.84 to obtain an estimate of Agxeq with a 90% probability of nonexceedance, or (22-27 cm)/2.32 for a 95% probability of nonexceedance. In the following section we will use a target displacement of 12-15
cm to estimate Agxeq with a 90% probability of nonexceedance. The choice of a 90% probability of exceedance is arbitrary; we consider it a more reasonable, conservative estimate than an estimate corresponding to a 50% probability of exceedance, which has a significant chance of overestimating the true accelerations.
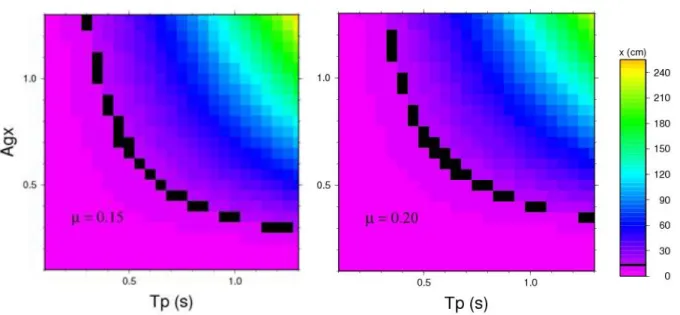
Figure 6. Predicted displacement in cm (color scale indicated) as a function of predominant
period of shaking, Tp, and peak acceleration (Agxg) for values of 0.15 (left), 0.20 (right). Black swath indicates values that predict maximum displacement values of 12-15 cm, the target
displacement to estimate Agxeq with a 90% probability of nonexceedance.
The results shown in Fig. 6 reveal that the range of Agx/Tp values that predict a displacement of 12-15 cm do not differ significantly for the assumed values of . (Tp is the dominant period of ground acceleration). In both cases, Agx is upwards of 0.7g for Tp=0.5s, a value that is consistent with the longest-period site response peak inferred from weak motion recordings. Given the proximity of the mainshock to the site it is likely that mainshock ground motions were controlled by longer period energy. We consider the range 0.5 – 1 s to be a reasonable range for Tp. This range corresponds to Agxeq values of roughly 0.3-0.7g for the values of considered.
A final consideration is that the vertical component of slip can effectively reduce or increase the acceleration of gravity. At this site, aftershock recordings reveal that the horizontal components of motion are systematically (and typically) amplified relative to the vertical component by a
factor of approximately 2 over a frequency range 0.4-10 Hz (Figure 9). As noted by Taniguchi and Miwa (2007), the effects of varying vertical acceleration on the body will have minimal contribution to the displacement given the short time a body is in motion. To provide an adequate safety margin for predictions of displacement for a given ground motion, Taniguchi and Miwa (2007) assume a monotonous reduction in friction due to vertical acceleration. Considering 144 accelerograms with peak horizontal accelerations scaled to 9 m/s2, they calculate that introducing a monotonous reduction in friction increases the displacement on average by 19%. For a body on a ground floor, the nominal coefficient of friction, ’, is given by
’ = (1-PVGA(/g)) (4) where PVGA is the peak vertical ground acceleration and is the standard deviation of the ratio of the vertical ground acceleration to the peak vertical ground acceleration at the instant of the peak horizontal shaking.
In this study we are not seeking to predict displacement for a given ground motion but rather to infer ground motion for a given displacement. The effects of varying vertical acceleration, which could either increase or decrease effective friction, are unknowable but will introduce an
additional factor of uncertainty.
Figure 7a (left). Three components of ground motion (NS top, V middle, EW bottom) for a M4.4 aftershock recorded at HVCV; 7b (right) NS/V spectral ratio.
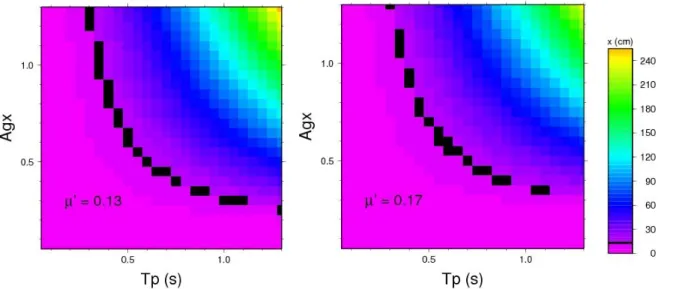
To explore the possible effect of vertical accelerations we assume = 0.46 and vertical acceleration, PGVA, to be 0.5 horizontal PGA, following Taniguchi and Miwa (2007). Assuming horizontal PGA of 0.6g and that vertical acceleration monotonically lowers ’, equation (3) yields ’=0.86. If we lower our estimates of from 0.15 and 0.20 accordingly (i.e., to 0.13 and 0.17), the range of inferred Agx values is lowered only slightly (Fig. 9). For example, for Tp=0.5 s, the Agx value that predicts a displacement of 15 cm is 0.65g for ’=0.13 versus 0.70 for =0.15. As discussed by Taniguchi and Miwa (2007), the target displacement also changes if one considers the effects of vertical base acceleration. For 90% probability of exceedance, the target displacement is 13.0 -16.0 cm (i.e., (22-27 cm)/1.69). Given the limitations in precision of the estimated displacements, this difference is not consequential.
Figure 8. Predicted displacement in cm (color scale indicated) as a function of predominant period of shaking, Tp, and peak acceleration (Agxg) for ’ values of 0.13 (left), 0.17 (right). Black swath indicates values that predict maximum displacement values of 12-15 cm, the target
displacement to estimate Agxeq with a 90% probability of nonexceedance.
Shaking Intensity at the DB Facility
A second case of rigid body displacement during the Haiti earthquake is documented by Goodno et al. (2011): an unanchored USB cabinet that was shifted across a concrete floor at a commercial building located at 18.53273N, -72.32324W (see Figure 1a). Like the battery racks at HVCV, this cabinet was located at ground level in a well-built commercial structure that sustained some structure damage, but not catastrophic damage or collapse.
Unlike the batterygram, the documented displacement at DB provides only an indication of the total displacement, not a complete trajectory of the motion. We therefore have to assume that the cabinet was shifted in response to the strongest pulse of acceleration. For this case, we consider a target displacement of 12.7/1.84 ~ 7 cm to obtain an estimate of Agxeq with a 90% probability of nonexceedance. In this case the coefficient of friction is higher because the floor is concrete rather than tile; we assume a value of 0.45. Assuming the same range of Tp, we find that Agxeq values of roughly 0.3-0.55 g predict a target displacement of 5-8 cm. Although a more imprecise estimate, our analysis suggests Agxeq of approximately 0.4g; a severe level of shaking, but slightly lower than the iknferred shaking intensity at HVCV. The Digicel Building is situated towards the foot of a low ridge, the elevation of which is approximately 15 m higher than the terrain on either side. No aftershock recordings are available from this site.
Figure 9a (left) USB cabinet displaced across concrete floor by mainshock shaking at Digicel facility (from Goodno et al., 2011). 9b (right) Displacements corresponding to the range of Tp and Agx values shown, for an assumed =0.45.
Comparison with General Assessment of Macroseismic Effects
In the absence of instrumental strong motion data we compare our results with PGA estimated based on generalized assessments of damage and other effects. At the DB site, Goodno et al.
(2011) estimate PGA of 0.3-0.47g based on established general correlations between damage and shaking severity. Our quantitative estimate of 0.4g (0.33-0.55g) is consistent with their result.
There is no independent assessment of PGA or MMI at HVCV, but we can consider our results in light of observed macroseismic effects at this location and elsewhere. As discussed in the
introduction, very poorly built buildings adjacent to the site sustained catastrophic collapse, while the apparently very well-built Voila facility sustained significant non-structural and light
structural damage. These effects are, we conclude, generally consistent with MMI VIII, the indicators for which include extensive damage to unreinforced masonry, toppling of chimneys and monuments, and fall of loose partition walls. According to correlations established from instrumental data in California, MMI VIII corresponds to PGA values of 0.34-0.65g (Wald et al., 1999), again highly consistent with our quantitative estimate.
Given the availability of weak-motion amplification factors at HVCV, we can further consider the implications of our results for the severity of shaking in the parts of Port-au-Prince that
experienced relatively lighter damage (i.e., tan regions in Figure 1a). Analysis of aftershocks recorded across the array reveals average weak motion PGA amplification of 3.6 at station HVCV relative to hard-rock sites, with suggested resonance peaks at 2-3 Hz and 5-6 Hz (Hough et al., 2010; Hough et al., 2011). PGA amplification at HVCV relative to sites in the valley is a factor of ≈2. Given an estimated mainshock PGA of 0.5 ± 0.2g, and assuming linearity of
amplification, we can estimate approximate PGA values of 0.15-0.35g in the valley (e.g.,
HBME/HVGZ), and 0.08-0.19g at hard rock sites (HCEA) to the south, in the mountainous area south of Port-au-Prince.
As noted, based on consideration of documented effects at the structures shown in Figure 2, we conclude that MMI V-VI, is a reasonable assignment for the areas that experienced relatively light damage. Wald et al. (1999) infer PGA ranges of 3.9-9.2%g for MMI V and 9.2-18%g for MMI VI for earthquakes in California. McNamara et al. (2012) show that S and Lg-wave attenuation in Hispaniola is comparable to attenuation in California. Based on a general assessment of macroseismic effects, we thus conclude that PGA values of approximately 0.1-0.18g is a reasonable estimate for shaking severity in parts of Port-au-Prince where damage was
relatively light. The estimate from our quantitative analysis, 0.15-0.35g, is higher but overlaps with this range; we further note that the quantitative estimate is imprecise due to uncertainties in both the mainshock PGA value at HVCV and the estimated amplification factor.
One can additionally consider shaking levels predicted from ground motion prediction equations (GMPEs) established for other tectonically active, and presumably analogous, regions. Recently developed relations predict an average PGA on stiff-soil (NEHRP Class C) sites of approximately 0.15g for a M7.0 earthquake at 20-km distance (e.g., Campbell and Bozorgnia, 2006). We note that predicted PGA values from GMPEs provide only a rough estimate of shaking. In this case, among other issues, it is not clear what distance is appropriate, since the main mainshock moment release was primarily to the west of the epicenter and the extent of mainshock rupture towards the east of the epicenter is not well constrained.
The above considerations, as well as the lack of substantial damage to over half of the houses in Port-au-Prince despite pervasively poor construction, suggest that much of Port-au-Prince experienced relatively moderate mainshock ground motions, on the order of ≈0.2g, not levels commensurate with MMI values of VIII or above. Locally higher shaking levels were
experienced at sites with significant local amplification.
Discussion and Conclusions
We have presented a detailed forensic analysis of two cases of dopcumented rigid body displacement to obtain quantitative estimates the severity of ground motions in Port-au-Prince during the 12 January 2010 Haiti earthquake. From detailed analysis of the batterygram record observed at station HVCV we estimate a range of mainshock PGA values of 0.3-0.7g at the location where aftershock recordings reveal the highest local amplifications among the recording sites deployed by Hough et al. (2010) and where a swath of high damage occurred. Because this level of shaking corresponds to a 90% probability of nonexceedence, this estimate is considered conservative. Combining this estimate with the weak-motion amplification factors estimated by Hough et al. (2011), we estimate PGA of approximately 0.2g for the regions of the central Port-au-Prince metropolitan region that experienced relatively light damage. This estimate is
relatively imprecise, but it is consistent with shaking intensity estimated from a general assessment of macroseismic effects, and from GMPEs. We thus conclude that mainshock shaking severity was approximately MMI VI in much of Port-au-Prince (i.e., away from
significant sediment-induced or topographic amplification effects), and approximately MMI VIII at sites of strongest local amplification.
The results generally confirm the conclusion based on weak-motion data that local amplifications, in some cases associated with topographic effects, increased shaking intensity by approximately two units, from MMI VI to VIII. A future rupture of the Enriquillo Plantain Garden fault segment closest to Port-au-Prince is expected to generate higher near-field ground motions within the city than those generated by the 2010 earthquake. Ground motions from such an event are expected to be especially severe at sites with strong local amplification. More generally, our results illustrate how documented horizontal rigid body displacement during earthquakes can be used to obtain quantitative estimates of peak ground acceleration in the absence of instrumental recordings.
Acknowledgements
The authors express their appreciation to Gerard Laborde and Gregory Domond of Voila
Corporation for their support, without which the deployment in general and this investigation in particular would not have been possible. We further thank Mehmet Celebi and Robert Dollar for constructive reviews that significantly improved the manuscript. The research was supported by the US Agency for International Development (USAID)-Office of Foreign Disaster Assistance (OFDA).
Bibliography
Aki, K. Local site effects on weak and strong ground motion, Tectonophysics, 218, 933-111 (1993). Assimaki, D., G. Gazetas, and E. Kausel, Effects of local soil conditions and topographic
aggravation of seismic motion: Parametric investigation and recorded field evidence from the 1999 Athens earthquake, Bull. Seism. Soc. Am. 95, 1059-1089 (2005).
Atkinson, G. and D. Wald. Modified Mercalli Intensity: A surprisingly good measure of ground motion,
Seism. Res. Lett. 78, 362-368 (2007).
Bommer, J.J. and J.E. Alarcon, The prediction and use of peak ground velocity, J. Earthq. Eng. 10, 1-31 (2006).
Borcherdt, R.D. and J.F. Gibbs, Effects of local geology on ground motion near San Francisco Bay, Bull. Seism. Soc. Am., 60, 29-61 (1970).
Bouchon, M., C.A. Schultz, and M.N. Toksoz, Effect of three-dimensional topography on seismic motion, J. Geophys. Res. 101, 5835-5846, (1996).
Calais, E. Y. Mazabraud, B.M. de Lepinay, P. Mann, G. Mattioli, and P. Jansma, Strain partitioning and fault slip rates in the northern Caribbean from GPS measurements, Geophys. Res. Lett. 29, doi: 10.1029/2002GL015397 (2002).
Calais, E., A. Freed, G. Mattioli, F. Amelung, S. Jonsson, P. Jansma, S-H. Hong, T. Dixon, C. Prepetit, and R. Momplasir, Transpressional rupture of an unmapped fault during the 2010 Haiti earthquake, Nature Geoscience 3, 794-799, doi:10.1038/NGEO992 (2010).
Choi, B. and C.C.D. Tung, Newmark’s formula for estimating sliding displacement of an unanchored body subjected to earthquake excitation, trans., SMiRT 16, paper 1987, Washington DC (2001).
Cox, B.R., J. Bachhuber, E. Rathje, C.M. Wood, A. Kottke, R. Green, and S. Olson. Shear-wave- velocity and geology-based seismic microzonation of Port-au-Prince, Haiti, Earthquake
Spectra (2011).
Goodno, B.J., N.C. Gould, P. Caldwell, and P.L. Gould. Effects of the January 2010 Haitian earthquake on selected electrical equipment, in press, Earthquake Spectra (2011).
Hayes, G.P, R.W. Briggs, A. Sladen, E.J. Fielding, C. Prentice, K. Hudnut, P. Mann, F.W. Taylor, A.J. Crone, R. Gold, T. Ito, and M.Simons, Complex rupture during the 12 January 2010 Haiti earthquake, Nature Geoscience 3, 800-805, doi:10.1038/NGEO977 (2010).
Hinzen, K-G., Simulation of toppling columns in archaeoseismology, Bull. Seism. Soc. Am. 99, 2855-2875, doi:10.1785/0120080241 (2009).
Hough, S.E., Altidor, J.R., Anglade, D., Benz, H., Ellsworth, W, Given, D., Hardebeck, J., Janvier, M.G., Maharrey, J.Z., Mazabraud, Y., McNamara, D., de Lepinay, B.M.,
Meremonte, M., Mildor, B.S-L., Prepetit, C., and Yong, A.. Localized damage associated with topographic amplification during the 12 January 2010 M7.0 Haiti earthquake, Nature Geoscience 3, 778-782 (2010).
Hough, S.E., Altidor, J.R., Anglade, D., Given, D., Janvier, M.G., Maharrey, J.Z., Meremonte, M., Mildor, S-L., Prepetit, C., and Yong, A.. Site response and site characterization in Port-au-Prince, Haiti, in press, Earthq. Spectra. (2011).
Mann, P., G. Draper, and J.F. Lewis, An overview of the geologic and tectonic development of Hispaniola, Geol. Soc. Am. Special Paper 262, 1-28 (1992).
Ministere de l’Ecologie, du Developpement et de l’Amenagement Durable (MEDAD), Le Seisme de Chuetsu-Oki (Japon) du 16 Juillet 2007, Association Francaise du Genie Parasismique, Paris (2007)
Miyamoto, H.K., A.S.J. Gilani, and K. Wong, Massive damage assessment program and repair and reconstruction strategy in the aftermath of the 2010 Haiti earthquake, Earthq. Spectra, 27, S219-237, doi:10.1193/1.3631293 (2011).
Newmark, N.M. Effets of earthquakes on dams and embankments: Fifth Rankine Lecture, Geotechnique 15, 139-160 (1965).
Pischiutta, M., G. Cultrera, A. Caserta, L. Luzi, and A. Rovelli, Topographic effects on the hill of Nocera Umbria, central Italy, Geophys. J. Int. 182, 977-987 (2010).
Sanchez-Sesma, F. J., Diffraction of elastic SH waves by wedges, Bull. Seism. Soc. Am. 75, 1435- 1446 (1985).
Shenton, H.W. and N.P. Jones, Effect of friction and restitution on rocking motions, Earthq. Eng., Tenth World Conference, 1933-1938 (1992).
Singh, S.K. E. Mena, R. Castro, et al., Some aspects of source characteristics of the 19 September 1985 Michoacan earthquake and ground motion amplification in and near Mexico City from strong motion data, Bull. Seism. Soc. Am. 78, 451-477, (1988).
Taniguchi, T., Non-linear response analyses of rectangular rigid bodies subjected to horizontal and vertical ground motion, Earthq. Eng. and Structural Dyn., 31, 1481-1500, doi: 10.1002/eqe/170 (2002)
Taniguchi, T. and T. Miwa, Slip displacement analysis of freestanding rigid bodies subjected to
earthquake motions,” 13th World Conference of Earthquake Engineering, Paper No. 437,
2004.
Taniguchi, T., and T. Miwa, A simple procedure to approximate slip displacement of freestanding rigid body subjected to earthquake motions, Earthq. Eng. and Struct. Dyn, 36, 481-501, doi:
Wald, D.J., V. Quitoriano, T.H. Heaton, and H. Kanamori, Relationships between peak ground
acceleration, peak ground velocity, and modified Mercalli intensity in California, Earthq. Spectra 15, 557-564 (1999).