AN EMPIRICAL STUDY OF DEVELOPMENT VISUALIZATION FOR PROCUREMENT BY IN-PROCESS MEASUREMENT DURING INTEGRATION AND TESTING
13
0
0
全文
(2) and testing phase. This method also defines a process model for the development phase.. visualization and information sharing. Each of the 14 actions is described below.. 2.2 Structure of the Process Model. 1) Verify requirements functions In this activity, review and verification of products from the specification and requirements phase is conducted. This includes products from requirements definition, system design, project planning, and the system architecture design (SA). This activity often identifies a lack of decision about generalized criteria for "what," "how far," and "in what way" in the specification and requirements phase. During this activity, we recommend checking subjects that should be determined during specifications and requirements such as the request for proposal (RFP), cost, quality, customer, risk, communication and the legal issue related to the procurement contract.. The process model for the development phase defines 14 actions, or micro processes, arranged in four functional blocks. This is shown in Figure 1 [8]. Considering a time axis extending to the right from the left margin, the development phase is located between the requirements and specifications phase (requirements phase) and the integration and testing phase (integration phase). Project planning (project management), and project rule activities pass through these three phases. Four functional blocks show main activity of this phase. Ten arrows show interaction activity between these activities. The measurement target project described after was not quite recommended along with the model shown here. Then correspondence of the general process name used in the measurement target project and our model is shown in figure 1. For example, number one, Requirement Function Verification corresponds to the System Architecture design (SA). Number six, Software Design corresponds to the User Interface (UI), the System Structure (SS), and the Program Structure (PS) design. Number 10, Programming and Unit Test correspond to Programming (PG) and Program Test (PT). Integration Test (IT), System Test (ST), and Operational Test (OT) from the integration and testing phase follow this.. A complete review with all related persons is a practical method for conducting this verification. To make this activity most successful, close collaboration between the procurement organization and the developers is important. 2) Reconfirm requirements definition Retrace and correct the requirements definition and system design to remove defects found in Requirements Function Verification (1). This may be difficult work, however projects that neglect it encounter trouble. This work may require management decisions such as re-examination and renegotiation of contracts.. During the entire process, collaboration between procurement organization and the developers is supported by process. Requirements Phase. Development Phase. Project Planning (Project Management), Project Rule 14 4 5 Integration/System Test Planning 13 Requirement Requirement 9 12 Definition Function Programming System Software Verification Design Design 6 Unit Test 10 1 2 7 SA UI/SS/PS 11 PG/PT. 3. Integration Phase. Integration Test System Test IT/ST. OT. 8. External World Restriction SA: System Architecture, UI: User Interface Design, SS: System Structure Design, PS: Program Structure Design, PG: Programming, PT: Program Test, IT: Integration Test, ST: System Test, OT: Operation Test Fig.1 Development Phase Process Model [8].
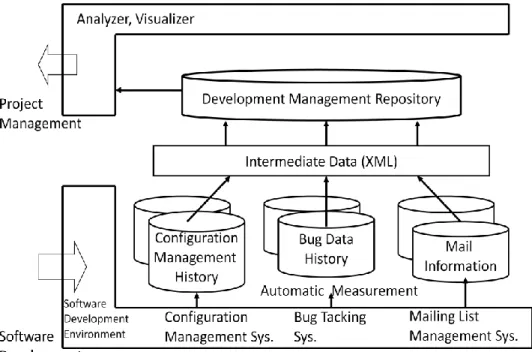
(3) 3). Re-examine requirements definition and system design based on implementation verification Verify results of the verification and changes described in (1) and (2) by considering the system implementation from the viewpoint of customer characteristics and external restrictions. These points must be verified from the viewpoint of various experts and responsible individuals related to the target system to develop necessary strategies. As part of this, procurement organization must also make positive contributions. 4). Re-examine project planning based on requirements and design changes Changes identified and made in (1) to (3) must be reflected in project planning. Generally, these changes may be difficult to perform, and require collaboration from procurement organization, project management, and developers. Management decisions may be required. 5) Make integration and system test scenarios Based on the information and changes described in (1) to (4), develop integration test (IT) and system test (ST) scenarios. This action should be started early in the project. 6) Produce software design Based on the results of (1) to (3), the developers should produce the software design. This includes the user interface design (UI), the system structure design (SS), and program structure design (PS). Doing this work may make defects in the previous work visible, which requires rapid escalation and resolution. 7). Re-verify requirements definition based on software design. Whenever defects are detected during software design (6), the requirements definition should be re-verified. The influence of this action may be far-reaching and un-localized, so follow up across the project is required. Additionally, as described in (9), such changes should be reflected in the test scenario. Contribution by the procurement organization is essential. 8). Verify feasibility based on software design. Verify and confirm the various constraint conditions described in the abovementioned 6) the Software Design. Review various restrictions and recode them in documents. Result of the verification and the recoded document will be utilized in subsequent processes. 9). Prepare integration and system test scenarios. Incorporate results of the software design (6) into the integration test (IT) and system test (ST) scenarios. This action should be started as early as possible. 10) Prepare programming and unit tests Based on results of the software design (6), prepare programming and unit tests. This activity has a tendency to be a black box performed by each responsible person. However, providing visibility into this activity is important, especially since defects detected in this activity may force revision of the software design (6).. 11) Return to software design based on programming and unit test results Defects detected during preparation of programming and unit tests (10) cause a return to the software design (6). This includes maintenance and consistency of documents. It is important to maintain conformity between programming activities and documentation. 12) Feedback from unit test results to integration and system test scenarios Results from preparation of programming and unit tests (10) should be incorporated into the integration and system test scenarios prepared in (9). 13) Plan integration and system testing On the basis of (1) to (12), make plans for integration and system test scenarios. There is a tendency to leave this entirely up to the development vendors, however, contributions by procurement organization can help assure that application, service, and operations viewpoints are given adequate support. 14) Readjust project plan Although frequently extremely difficult, when necessary, it is essential to execute this action. Collaboration between the procurement side and the development vendor is necessary.. 3. PROJECT MEASUREMENT PLATFORM EPM Empirical Project Monitor (EPM) is a software project measurement platform designed to execute automatic project measurement. The original model was developed in a Japanese software engineering research project named Empirical Approach to Software Engineering (EASE) project (2003–2008) under the form of industry and academia collaboration. Thereafter, EPM was strongly enhanced in function and quality to meet the commercial software product levels by SEC/IPA, which had been established since 2004 as a governmental research organization for software industry promotion. The basic functions are as shown in Figure 2. This system automatically collects software processand product management-related data from the configuration management system, the bug tracking system, and the mailing management system in the software development environment. Further, it analyzes and visualizes these data into useful forms for project management. After the usefulness of EPM was verified in certain verification projects, it has been adopted in over 70 real industrial development projects and evaluated [1][2][12]-[16]. The measurement and visualization targets in EPM include, for example, source line of code number transition, cumulative bug number transition, remaining bug number transition, average bug residences time transition, and mail number transition. Further, EPM is able to analyze and visualize administrative information that is stored in the configuration and bug tracking systems into useful form for project management..
(4) Fig.2 Structure of EPM [1][2]. 4. OUTLINE OF THE TARGET PROJECT AND MEASUREMENTS 4.1 Target Project For this case study, the target project was a midscale system requiring relatively high reliability ordered by a user company to a software development vendor company. The development project was developed in cooperation by the prime contractor system integrator company along with some partner vendor companies in a hierarchical structure commonly used in the Japanese software industry. The user company had been significantly involved in the requirements definition and the operational testing phases. However, during the development phase, their project management role was reduced to hearing declarative style reports from the vendor companies, a common change in participation for Japanese user companies. The authors had used EPM to automatically collect measurements of this project during 16 weeks of integration testing (IT) and system testing (ST) which composed the integration and testing phase. The specific measurement targets were configuration management and bug tracking data. The collected data was analyzed after completion of the integration and testing phase. During the test (IT/ST) phase, there was no feedback from the data analysis to project management.. 4.2 Collected Data and Visualized Items In this case study, various data were collected from the configuration management system and the bug tracking system. Table 1 shows the collected data and examples of visualized items. Transition graphs made information about the source code visible during the integration test (IT) and the system test (ST) phase. Analysis of the bug reports made various characteristics of the product visible.. The meaning of “undetected bug cause” is the reason why the bag was undetected. For example, slip out of test, slip out of test item, so on and it was recorded into the bug report until the bug was closed. Table 1 Collected Data and Visualized Items Data Source. Collected Data Check-in Timing. Examples of visualized items Check-in Timing. Configuration Management System. Check-out Timing. Check-out Timing. Check-out Frequency. Check-out Frequency. Bug Tracking System. Sourse Line of Code(SLOC) Transition Chart of at Check-in Timing Accumulated SLOC Transition Chart of Bug Detected Date Accumulated Bugs Distribution Chart of Bug Bug Status Status Transition Chart of Remaining Bugs Bug Closed Date Transition Chart of Average Bug Resolution Times Transition Chart of Bug Bug Introduction Phase Introduction Phases Distribution Chart of Bug Bug Cause Causes Distribution Chart Of Undetected Bug Causes Undetected Bug Causes Distribution Chart Of Destination Modules For Bug Resolution Requests Bug Resolution Reports Distribution Chart Of Source Modules For Bug Resolution Requests.
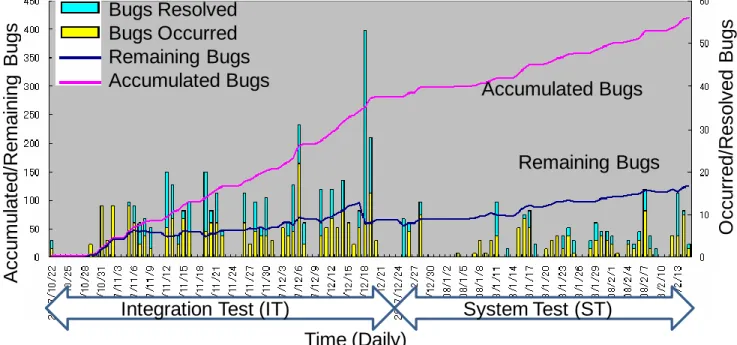
(5) Accumulated Bugs. Remaining Bugs. Integration Test (IT). Occurred/Resolved Bugs. Accumulated/Remaining Bugs. Bugs Resolved Bugs Occurred Remaining Bugs Accumulated Bugs. System Test (ST) Time (Daily). Fig.3 Daily Bug Information Transition Chart. 5. MEASUREMENT RESULTS 5.1 Visualized Phenomena 1) Overall situation of the measured process Figure 3 shows the transition chart of the daily bug information over the 16 weeks. This transition chart corresponds to the integration test (IT) and system test (ST) phases following the programming and unit test (PG/PT) phase. Measurements were terminated two weeks prior to the termination date of the ST phase. In total, 420 bugs were detected. The transitions in the cumulative bug numbers clearly display energetic action on tests during this period. From the transition chart of the remaining bug numbers, it is also clear that there are remaining quality issues. These quality issues were observed in all phases as the number of remaining bugs never reached zero, and remaining bugs from the IT phase were carried over into the ST phase. The histograms showed daily detected and resolved numbers of bugs. The total number of bugs detected in the ST phase was relatively small compared to the number of bugs detected in the IT phase, however, the accumulation of bugs makes it difficult to close out the ST phase on schedule. Figure 4 presents the check-in timing (vertical line), the check-out timing, and the frequency (histogram) during this phase.. Fig.4 Check-in Timing & Check-out Timing/Frequency 2) Integration test (IT) phase situation Figure 5 is a pareto graph showing the number of bugs introduced in different phases that were detected in the IT phase. The number of bugs introduced is greatest in the programming (PG) phase and the system structure design (SS) phase, followed by the integration test (IT) phase itself. Characteristically, various issues were associated with the system structure design and programming phase, however, considerable degradation was observed in the integration test phase. Figure 6 aggregates bug causes from the bug reports of the integration test phase. Characteristically, the largest number of bugs was attributed to "specification." This suggests that there were issues in the specification verification process, which should have detected such bugs well before the integration test phase..
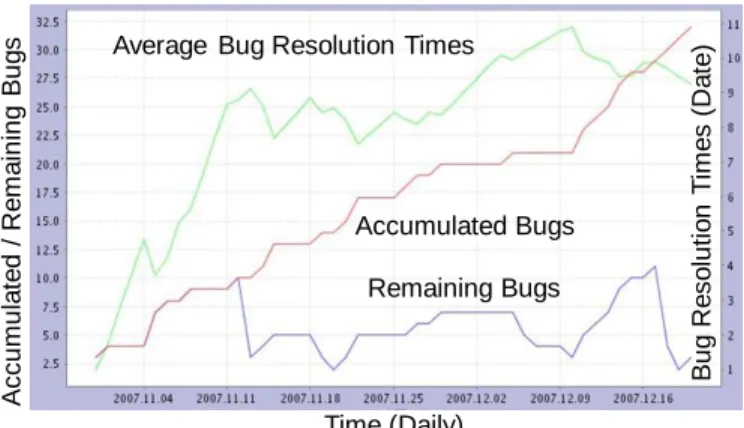
(6) Figure 7 aggregates causes for undetected bugs from the bug reports of the integration test phase. These results suggest that there were issues with the unit test phase. Figure 8 aggregates bug causes using a different categorization. Based on this analysis, serious bug cases such as "logical error," "interface error," and "data definition error" are the three major types of error. This analysis also suggests that there were issues with the design and specification verification phase, rather than in the programming and unit test phase. Figure 9 is a crossing analysis graph that shows the bug causes in each phase. This analysis points out issues with the system structure design (SS) phase.. Bug Number. PG: Programming SS: System Structure Design (Detail Design) IT: Integration Test UI: User Interface Design (Basic Design) PS: Program Structure Design (Program Design) PT: Program Test PG. SS. IT. UI. PS. PT. others. Bug Introduced Phase. Fig.5 Bug Introduced Phase (IT phase). Accumulated Ratio. These figures clearly indicate that three or four modules (e.g. A, B, C, D or E) had high numbers of bugs. In further analysis, the authors analyzed bug transitions in the top three modules using the data search function of EPM. Figure 12- figure 14 are multiplex line graphs that present transition charts of the accumulated numbers of bugs, remaining numbers of bugs, and the average bug resolution times for these top three modules. While each module clearly has energetic test and debugging activity, the number of detected bugs was increasing rapidly prior to termination of the test phase. Also, in the case of modules B and C, the ST phase was started before the number of remaining bugs detected in the IT phase reached zero.. Fig.6 Bug Causes Distribution (IT phase). 1.Slip Out of Test 2.Slip Out of Test Item 3.Test Result Verification Miss 4.Othes 5.Environment Issue. Bug Number. Bugs detected in the IT phase did not occur homogenously in the system. Figure 10 shows the bug resolution request destination modules, while figure 11 shows the bug resolution source modules. When the integration and the system test are done for each module, the module by which the bug was discovered, and the module of the fundamental target for repair are not always the same. This first bug discovered module is called bug resolution request module and the module for repair is called a bug resolution destination module. This information was recorded into the bug report until the bug was closed.. 1. 2. 3. 4. Undetected Bug Causes. Fig.7 Undetected Bug Causes (IT phase). Fig.8 Bug Causes (IT phase). 5.
(7) Bug Causes. Bug Number. IT: Integration Test PG: Programming PS: Program Structure Design (Program Design) PT: Program Test SS: System Structure Design (Detail Design) UI: User Interface Design (Basic Design). 2. 1. 1.Data Definition Error 2.Logical Error 3.Format Error 4.Interface Error 5.Others 6.Table Definition Error. 34. 234. 1 12 45. Others. 4. 5. 5. 2. IT. PG. 2 4. 234. PS. PT. 56 123. SS. UI. Bug Introduced Phase. Average Bug Resolution Times. Accumulated Bugs Remaining Bugs. Bug Resolution Times (Date). Accumulated / Remaining Bugs. Fig.9 Bug Causes in each Phase (IT phase). Time (Daily). Fig.10 Bug Resolution Request Destination Module (IT phase). Fig.11 Bug Resolution Request Source Module (IT phase). Average Bug Resolution Times. Accumulated Bugs Remaining Bugs. Time (Daily) Fig.13 Bug Number Transition (Module B) (IT phase). Bug Resolution Times (Date). Accumulated / Remaining Bugs. Fig.12 Bug Number Transition (Module A) (IT phase).
(8) Remaining Bugs. Bug Number. Accumulated Bugs. Source Line of Code. SLOC. Bug Resolution Times (Date). Accumulated / Remaining Bugs. Average Bug Resolution Times. Accumulated Bug Number. Time (Daily). Fig.14 Bug Number Transition (Module C) (IT phase). Time (Daily). Fig.15 Source Line Code Number Transition and Accumulative Bug Number (ST phase). 3) System test (ST) phase situation Figure 15 provides a transition chart showing the developed number of source lines of code and the accumulated number of bugs in the ST phase following the IT phase. Despite the test phase label, it is clear that the number of source lines of code was increasing and that energetic debugging activity was being performed. The last data measurements are from two weeks before the deadline of the ST phase. At this point, bug detection was continuous and it appeared difficult to complete this phase on schedule. Figure 16 shows the final situation of this measurement, which includes the presence of many unsolved bugs. Figure 17 illustrates the phase of introduction attributed to each bug. Various bugs introduced in the system structure design (SS) and user interface design (UI) phases were detected, and several of these bugs were unsolved.. Bug Number. Fig.16 Bug Status at the End of Measurement. SA. System Architecture Design (Requirement Function Verification) UI. User Interface Design (Basic Design) 1 SS. System Structure Design (Detail Design) PS. Program Structure Design (Program Design) 1 2 PG. Programming. 1.Closed 2.Under Testing 3.Others 4.Under Investigation 5.Under Correcting 1 5 1. SA. 2. 3 4. 2. 4. UI. 1. SS. 45. PS. Bug Introduced Phase. Fig.17 Bug Status by each Bug Introduced Phase (ST phase). 2. 4 5. PG.
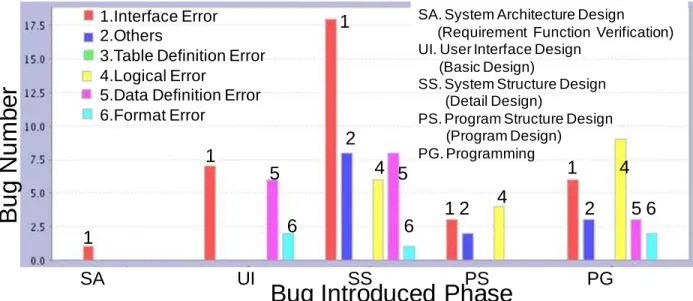
(9) Bug Number. PS. Program Structure Design (Program Design) PG. Programming. PS. PG. UI. User Interface Design (Basic Design) SS. System Structure Design (Detail Design) SA. System Architecture Design (Requirement Function Verification). UI. SS. Bug Introduced Phase. SA. Fig.19 Bug Causes Detected in ST phase. Bug Number. Fig.18 Bug Introduced Phase (ST phase). 1.Others 2.Slip-up Spec. 3.Others 4.Un-checked Correction 5.Simple miss 6.Un-checked reuse 7.Lack of Spec. Understanding 8.Others 9.Lack of Spec. Verification. 13. SA. 1 10.Slip-up Spec. 11.Lack of Programming Language Knowledge 12.Ambiguity 13.Lack of Description 14.Standard Violation 15.Descripton Error 16.Communication Error 17.Miss-much Documents. 10 15 11 1013 2 1 12 12 9 6 8 13 5 1617 2. 1. UI. Requirement Ver. Basic Design. SS. 5 4 9. 7 11. PS. Detail Design Program Design. 2. 9 67. 1. 10 11. PG Programming. Bug Introduced Phase Fig.20 Bug Causes by Introduced Phase (ST phase) Figure 18 provides a pareto chart of the phase of introduction of bugs. This indicates issues in program structure design (PS), programming (PG), and user interface design (UI) phases. Figure 19 analyzes the bug causes. Again, the presence of many "specification" related bugs suggests issues with the requirements verification phase and the design phase. Figure 20 analyzes bug causes in terms of phase of introduction. This analysis suggests various issues in the system structure design phase (SS). Figure 21 accumulates the total bug causes detected in the ST phase. Similar to the IT phase, essential errors such as Interface error, Logical error, and Data Definition error occur in the greatest numbers.. Fig.21 Bug Causes (ST phase).
(10) Bug Number. 1.Interface Error 2.Others 3.Table Definition Error 4.Logical Error 5.Data Definition Error 6.Format Error. SA. System Architecture Design (Requirement Function Verification) UI. User Interface Design (Basic Design) SS. System Structure Design (Detail Design) PS. Program Structure Design (Program Design) PG. Programming. 1. 2 1. 12 6. 1 SA. UI. 4. 1. 4 5. 5. 4. 2. 56. 6 SS. PS. PG. Bug Introduced Phase. Further, in the ST phase, bugs were not detected homogeneously. Figure 23 shows detected bugs in the ST phase by program modules. For example, in module B, a lot of bugs were detected at both the IT and ST phases. Figure 24 shows the bug number transition of module B. Various bugs were detected in the ST phase and the number of unsolved bugs increased; this makes the termination of the phase on time appear difficult.. Average Bug Resolution Times. Accumulated Bugs. Remaining Bugs. Bug Resolution Times (Date). Figure 22 shows bug causes by bug introduced phase; it is clear from this figure that there are various essential bugs introduced in the System Structure Design (SS), the User Interface Design (UI) and the Program Structure Design (PS) phases.. Accumulated / Remaining Bugs. Fig.22 Bug Causes by each Introduced Phase (ST phase). Time (Daily). Fig.24 Bug Number Transition of Module B. 5.2 Comparison with the development phase process model. Fig.23 Bug Number by each Module (Detected in ST phase). Typically, the actual status of the development phase is largely a black box for procurement. However, as described above, a number of issues with development were made visible by comparing the results of EPM measurements with the development phase process model. Figure 25 includes figure numbers from above that suggest the presence of various issues in each phase. We do not know whether this target project used the process shown in figure 1 or not. However, considering this model as a logical model, each of the actions or micro processes must be accomplished. Based on measurement results from the IT and ST phases, the actions or micro processes in the development phase were not effectively performed. The results of this analysis indicate that bugs detected in the integration and testing phase were introduced in the programming and unit test phases, but also in the software design phases. Additionally, various bugs were introduced due to insufficient verification of the requirements definition. These results suggest.
(11) 8,22 Requirement Function Verification 8,19. Integration Phase. Development Phase. SA. Integration/System Test Planning Software Design UI/SS/PS. 6 6,19,21. 17,18. Programming/ Unit Test PG/PT. OT. IT/ST. 7. 5,18. 5,9. Integration Test/ System Test. 5. 15,16. 9,17,18,20. Fig.25 Issue Suggested Micro-process in the Development Phase (Corresponded Figure Numbers) that feedback between the activities or micro processes during the development phase was insufficient.. 2). These measurements make visible issues with the development phase and the integration and testing phase.. 3). Issues associated with the development phase can be used as part of the transition decision between a development project and subsequent operations, which is an important part of project management.. 4). Also, visibility of these issues can help make operation and maintenance decisions.. 5). Finally, visibility of these issues may be used to make decisions about later projects and process improvement.. 6. STUDY ON THE USEFULNESS OF MEASUREMENTS Figure 26 presents the model for measurement and feedback used in this case study along with the V-model suited the view of ISO 12207. 1). Execute in process measurements during the integration and testing phase and analyze the results.. Procurement Side Vendor Side Requirements Collaboration. V-model. Phase. Integration Phase. Operation Phase. 1 Vender Side Leadership. 5. Development Phase. 2 3. Fig.26 Measurement and Feedback Model suited to the V-model view. 4.
(12) As the issues uncovered in this case study showed, insufficient verification of requirements for some modules during development, additional design reviews, and similar problems may require readjustment of project planning. However, to execute these actions, aggressive collaboration with procurement is essential. Such changes cannot be effectively enforced while maintaining the black box status of the development process. This case study verified that project visibility based on in-process measurement data collected by platforms such as EPM allows information sharing between procurement organization and developers, to support proactive project management. This case study presents an approach to satisfying the empirical information needs to allow such collaboration. Finally, the use of project measurements and visualization of analysis results indirectly warns against poor development activities. When the development phase is removed from the black box, transparency of the process and product allows compliance with standardized process models, which can be expected to yield high reliability and productivity.. 7. CONCLUSIONS For both waterfall and procurement software projects, although it is generally agreed that collaboration between procurement organization and developers provides the best environment for development, there is a tendency for the development process to become a black box to procurement organization. This empirical case study verified that in-process measurements during the integration and testing phase helps make various issues from the development phase more visible and provides useful information for project management and process improvement. The case study used the in-process measurement platform called EPM along with a development phase process model called "MIERUKA" that was defined by the research task force, made up of professionals with several years experience in this field. The case study provides evidence of the effectiveness of inprocess measurement. It also provides evidence for the effectiveness of using in-process measurement of one phase to help make visible problems in earlier phases. The case study also demonstrated the usefulness for project management of combining the results of in-process measurement with a process model. Finally, the case study demonstrates one way to use a development phase process model based on accumulated experience. This case study, along with previous studies, highlights the usefulness of in-process measurements for various stakeholder groups involved in software development. For example, such measurements provide visibility into the development process for the procurement organization and project management. Such measurements also provide visibility and communications for prime contractors and subcontractors, which is an approach commonly used in Japan that is growing increasingly complicated with offshore development. Combining information from software project repositories, process models and standardized descriptions such as UML diagrams, and in-process measurements can provide procurement, project management, and developers with unprecedented visibility into the software process from specifications and requirements through development and into integration and test. Combining this with the software tag approach being developed in the StagE. project will extend the availability of this information even further, allowing maintainers and users to benefit from this increased visibility into the former black-box of development [17]-[19]. Further, the use of automated support systems such as EPM to perform the in-process measurements minimizes the impact on developers by extracting the necessary information from existing tools such as source code version control systems, defect tracking systems, and project email lists. Although this is only a single case study, the evidence points toward the usefulness and effectiveness of performing such inprocess measurements using an automated system such as EPM, combined with process models and other descriptions of the software development project drawn from professional experience. Especially when compared with similar information extracted from a repository of data about software projects, this provides a strong basis of information for making decisions that are empirically based.. 8. ACKNOWLEDGEMENT This work is supported by SEC/IPA, METI, and MEXT of Japan. We thank researchers in the SEC, “MIERUKA” task force, and StagE project who kindly supported this project. We thank both software procurement and development companies who kindly supported project measurement. We thank EPM development companies and related individuals, CATS Co., Ltd., EASE Research Institute LLC., Hitachi Systems & Services, Ltd, and SRA Key Technology Laboratory, Inc., who supported this measurement.. 9. REFERENCES [1] Masao Ohira, Reishi Yokomori, Makoto Sakai, Ken-ichi Matsumoto, Katsuro Inoue, Koji Torii: Empirical Project Monitor: A Tool for Mining Multiple Project Data: International Workshop on Mining Software Repositories (MSR2004), pp.42-46, 2004 [2] Yoshiki Mitani, Nahomi Kikuchi, Tomoko Matsumura, Naoki Ohsugi, Akito Monden, Yoshiki Higo, Katsuro Inoue, Mike Barker, Ken-ichi Matsumoto: A Proposal for Analysis and Prediction for Software Projects Using In-Process Measurements and Collaborative Filtering of a Benchmarks Database, Journal of Software Measurement, Vol.1-1, pp.111, 2007 [3] Philip M Johnson: Requirement and Design Trade-offs in Hackystat: An In-Process Software Engineering Measurement and Analysis System. International Symposium on Empirical Software Engineering and Measurement (ESEM2007), Madrid, Spain, pp.81-90, 2007 [4] M. Ciolkowski, J. Heidrich, J. Münch, F. Simon, and M. Radicke: Evaluating Software Project Control Centers in Industrial Environments. International Symposium on Empirical Software Engineering and Measurement (ESEM2007), Madrid, Spain, pp.314-323, 2007 [5] Alberto Colombo, Ernesto Damiani, Fulvio Frati, Sergio Oltolina, Karl Reed, Gabriele Ruffatti : The Use of a MetaModel to Support Multi-Project Process Measurement, Asia Pacific Software Engineering Conference (APSEC2008), Beijing, China, pp.503-510, 2008.
(13) [6] Robert Neumann, Fritz Zbrog, Reiner Dumke: Cockpit Based Management Architecture, IWSM/Mensura2009, Amsterdam, Netherlands, pp.87-100, 2009 [7] SEC/IPA: “MIERUKA”, Visualization of IT Project, The Upper Development Phase version, (In Japanese partially under translating into English). Nikkei-BP, P.208, 2007 [8] SEC/IPA: “MIERUKA”, Visualization of IT Project, The Middle Development Phase version (In Japanese, partially under translating into English). Nikkei-BP, P.167, 2008 [9] SEC/IPA: “MIERUKA”, Visualization of IT Project, The Lower Development Phase version (In Japanese partially under translating into English). Nikkei-BP, P.211, 2006 [10] SEC/IPA: “MIERUKA”, Visualization of IT Project, The Summary version (In Japanese partially under translating into English). Nikkei-BP, P.135, 2008 [11] Hiroshi Ohtaka, Ryzo Nagaoka, Visualization of IT Project – MIERUKA –, The 4th International Project Management Conference (ProMAC2008), Anchorage, USA, 2008 [12] Yoshiki Mitani, Hiroshi Ohtaka, Ryozo Nagaoka, Hiroyuki Yoshikawa, Seishiro Tsuruho: A Proposal for Integration of In-process Project Visualization and Keeping Post-process Traceability, "MIERUKA" Method and 'Software Tag" Framework. Workshop on Accountability and Traceability in Global Software Engineering (ATGSE2008), Beijing, China, 2008-12, pp.11-12, 2008 [13] Hiroshi Ohtaka, Yoshiki Mitani, Yoshiaki Fukazawa: Proposal for Applying the MIERUKA of IT Project to Non Japanese Asian Countries: ProMac Symposium 2009, Bangkok, Thailand, 2009-10 [14] Yoshiki Mitani, Hiroshi Ohtaka, Noboru Higuchi, Ken-ichi Matsumoto: A Proposal for an Integrated Measurement. and Feedback Environment for Software Projects Based on the Empirical Study of Three Measurement Domains – Industrial Track paper; IWSM/Mensura2009, pp.29-32, 2009-11, Amsterdam, Netherland, 2009 [15] Yoshiki Mitani, Nahomi Kikuchi, Tomoko Matsumura, Satoshi Iwamura, Mike Barker, Ken-ichi Matsumoto: An empirical trial of multi dimensional in process measurement and feedback on a governmental multi-vendor software project: International Symposium on Empirical Software Engineering (ISESE2005) vol.2 pp5-8; Noosa Heads, Australia, 2005 [16] Yoshiki Mitani, Nahomi Kikuchi, Tomoko Matsumura, Satoshi Iwamura, Yoshiki Higo, Kasturo Inoue, Mike Barker, Ken-ichi Matsumoto: Effect of Software Industry Structure on a Research Framework for Empirical Software Engineering: International Conference on Software Engineering (ICSE2006), Far East Experience Track, Poster Session; pp.616-619, Shanghai, China, 2006 [17] Katsuro Inoue: Software Tag Standard 1.0 -Background and Definition- 2nd Workshop on Accountability and Traceability in Global Software Engineering (ATGSE2008), pp.31-32, Beijing, China, 2008 [18] Michael Barker, Ken-ichi Matsumoto, Katsuro Inoue: Putting a TAG on Software: Purchaser-Centered Software Engineering. In Handbook of Research on Software Engineering and Productivity Technologies: Implications of. Globalization, Ramachandran, M., and Carvalho R. A., Eds. InformationScience Reference, Hershey, PA, pp.38-48, 2009 [19] Kasturo Inoue, Software Tag for Traceability and Transparency of Maintenance. 24th IEEE International Conference on Software Maintenance (Beijing, China, Sep. 28 - Oct. 4, 2008). ICSM 2008, pp.476-477, 2008.
(14)
図

+4


関連したドキュメント
Keywords: Convex order ; Fréchet distribution ; Median ; Mittag-Leffler distribution ; Mittag- Leffler function ; Stable distribution ; Stochastic order.. AMS MSC 2010: Primary 60E05
Therefore, with the weak form of the positive mass theorem, the strict inequality of Theorem 2 is satisfied by locally conformally flat manifolds and by manifolds of dimensions 3, 4
Inside this class, we identify a new subclass of Liouvillian integrable systems, under suitable conditions such Liouvillian integrable systems can have at most one limit cycle, and
Analogs of this theorem were proved by Roitberg for nonregular elliptic boundary- value problems and for general elliptic systems of differential equations, the mod- ified scale of
Then it follows immediately from a suitable version of “Hensel’s Lemma” [cf., e.g., the argument of [4], Lemma 2.1] that S may be obtained, as the notation suggests, as the m A
Definition An embeddable tiled surface is a tiled surface which is actually achieved as the graph of singular leaves of some embedded orientable surface with closed braid
Correspondingly, the limiting sequence of metric spaces has a surpris- ingly simple description as a collection of random real trees (given below) in which certain pairs of
Using the batch Markovian arrival process, the formulas for the average number of losses in a finite time interval and the stationary loss ratio are shown.. In addition,
