Asami Nakagawa
Abstract
This paper investigates whether language attrition occurs due to the change of environments in the initial six months. The two participants of the study, L and M, have acquired their L2 (English) through school instruction at an international school in their L1 country (Japan). In the spring of 2011, they both transferred to a Japanese school. From the transfer, their L2 immerse decreased largely. From these environmental changes, it was observed whether language attrition would occur to the two. Language attrition was observed from five linguistic aspects, fluency, lexicon, accuracy and writing skills. The instruments used to collect data varied from the storytelling task to free conversation interview. Three research questions were set in order to seek the participants’ linguistic changes. (1) Will language attrition occur to those whose classroom instructions changed largely from their L2 to L1 in the initial six months? (2) If attrition can be seen, in which order of the skills such as fluency, accuracy and lexicon will attrition be observed? (3) Will motivation and personalities of the participants’ effect language attrition or retention? Over the six months, the two participants both stabilized their linguistic skills in a high level. However, there was a subtle decline seen in both participants’ productive lexicon, fluency and complexity rate of the writing test. The study revealed possible signs of language attrition in the initial stage.
Keywords: L2 attrition, L1 environment, school medium language, productive lexicon, lexical frequency level
1. Literature Review 1.1 Rationale
The phenomenon of language attrition has been formally recognized at the Conference on the Attrition of Language Skills at the University of Pennsylvania in 1980. Since this conference, language attrition has been understood widely as “the decline of linguistic skills whether of individuals or speech communities” (Taura, 2008a).
My own experience of being a Japanese returnee inspired me to choose the present research topic of “language attrition”. Since my return from the U.S.A to Japan, I have been struggling to maintain my English knowledge while adapting to Japanese society. After more than ten years had passed since my return, I found myself totally adjusting back into Japanese schools, making friends and getting used to society itself. However, I also found myself trying to cope with a decline in my English skills particularly my speaking. From this experience I have always had a question on my mind, which is “Is language attrition inescapable when there is a change of language environments?” I believe this is a question many returnees and L2 learners face. I hope the present study will contribute in a small way, to reduce the difficulties many returnees and L2 learners like myself face.
The phenomenon of language attrition is defined in the present research as “permanent or temporary regression from the subjects’ previous linguistic performance in any linguistic skills, such as speaking, listening, reading and writing” (Yukawa, 1997). Language regression due to pathological attrition such as aphasia is excluded from the definition in this research. A person who displays such phenomena is called an “attriter” in this research.
This section will introduce key variables in language attrition studies, namely pre-attrition proficiency, motivation and personality, along with various aspects that attrition studies examine.
1.2 Prediction variables 1.2.1 Pre-attrition proficiency
Many researchers (Tomiyama, 1999, 2000 and 2008; Reetz-Kurashige, 1999; Yoshitomi, 1999) claim that the attriter’s pre-attrition proficiency plays a key role in language attrition.
Tomiyama (1999 and 2000) examined the initial and second stages of a Japanese male returnee student in a longitudinal case study, which lasted for a total of 33 months. The subject Ken, left Japan at the age of 1;03 (year age; months) and came back to Japan after seven years. Judging from his language profile along with his length of residence, Ken was labeled as a high-proficient subject with acquired skill in literacy. The research at the initial stage commences with month two of his return and continues until month nineteen. Five instruments were used to observe how Ken’s language skills changed over time. Data from a free conversation interview between the researcher and Ken were analyzed to measure Ken’s morphological, syntactic and conversational discourse skills. The Peabody Picture
Vocabulary Test (PPVT) was used to examine the extent of the subjects’ vocabulary acquisition. The Bilingual Syntax Measure (BSM) and data of storytelling using two picture books were used to measure Ken’s morphological skill, fluency and sentence structures.
Ken’s frequent use of code-switching and some deterioration in his morphology and syntax were seen in the initial observation period, but the phonology and receptive lexicon remained robust throughout the whole period. Tomiyama’s observation of Ken continued after the initial stage 2nd to 19th month back. The second stage of observation comprises month 20 through month 33. The second stage was characterized as a phase of change in Ken’s syntax and morphology and stability in fluency and productive lexicon. Tomiyama finished her longitudinal study by concluding that although there was some attrition seen in Ken’s morphology, his attained proficiency level and acquired literacy skills’ contributed to the prolonged retention of his L2 ability.
In 2008, Tomiyama also investigated whether there is a difference in the attrition pattern of second language between two siblings in terms of grammatical complexity, grammatical accuracy, lexical complexity and lexical productivity. The subjects in this research were one male (older sibling) and one female (younger sibling) returnee, who were called by the pseudonyms, Eugene and Lily. Eugene was 5;08 and Lily was 2;08 when they moved to the United States. After their four years and four months’ stay in the United States, they returned to Japan and were placed in a local public school in Japan. Eugene was 10;00 and Lily was 7;0 at that time. Data were collected from a story telling task, which used the picture book by Mayer and Mayer (1971), A Boy, A Dog, A Frog and A Friend. The observation lasted for 31 months.
Throughout the 31 months, Eugene and Lily showed some similar attrition patterns regarding their grammatical complexity, lexical complexity and lexical productivity. Despite the age gap between the two siblings, the younger sibling did not show a great difference in attrition patter from the older sibling. Tomiyama claimed from this result that, their overall attained proficiency in English at the grade norm level included the acquisition of literacy skills was significant. Regarding the younger sibling, who belonged to an age group reported to be more vulnerable to attrition, Lily showed attrition patterns similar to her older brother who belonged to an age group reported to be more robust. Tomiyama concluded that this result came about because the younger participant had reached a high proficiency level and this was a factor of maintaining her L2 in terms of grammatical complexity, lexical complexity and lexical productivity.
Reetz-Kurashige (1999) also observed a difference in attrition pattern in the use of lexical and morphosyntax between the three groups of subjects. The three subject groups were 18 returnees, 10 Japanese children of elementary school age living in Honolulu and attending local English-speaking schools, and 14 native English speakers in the same age range. Storytelling was the task used to measure the changes in verb use by the subjects. Pica’s (1983) Target-Like Usage formula with its
method of using morpheme quantification, was used to assess the subjects’ accuracy in morphology. The Target-Like Usage formula is calculated as the number of correct cases divided by the number of total cases.
Reetz-Kurashige (1999) claimed that being older did not guarantee high retention. From the researcher’s observation, it was found that the initial proficiency scores were the best predictors of retention. Among the subjects, those children whose age was over eight years old and their length of residence included at least two years of school abroad retained over 80% TLU. Near native-level English speaking ability was virtually always required for minimal attrition. In other words, high competence at study onset was the most predictive factor of minimal L2 attrition. Reetz-Kurashige’s (1999) findings support the inverse hypothesis which was hypothesized by Bahrick (1984) that highly proficient learners plateau for several years before language attrition starts. Since the more highly proficient subjects showed a lower degree of attrition in Reetz-Kurashige’s research, this led her to conclude that the inverse hypothesis was supported. This study also found that the more than age or length of time abroad, proficiency in speaking was the best predictor for retaining accuracy in speaking.
1.2.2 Motivation and personality
Gardener, Lalonde and MacPherson (1985) observed the effects of attitude and motivation on second language attrition using a retrospective design. Students who participated in a six-week course in French rate of how good they perceived second language skills to be throughout the intensive course, by answering questionnaires. They also rated their present skill levels. From the questionnaires, measures using twelve variables such as attitudinal/ motivational were obtained.
As a result, attrition in medium-level language skills of speaking and understanding were found. Also, those with favorable attitudes and high motivation showed little attrition, while those with less favorable attitudes and motivation showed significant language loss. It can be said from this research that, positive attitudes and intensive use of the second language are associated with high levels of skills in second language. In comparison to Tomiyama’s (1999, 2000 and 2008) longitudinal research, this research examined the students over a six-week course and it can not be discussed in the same way from a longitudinal perspective.
Yoshitomi (1999) examined the language attrition pattern in four female Japanese returnee students taking a multiple case study approach. The girls differed in age and incubation period. The term incubation period is used by Gardener and Lysynchuck (1990) to refer to the period between the termination of language training and the time when retention is assessed. The subjects were divided into groups according to their chronological age and their incubation period. The subjects were referred to as JYS (younger, shorter incubation), JYL (younger group, longer incubation), JOS (older group, shorter incubation), JOL (older group, longer incubation). All subjects lived in large metropolitan areas in
America. They all went to local American schools on weekdays and attended supplementary Japanese schools on Saturdays. After their return to Japan, some subjects had a chance to attend English classes for returnee students. However, despite the subjects’ strong willingness to maintain at their English schools, their opportunities to use English were still fairly limited. Yoshitomi collected the data four times over a year with three months in between each session. Five tasks were adopted in order to collect the data. (1) Free interaction: a free conversation interview was held between the subject and the examiner. (2) Story description: Each subject was asked to describe stories by looking at picture books. (3) Planned speech: the subject was asked to think about a topic that was discussed during the free interaction, expand on the topic, and plan a short speech about it. (4) Listening comprehension: A controlled listening comprehension test was given using Comprehensive Language Evaluation (CYCLE) which was used to measure the subjects’ formal linguistic knowledge. (5) Interview and questionnaire: Interviews were conducted in Japanese between the researcher and the subjects. Interviews with the subjects’ parents were also held.
Yoshitomi found some differences in the subjects’ use of vocabulary due to their personalities. It was found that the more talkative returnees produced more types and tokens of vocabulary items and seemed to benefit more from planning. From this fact, it was concluded that personality plays an important role in the use of communication strategies. The more talkative returnees used paraphrasing and progressive retrieval. For example, the subject JYL was a risk taker who used the largest number and the widest variety of communication strategies. Yoshitomi claims that JYL was talkative and fluent and showed the strongest motivation to retain her L2. In addition, her attitude toward the data-collection was highly positive. From these findings, Yoshitomi concluded that personality and motivation has an influence on the linguistic performance.
1.3 Linguistic aspects of attrition
In this section, various linguist aspects on attrition will be introduced. 1.3.1 Fluency
In Tomiyama’s (2000) study, Ken’s fluency changed on a parallel with code-switching and lexical attrition. Tomiyama observed pauses, repetitions and self-repairs from the storytelling data. From this data Tomiyama revealed that Ken paused more and longer as time progressed. In addition, Ken progressively made more repetitions. As a conclusion, Ken’s language fluency was defined by his pauses, repetitions and self-repairs and it deteriorated progressively.
Yoshitomi’s (1999) research found possible signs of attrition in the subjects’ fluency as well. She found attritional patterns in the average number of clauses per repair and the average number of clauses per false start. The average number of clauses per repair decreased for JOS and JYS. The average number of clauses per false start decreased for JOL and JYS. In other words, all the subjects except for
JYL showed a small degree of regression in fluency. They all showed a frequent use of repairs and false starts in their speech which increased over time. However, in terms of the amount of speech per time unit, no evidence of attrition was found.
1.3.2 Morphosyntax
Tomiyama (2000) found some evidence of attrition in Ken’s morphology. The grammatical morphemes that were focused in this research were the plural verbs, third person singular, progressive, auxiliary, copula, regular past and irregular past verbs. Most of his morphemes stayed stable, except for the plural form and third person singular. Ken’s use of the plural revealed a severe degree of attrition which dropped to as low as 65% in accuracy rate. Irregular past and regular past verbs showed a gradual decline as well.
Reetz-Kurashige’s (1999) research also found some evidence of attrition in her subjects’ use of morphology. Common attrition patterns seen in the subjects were errors such as dropping the bound “ed” morpheme in the regular past tense, the “s” for the third person singular, omitting the auxiliary verb in the progressive form, or failing to have the auxiliary agreement.
1.3.3 Lexicon
Russell (1999) examined the patterns of lexical maintenance and attrition among 65 native English-speaking learners of Japanese as a second language (JSL). The subjects were university students in their early twenties who had recently returned from their two years of missionary service in Japan. All subjects in the study had taken an intensive two-month language training course and spent 22 months in the host country, acquiring the L2. The subjects, divided into two groups participated in three tests. One group consisted of learners with a significant amount of additional formal instruction in Japanese (eight or more semester hours) over the two-year period of the study, and the other group consisted of learners without any such instruction. After that, 10 subjects were selected randomly from each of the two groups. Oral monologue data were collected from the two groups three times over a period of two years. The subjects were asked to record their oral responses in Japanese to each of the six questions. The oral data were transcribed and processed using the Word Cruncher (1988) software to generate lists of words and their frequencies. The type-token ratios were also calculated using these lists. The relative frequencies of content words (nouns, verbs, adjectives, and adverbs) versus function words (postpositions, conjunctions and fillers) were also analyzed and compared with each of the groups. As a result, significant differences were found in the following areas. (1) a decrease in vocabulary size, (2) a decrease in the number of sentences and of lexical error-free sentences, and (3) an increase in the ratio of English tokens to total tokens. There was no clear evidence of attrition found in lexical variability, lexical density, lexical errors per T-unit, tokens per error-free T-unit, the relative frequency
of filler words and loan words.
In Tomiyama’s (2008) study, both Eugene and Lily showed a gradual decline in lexical complexity, with Eugene experiencing a steady regression except for the second last session, while Lily showed more fluctuation. Both of them ended up showing lower scores compared to the first session. Compared to Eugene, Lily showed more frequent and a larger magnitude of fluctuations in her lexical complexity. Tomiyama indicated this to be because of Lily’s unstable language condition compared to Eugene. While the two subjects showed some decline in lexical complexity, their lexical productivity seemed to have been maintained or had only declined slightly.
1.3.4 Compensatory strategies
Compensatory strategy is a communication strategy generally triggered by insufficient linguistic knowledge. This type of strategy is used by attriters to compensate for their deficient language. In Yoshitomi’s (1999) interview and questionnaire, the subjects reported that they used compensatory strategies such as paraphrasing or circumlocution to compensate for their lack of ability. Circumlocution is defined as an indirect way of speaking; the use of more words than necessary to express an idea.
Faerch and Kasper (1983) label compensatory strategies as formal reduction strategies, code-switching and interlingual transfer. When using a formal reduction strategy, speakers communicate by means of a reduced system to avoid using specific linguistic rules and items (Faerch and Kasper 1983). The compensatory strategy of code-switching is an often observed phenomenon in the process of L2 attrition (Tomiyama 1999). In Tomiyama’s (1999) research, some changes in Ken’s code-switching frequency were found. He started code-switching to his L1 from the 8th month since returning to Japan. Code-switching took place with interjections and emotional utterances such as expressing frustration and excitement. Conversational fillers were also seen as susceptible to code-switching. Also, as Ken started to show some lexical retrieval difficulty, so he used a number of strategies to compensate for his deficiency such as code-switching, paraphrasing, avoidance and approximation. In Tomiyama’s research of 1999, interjections, fillers and emotion-laden utterances were likely to be switched to Ken’s L1. Compensatory strategy such as formal reduction strategies was also seen in Tomiyama’s (2000) research. From the storytelling data, there was a structural change in Ken’s modification of nouns, from post-noun modification to pre-noun modification. Tomiyama claims that Ken’s structural change was a subtype of formal reduction strategy called “syntactic reduction”. She indicates that by using pre-noun modification, two of the devices for post-modification of nouns in English, relativization and prepositional phrases can be avoided. The first pattern of Ken’s structural change seen was the pre-modification of head nouns by other nouns, such as “a tiger mom”. The pre-modification of nouns by –s genitives was also frequently seen for example in the phrase, “the window’s place”. Multiple pre-modification of nouns such as “a one tire baby car=stroller” was seen as well. Also, changes in a
particular structure, vocabulary and morpheme use was observed under a controlled environment. The free conversation interview revealed Ken’s increasing use of pre-noun modification patterns.
1.4 Hypotheses of language attrition 1.4.1 Regression hypothesis
The regression hypothesis is a widely used theory in describing the phenomenon of language attrition. The regression hypothesis was hypothesized by Jakobson (1968 English translation, cited in Lynne Hansen, 1999, p9). The hypothesis describes that the process of language attrition is the reverse order of the process of acquisition. In other words, the regression hypothesis postulates that what is learned last is lost first.
To date, the regression hypothesis is partially supported. Cohen (1975), for instance observed the attrition pattern of three children with their L1 being English and L2 being Spanish. The data was collected longitudinally for a period of 19 months, which reflected observational data and data from structured test of morphology and syntax and from storytelling. The three children’s acquisition and attrition patterns were observed in their use of tense, article, adjectives and ser/estar (“to be”) distinction. As a result of the observation, two subjects showed results to uphold the regression hypothesis. However, Cohen’s data also revealed counter evidence of the hypothesis in one of the subjects. Thus, the regression hypothesis is only partially upheld in Cohen’s study.
In Taura’s (2008a) study, his subjects showed results to support the regression hypothesis. In his study, approximately 150 returnees who were divided into two groups, depending upon their educational background, participated in this study. Three experiments were conducted, investigating receptive skills and productive skills. The productive skills were observed from the data collected by the storytelling and story writing task. In examining the subjects’ accuracy, Taura adopted the 4-M model by Myers-Scotton (2002), which will be detailed in 1.4.2, and examined the subjects’ changes in accuracy based on four morphemes. From the observation, Taura concluded that is his accuracy analysis revealed that his subjects’ attritional order followed the regression hypothesis, and supported the hypothesis.
While the regression hypothesis was partially seen or upheld in the literatures, Tomiyama’s (2008) showed another different result. Through the two siblings observation, Tomiyama found there was a “fluctuation” in their attritional order. Fluctuation was defined in the study as a change in the direction (i.e. improvement/ decline) from the previous session. In addition, the degree of fluctuation differed between the younger sibling and older sibling. From the result, Tomiyama concluded that the two siblings’ attritional patterns were not a linear decline but showed a fluctuation, which does not quite follow the regression hypothesis.
of language attrition. However, we can also see research findings that are still indeterminate that to conclude whether the hypothesis is upheld or not.
1.4.2 4-M model
According to Myers-Scotton’s (2002) 4-M model, the acquisition and attrition process does not follow the process as the regression hypothesis. The 4-M model hypothesizes that the attrition pattern follows the same path as the acquisition process. In the 4-M model proposed by Myers-Scotton (2002), the morphemes are divided into 4 types. They are the content, early system, two late system morphemes, which are called the bridge late system and the outsider late system morpheme. Content morphemes are directly elected by a speaker’s intentions to map conceptual structure onto the lemma, assign or receive a thematic role. Early system morphemes pattern with the content morphemes. The other two types of morphemes are structurally assigned later in the production process. Examples of the content morphemes are nouns, verbs, adjectives. Examples of the early, bridge and outsider system morphemes are the definite article “the”, copula “be” and irregular past tense, respectively. According to Myer-Scotton’s (2002) hypothesis, a learner acquires and loses their morphemes in the order of content, early system, bridge late system and outsider late system morpheme.
Taura’s (2008a) study adopted the 4-M model for accuracy analysis, but found attritional orders in his subjects that was completely in a reverse order of Myers-Scotton’s implicational scale for language attrition. He found that the content morphemes were the most immune to loss, followed by the early system morphemes, bridge late system morphemes and the outsider late system morphemes. From the finding in Taura’s (2008a) literature, we can see that the validity of the 4-M model, or the implicational scale proposed by Myers-Scotton (2002) to be tested in the attrition field.
1.4.3 The speed of attrition
When mentioning the attrition speed, the notion of an “initial plateau” must be considered. An initial plateau is proposed by Weltens and van Els (1986) and Bahrick (1984), which is defined as a period where linguistic skill levels remain relatively stabled during the first few years after the disuse of the L2.
Tomiyama (1999) compared the speed of attrition with the subject in Kuhberg’s (1992) study and Kaufman & Aronoff’s (1991) subject. Kuhberg’s subjects showed a rapid speed of attrition, which led him to terminate the study after by the 15th month of study. The subject in Kaufman and Aronoff’s study, attrition speed were even faster and to be reported that by the 12th month, the subject showed difficulty in his language use. Compared to those subjects, the subject of Tomiyama, Ken was still speaking spontaneously after the 19th month of observation. From this observation, Tomiyama concluded the possibility that Ken was in an “initial plateau” at this point.
From the research findings, we can assume that there is an “initial plateau”, but it differs between the subjects and still is indeterminate to conclude the precise period of an initial plateau.
1.5 Research questions and possible predictions
1.5.1 Research question 1: Will language attrition occur in those whose classroom instructions changed greatly from their L2 to L1?
A great number of findings of attrition patterns can be seen in the literature review. However, many of the subjects for the research we examined were students who have gone to another country and acquired their L2 naturally and then they have come back to their L2 environment. The L2 attrition patterns of these students have been observed in many studies.
Few studies have focused on subjects who live in their L1 country, and acquired their L2 naturally, for example, through classroom instruction at schools where the school instruction language is in the L2 to rather than the L1. Therefore, attention will be paid to those students in the present study.
Prediction 1: Severe language attrition will not take place, but some linguistic skills will show a decline.
From children’s L2 attrition studies (Tomiyama, 2000; Yoshida, 1990; Yukawa, 1998; Taura, 2008a), it is claimed that receiving an L2 literacy education for the first 2 years at elementary school in an L2 environment assures no attrition for six to eight months (Taura, 2008). In addition, it is also said that four years of such an education will help stabilize the learner’s L2 literacy skills and prevent attrition from setting in for at least one year (Taura, 2008a). The subjects of this research who will be introduced in detail in Chapter 2, did not acquire their L2 in an L2 environment like typical-returnee students, however they grew up in Japan, and acquired their L2 naturally through the school curriculum and instructions at an international school and through daily conversations with their family and friends. From the environment they were raised in, it can be said that they have acquired their L2 naturally like returnee students do. From the fact that they have had approximately 10 years of an L2 literacy education in such an environment, it can be predicted that language attrition will not set in over the observation period, which is approximately six months. Therefore, from the literatures, a prediction will be made that severe language attrition will not be observed. However, it will also be predicted that minor attrition in some skills may be seen, which will be detailed below.
1.5.2. Research Question 2: If attrition can be seen, in which order of the skills- fluency, accuracy and lexicon, will attrition be observed?
Prediction 2: Attrition will occur in the order of the participants’ lexicon, fluency and accuracy.
Prediction 1, considers that severe language attrition will not be observed. However, although severe attrition may not be seen, this does not indicate that nothing is lost. By observing the subjects’ L2
skills from different perspectives, such as fluency, accuracy and lexicon, attrition patterns may be revealed.
According to the literature, predictions can be made that the participants will show small signs of attrition in their skills in the order of lexicon, fluency and accuracy. Many L2 language loss research studies show evidence of lexical loss such as Tomiyama (2000), Yoshida et al. (1989) and Hansen (2001). From an hypothesis put forward by Andersen (1982), lexical items the least frequently used by an attriter are the most susceptible to loss, which leads to the prediction that those words that are not frequently used in daily conversations and classes for the subjects will show signs of decline first among all the skills.
Regarding morphosyntactic attrition, as Moorcroft and Gardener (1987) and Weltens (1989) claim in their research, the attriter’s proficiency is a key factor connected to language attrition. Low proficiency learners are said to lose more of their grammatical skills than their vocabulary skills. In contrast, highly proficient learners’ vocabulary skills are said to be more susceptible to loss than their grammar skills. The present researcher’s two participants can be qualified as highly proficient learners from their baseline data, so it is predicted that their lexical skills will show signs of attrition than their grammar.
1.5.3 Research Question 3: Will motivational level and the personality of the participants effect language attrition or retention?
Prediction 3: If the participants retain a high motivation to keeping their English skills, motivation will play a key role.
Factors such as the learner’s motivation, attitude and use in relation to language attrition have been studied by Gardener et al. (1985), Gardener, Lalonde, Moorcroft and Evers (1987). Gardenr et al. (1985) examined 20 to 30 year old subjects’ attitudes towards the target language (French) and their language learning as well as the use of the French during the incubation period (6 months after the instruction had started and before the second assessment) using their questionnaires. The research revealed that subjects who had favorable attitudes, tended to maintain their French. In contrast, those who showed less favorable attitudes retained less. Also, the use of French during their incubation period showed a possible effect on the degree to which the subjects maintained their speaking skills. From this research, it can be seen that motivation and attitudes leads to the subjects’ frequent use of the target language, which results in an even higher degree of maintenance of the language.
From the literature on motivation and attitudes, predictions will be made that the participants’ high motivational level will play a key role in maintaining their L2. The chances for the participants in the present author’s research, to use English will decrease after their change in school environment. Despite this, their high motivation will help them to make full use of the any occasion available to them
to use English in their daily lives such as conversations with their families and friends back in their former school.
2. Methodology
2.1 Demographic data of the participants
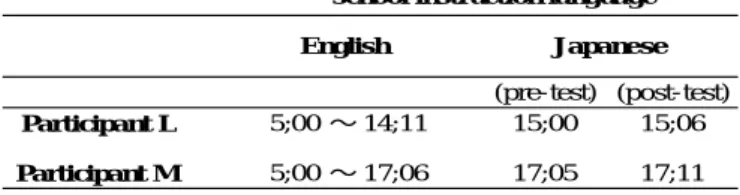
There are two participants, L and M, in the present study. Table 1 summarizes their demographic data.
Table 1. Demographic data of the participants
(pre-test) (post-test)
Participant L 15;00 15;06
Participant M 17;05 17;11
5;00 ∼ 14;11 5;00 ∼ 17;06
school instruction language English Japanese
Participant L, is a 15-year-old Japanese female. L attended an international school in Hokkaido since she was 5 years old. She used English in classes at school and with her international school friends. At home, she uses English when she talks to her younger sister who also went to the same international school. She entered a Japanese senior high school in Hokkaido from April, 2011 at the age of 15;00. The other participant, M is 17 years old. She is the child of a Brazilian mother and a Japanese father. M uses English with her mother and talks in Japanese with her father. She has also attended an international school in Hokkaido since she was 5 years old. In the international school, she had all her classes in English. She used Japanese only in the Japanese class, which was held once a week. However, during the summer vacations in the international school, M had some opportunities to go to a public Japanese school and participate in after school activities up until elementary school 4th grade. M transferred to the Japanese senior high school in Hokkaido at the age of 17;05 in March 2011, one month earlier than L. The pre-data were taken from both girls two weeks after M’s entry into the senior high school.
Both participants had been going to the same international school before they entered the Japanese senior high school. The international school is a school mostly for returnee students who have lived abroad or for students with either one or both of their parents who is from another country. All classes in the international school, which the two participants went to, were taught by native English speakers. Native English teachers instruct all classes in English, such as history, math, science, physical education, music, art, English grammar and literature. During the week, Japanese class was held once or twice. The Japanese class was taught by a native Japanese speaking teacher. The class content varied from week to week, but students were mainly taught about Japanese culture, Kanji and Japanese
literature.
The Japanese senior high school, which the two participants entered, is a private school in Hokkaido. In this school, all the subjects including math, science and P.E were taught by a Japanese native teacher in Japanese. The total number of classes of English held per week differed slightly each school year. L entered as a first grade high school student, and receives six English classes in a week. However, among the six classes, only one class is taught by a native English speaker. English grammar and English reading classes occupy the other five classes, which are all taught in Japanese by a Japanese English teacher. M entered the Japanese school as a second grader, receiving eight English classes a week. However like L, she has only a small number (two) of classes taught by a native English teacher. From this information, we can see that the opportunities for L and M to receive native English teachers’ classes in English decreased sharply after their entrance into the Japanese senior high school.
The pre-attrition proficiency in attrition studies is an important factor, which must be made clear before the research starts, since the relevant literatures found that highly proficient subjects are more prone to attrition (Tomiyama, 1999, 2000 and 2008; Reetz-Kurashige, 1999; Yoshitomi, 1999). Data were collected from L and M to specify their baseline data.
The pre-test was carried out in March, two weeks after M’s entry, and right before L entered the Japanese high school. L’s raw score was 164 on the Peabody Picture Vocabulary Test (PPVT), an age equivalent to the age of 16;04 though her chronological age was 15;00. Meanwhile, M’s raw score was 148 on the PPVT, an age equivalent of 12;08 when her chronological age was 17;05. As an indication of the participants’ baseline data, the PPVT results show that L’s lexical level is age appropriate, while M’s lexical level is below her chronological counterparts in the United States.
2.2 Data collection procedure
All data were collected from the participants twice. The first data was collected in March 2011, after the participants left the international school where they were educated for approximately 12 years in the English language (L2). Participant L was 15;00 at the point she joined the Japanese school, and entered from the first grade of senior high school. Participant M was 17;05 when she entered the second grade of the senior high school. The post-data were collected in September 2011. This was exactly six months after the pre-data were collected.
2.3 Linguistic Aspects
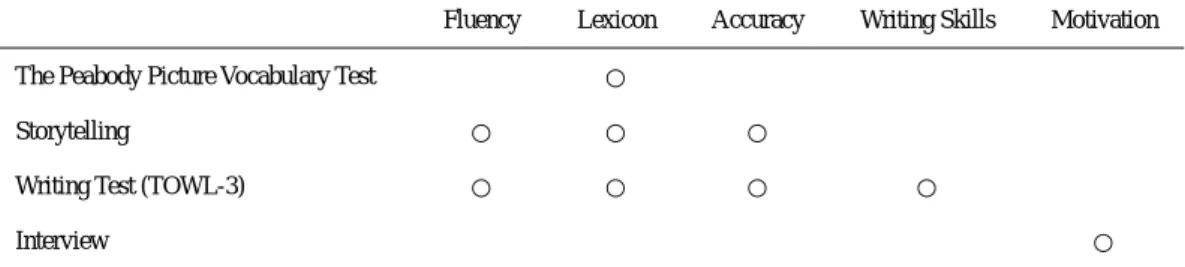
In the present research, the phenomenon of language attrition was observed from many angles of the linguistic skills through four instruments, which is summarized in Table 2. In addition to the four linguistic aspects, the motivational changes of the participants were observed from the interview data.
Table 2. Linguistic aspects and instruments
Fluency Lexicon Accuracy Writing Skills Motivation
The Peabody Picture Vocabulary Test ○
Storytelling ○ ○ ○
Writing Test (TOWL-3) ○ ○ ○ ○
Interview ○
2.3.1 Fluency
The participants’ fluency in using English was measured from the storytelling test and writing test (TOWL-3). To observe the participants’ fluency, pause analysis and word count per sentence were conducted on storytelling. As for the written data, the numbers of types, token, sentences and clauses per minute were calculated as fluency indices.
2.3.2 Accuracy
Two types of accuracy were analyzed- (1) morphosyntactic accuracy and (2) complexity rate. The morphosyntactic accuracy is examined on the storytelling and writing data. The collected data were analyzed by using the theoretical framework of the 4-M model proposed by Myers-Scotton (2002), which will be explained in section 2.5.3.
Along with the morphosyntactic accuracy, the lexicon complexity rate was also calculated using the formula from Taura (2008a). The numerical formula used was, complexity rate = (the number of total subordinate clauses + the number of total passive form sentences) divided by the total number of sentences.
2.3.3 Lexicon
The participants’ lexical ability was measured from the Peabody Picture Vocabulary Test, storytelling and writing test. In detail, the Peabody Vocabulary Test observed the participants’ receptive lexicon levels. The storytelling test and the writing test are used to examine the participants’ productive lexical level and lexical complexity. The lexical complexity was calculated by the “Complete Lexical Tutor” (http://lextutor.ca/vp/bnc/output.pl) along with the lexical productivity. This software produces the number of types, tokens, the lexical density in terms of the type-token ratio and the frequency level of each word used in the context.
2.3.4 Writing skills
The participants’ writing skills were examined in the writing test of TOWL-3 that looks at contextual convention, contextual language and story construction.
2.3.5 Motivation
The semi-structured interviews were qualitatively analyzed to see the emotional changes such as the participants’ motivations after they have transferred to the Japanese school.
2.4 Instruments
Four types of data were collected using the following instruments. 2.4.1 The Peabody Picture Vocabulary Test (PPVT)
The Peabody Picture Vocabulary Test was used to examine the subjects’ receptive vocabulary level. To administrate, the researcher presents a series of pictures to the subject. There are four different pictures on each page. The researcher gives a word describing one of the pictures and asks the subject to point to the picture that matches the word given.
The result is converted into raw scores which are calculated using the standardize score sheet attached to the test. The total raw score is then converted to a percentile rank and the equivalent age of native English speakers as a comparison. Research such as Tomiyama’s (1999 and 2000) has employed this instrument to examine the extent of Ken’s vocabulary acquisition.
2.4.2 “Frog, where are you?” (Mayer, 1971)
This picture book has been widely used as a device to elicit participants’ storytelling. The book is one of Mayer’s frog series, which are now commonly used by attrition researchers (e.g, Tomiyama 2000). It has 24 pages of detailed pictures without any written text. (see Appendix 1) The storyline of this picture book is that the main characters - a boy and his pet dog, go searching for their missing pet frog first in their house and then in the forest. While they search, they encounter many different characters, objects and actions. The task required the participants to use words that they would have learned while they were attending English-speaking classes at the international school. These words include such items as bees, owls, moles, reindeer, jar, beehives, holes, cliffs, ponds and logs. The participants were given some preparation time to look at the pictures before they told their story following the storyline as depicted in the pictures. They were told to take as much time as they wished to tell their story. The recorded storytelling data were transcribed and then subjected to a numerical analysis of their fluency, accuracy and lexicon as explained below.
(1) Pause analysis was carried out to observe the participants’ fluency. Pauses that lasted longer than 200ms were detected using the Audacity 1.3.12 device. The Audacity device is a multilingual audio editor and recorder, which shows the length of the sounds and pauses. Pauses shorter than 200ms were excluded since they are physiologically caused pauses. Pauses were classified into inter-sentential pauses and intra-sentential pauses. Inter-sentential pauses occur between sentences
and intra-sentential pauses occur in the middle of a sentence. It is said that native English speakers have a tendency to have more pauses between sentences, which is called an inter-sentential pause, and English learners tend to use more intra-sentential pauses, during a sentence when the sentence is not completed. These intra-sentential pauses are used when a person is trying to retrieve a specific vocabulary item (Taura, 2008b). The more intra-sentential pauses are found, the more it can be assumed that the person is having lexical retrieval difficulties.
(2) The 4-M model analysis by Myers-Scotton (2002) was used to measure the participants’ morphosyntactic accuracy. The 4-M model is relevant to our study for two reasons. First, the model place its focus on both acquisition and attrition order of a language. Secondly, the model is systematic in a way that the participants’ attrition order can be explained by the four morphemes. By using the 4-M model and classifying the participants’ morphemes, we assume that the attritional pattern will be revealed. Along with the 4-M analysis, the lexicon complexity rate was also calculated using the formula from Taura (2008a) as explained in 2.4.2.
(3) Lexical analysis. In the lexical analysis, types, token, type-token ration (TTR) and frequency level were calculated. TTR is commonly used (e.g. Yoshitomi, 1994; Yukawa 1998) in studies to assess the lexical density or diversity in attrition on Japanese subjects. TTR is calculated by the ratio of different words (type) to total words (token) in a text.
The transcription of the data excluded the following elements. (1) self-corrected words, (2) self-repeated words (3) nonlexical filled pauses (e.g. um, uh) and (4) Japanese utterances.
2.4.3 TOWL-3
The Test of Written Language (TOWL-3) by Hammill and Larsen (1996) was employed to measure the participants’ ability to write in English. Participants were shown a particular picture (see Appendix 2) and were told to write a story spontaneously within the 15 minutes they were given. The writing data were also transcribed by the researcher. Grammatical mistakes and spelling mistakes by the participants were transcribed as they were originally written. The transcribed data were also subjected to a numerical analysis of the writing skills, fluency, accuracy and lexicon.
(1) Writing skills. The participants’ writing tests were scored according to the TOWL-3 manual (See Appendix 3). The scores were classified into three sections, CC (contextual convention), CL (contextual language) and StC (story construction). CC measures the mastery of arbitrary conventions in written language such as punctuation, spelling and capitalization. CL measures the use of language in writing. StC measures the story construction and evaluates the students’ use of prose, action, sequence and theme. There are 11 to 14 items in each subset of CC, CL and StC. There are 12 items in CC such as, “all sentences begin with a capital letter” and “uses an apostrophe in a contraction.” There are 14 items in CL such as, “uses coordinating conjunctions other than
and.” StC contains items such as “plot” and “characters show feelings/ emotions”. Each section’s
raw scores were calculated using the TOWL manual and were converted into the levels of a native English speaker with the same writing knowledge.
(2) Fluency analysis for the writing data was conducted as explained in 2.3.1.
(3) The 4-M model analysis by Myers-Scotton (2002) used in the storytelling data was also used in the writing data to measure the participants’ morphosyntactic accuracy.
(4) Lexical analysis was conducted using the same method for the storytelling data.
2.4.4 Free conversation interview
The interview was semi-structured in that the questions concerned specific topics, which were given by the researcher to the participants to answer freely in English or Japanese. The topics centered around the participants’ English knowledge and their lives when they were at the international school. Questions were asked such as “What was the most exciting event you remember at international school?” and “Is English easier for you to speak in than Japanese?” In addition, questions by the researcher were asked in both English and Japanese. The total interview time ranged from approximately 30 minutes to 50 minutes. The interview data were audiotaped and transcribed for qualitative analysis to observe the participants’ emotional changes such as their motivations.
3. Results
This chapter summarizes the results collected from each instrument. 3.1 The Peabody Picture Vocabulary Test
The results of The Peabody Picture Vocabulary Test (PPVT) are summarized in Table 3. The Table reveals that L’s raw score was 164 on the pre-test, which fell slightly to 160 on the post-test, with their standard scores being 164 and 160, respectively. While L’s chronological age was 15;00 when she took the pre-test, her age equivalent changed from 16;04 at the time of the pre-test to 15;03 at the post-test. In short, L showed a higher receptive lexical level than her chronological age in the pre-test. However, her lexical level had declined by one after six months, resulting as her receptive lexical level being the same as her chronological age.
M’s results indicate a slight improvement in her raw score, which changed from 148 on the pre-test to 155 in the post-test, with the standard scores of 87 and 90, respectively. M’s age equivalent changed from 12;08 to 14;01 while her chronological age was 17;05 when she took the pre-test. In the pre-test, she showed a receptive lexical level 5 years younger than her actual chronological age. However, after six months she showed a progress of approximately two years lexical level. Still, her receptive lexical level was for 4 years below than her actual chronological age.
Table 3. PPVT results
pre post pre post
Raw score 164 160 148 155
Standard score 104 99 87 90
Percentile Rank 61 47 19 25
Normal Curve Equivalent 56 59 32 36
Stanine 6 5 3 4 Age Equivalent 16;04 15;03 12;08 14;01 Chronological Age 15;00 15;06 17;05 17;11 L M 3.2 Storytelling 3.2.1 Fluency
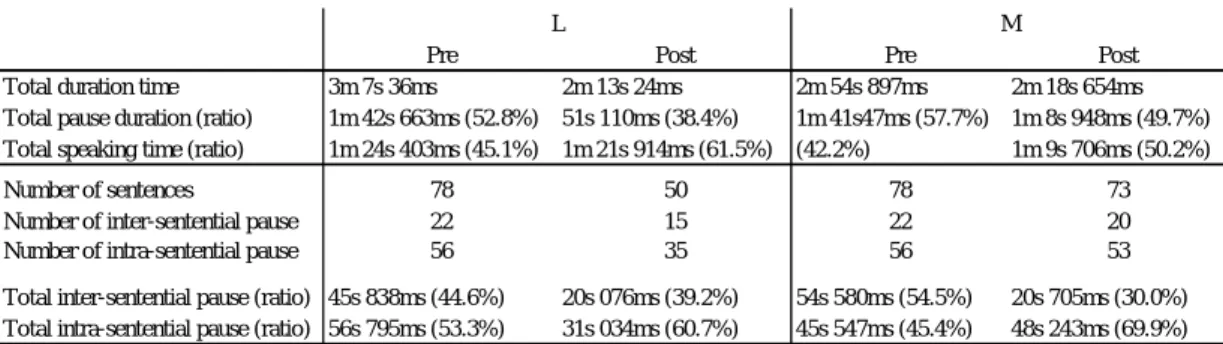
Table 4 summarizes the pause analysis results. Regarding L’s data, her total number of sentences was 78 in the pre-test. The number of inter-sentential pauses was 22, which results in the number of intra-sentential pauses totaling 56. Her total pause duration was 1m 42s 633ms. Out of the total pauses, her total inter-sentential pauses were 45s 838ms and intra-sentential pauses were 56s 795ms. In other words, 44.6% were inter-sentential pauses out of the entire pauses detected. 55.3%, which is more than half of the total pauses were intra-sentential pauses. The tendency of L’s intra-sentential pauses being slightly longer than her inter-sentential pauses did not change in her post-test. Moreover in her post-test, her intra-sentential pauses were longer than in her pre-test, that is 60.7% or 51s 110ms of pauses.
Table 4. Pause analysis result of the storytelling
Pre Post Pre Post
Total duration time 3m 7s 36ms 2m 13s 24ms 2m 54s 897ms 2m 18s 654ms
Total pause duration (ratio) 1m 42s 663ms (52.8%) 51s 110ms (38.4%) 1m 41s47ms (57.7%) 1m 8s 948ms (49.7%) Total speaking time (ratio) 1m 24s 403ms (45.1%) 1m 21s 914ms (61.5%) (42.2%) 1m 9s 706ms (50.2%)
Number of sentences 78 50 78 73
Number of inter-sentential pause 22 15 22 20
Number of intra-sentential pause 56 35 56 53
Total inter-sentential pause (ratio) 45s 838ms (44.6%) 20s 076ms (39.2%) 54s 580ms (54.5%) 20s 705ms (30.0%) Total intra-sentential pause (ratio) 56s 795ms (53.3%) 31s 034ms (60.7%) 45s 547ms (45.4%) 48s 243ms (69.9%)
L M
M’s total number of sentences was 78 in the pre-test and slightly decreased to 73 in the post-test. The number of inter-sentential pause was 22 in the pre-test and this decreased to 20 in the post-test. The number of intra-sentential pauses also showed a slight decrease in the post-test to 53 from 56 in the pre-test. Although M’s total number of sentences, inter-sentential pause and intra-sentential pause did not show a significant change, the ratio of each pause showed a big change between the pre-test and post-test. In the pre-test, M’s inter-sentential pauses were 54s 580ms, with a ratio of 54.5%. Her intra-sentential pause was 45s 547ms, which was 45.4%. From this result, we can see that M’s total
inter-sentential pauses accounted for more than half of the total pauses in the pre-test. However in her post-test, M’s inter-sentential pauses accounted for only 30.0%, and her intra-sentential pauses accounted for 69.9%. This result shows that more than half of the total pauses detected were intra-sentential pauses in M’s post-test.
3.2.2 Accuracy
3.2.2.1 Morphosyntactic accuracy
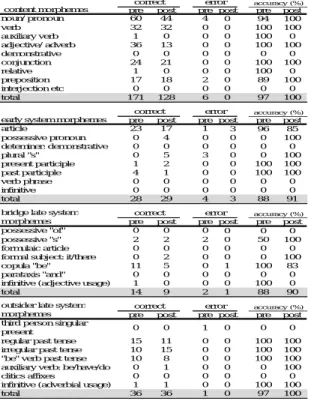
The participants’ morphosyntactic accuracy was examined using the 4-M model proposed by Myers-Scotton (2002). Table 5.1 shows the results of L’s pre-test and post-test. L showed a decline in the use of articles and copula “be” from 96% to 85% and from 100% to 83%, respectively. However, the total accuracy percentage for each morpheme showed improvement, content morphemes turned from 97% to 100%, early system morphemes from 88% to 91%, bridge late system morphemes from 88% to 90%, and outsider late system morphemes from 97% to 100%.
Table 5.1 L’s Morphosyntactic accuracy results of the storytelling
pre post pre post pre post noun/ pronoun 60 44 4 0 94 100 verb 32 32 0 0 100 100 auxiliary verb 1 0 0 0 100 0 adjective/ adverb 36 13 0 0 100 100 demonstrative 0 0 0 0 0 0 conjunction 24 21 0 0 100 100 relative 1 0 0 0 100 0 preposition 17 18 2 0 89 100 interjection etc 0 0 0 0 0 0 total 171 128 6 0 97 100
pre post pre post pre post article 23 17 1 3 96 85 possessive pronoun 0 4 0 0 0 100 deteminer: demonstrative 0 0 0 0 0 0 plural "s" 0 5 3 0 0 100 present participle 1 2 0 0 100 100 past participle 4 1 0 0 100 100 verb phrase 0 0 0 0 0 0 infinitive 0 0 0 0 0 0 total 28 29 4 3 88 91 pre post pre post pre post possessive "of" 0 0 0 0 0 0 possessive "s" 2 2 2 0 50 100 formulaic article 0 0 0 0 0 0 formal subject: it/there 0 2 0 0 0 100 copula "be" 11 5 0 1 100 83 parataxis "and" 0 0 0 0 0 0 infinitive (adjective usage) 1 0 0 0 100 0
total 14 9 2 1 88 90
pre post pre post pre post third person singular
present 0 0 1 0 0 0
regular past tense 15 11 0 0 100 100 irregular past tense 10 15 0 0 100 100 "be" verb past tense 10 8 0 0 100 100 auxiliary verb: be/have/do 0 1 0 0 0 100 clitics affixes 0 0 0 0 0 0 infinitive (adverbial usage) 1 1 0 0 100 100 total 36 36 1 0 97 100 content morphemes
early system morphemes
bridge late system morphemes
outsider late system morphemes
correct error accuracy (%)
correct error accuracy (%)
correct error accuracy (%)
correct error accuracy (%)
Table 5.2 compares the errors L made in her pre-test and post-test, regarding articles and copula “be”. The underlined part shows the errors made. The words inside the parentheses show what was omitted. What the participant did not include in the storytelling is written as “not mentioned” in parentheses. Regarding L’s use of articles in the pre-test, she used “the” where she should have said
“woke up with a start”. In the post-test, we can see some significant errors. She made three errors regarding the use of articles. She omitted articles, where she should have used them for all three errors.
Table 5.2 L’s errors in articles and the copula “be”
pre post
article Bobby woke up with the start. (not mentioned)
(not mentioned) (not mentioned) (not mentioned)
copula “be” there he saw his pet frog with his family. there was two frogs he looked in (an) owl thing. and (an) owl flew out. and soon, (a) deer took Bob
Table 6.1 shows the results for participant M. M’s total accuracy percentage showed improvement in every morpheme. Her content morpheme accuracy improved from 95% to 99%, early system morpheme from 84% to 90%, bridge late system morpheme from 17% to 60% and outsider late system morpheme from 75% to 81%. What should be noted here is that among all the improvements, M’s bridge late system morphemes showed the most improvement. M’s accuracy of the copula “be” use was 13% in the pre-test, which improved to 80% in the post-test. This resulted in an improvement in the total accuracy percentage in the bridge late system morphemes. Among all these improvements, there were also declines as seen in M’s use of regular past tense. The accuracy rate of M’s regular past tense declined from 85% to 71%.
Table 6.1 M’s Morphosyntactic accuracy results of the storytelling
pre post prepost pre post noun/ pronoun 54 72 5 0 92 100 verb 25 29 2 0 93 100 auxiliary verb 2 3 0 0 100 100 adjective/ adverb 36 15 1 0 97 100 demonstrative 0 1 0 0 0 100 conjunction 30 25 0 0 100 100 relative 0 0 0 0 0 0 preposition 16 30 0 2 100 94 interjection etc 0 0 0 0 0 0 total 163 175 8 2 95 99
pre post prepost pre post
article 33 30 4 2 89 94 possesseive pronoun 0 0 0 0 0 0 deteminer: demonstrative 0 0 0 0 0 0 plural "s" 2 3 1 1 67 75 present participle 2 2 0 0 100 100 past participle 1 1 2 1 33 50 verb phrase 0 0 0 0 0 0 infinitive 0 0 0 0 0 0 total 38 36 7 4 84 90
pre post prepost pre post possessive "of" 0 0 0 0 0 0 possessive "s" 0 0 0 0 0 0 formulaic article 0 0 0 0 0 0 formal subject: it/there 0 0 0 0 0 0 copula "be" 1 3 5 2 17 60 parataxis "and" 0 0 0 0 0 0 infinitive (adjective usage) 0 0 0 0 0 0
total 1 3 5 2 17 60
pre post prepost pre post third person singular
present 0 0 0 0 0 0
regular past tense 11 5 2 2 85 71 irregular past tense 8 13 3 4 73 76 "be" verb past tense 4 4 1 0 80 100 auxiliary verb: be/have/do 0 1 3 0 0 100 clitics affixes 0 2 0 0 0 100 infinitive (adverbial usage) 1 0 0 0 100 0
total 24 25 8 6 75 81
bridge late system morphemes
outsider late system morphemes
correct content morphemes
early system morphemes
correct
error accuracy (%)
correct error accuracy (%)
error accuracy (%)
Table 6.2 compares the errors M made in her pre-test and post-test, regarding her use of regular past. All the errors she made in the pre-test and post-test, were in her use of the verb “look”. She used the word “look” in present form when she should have used it in the past tense. This resulted in an error for the regular past morpheme.
Table 6.2 M’s errors in the regular past tense
pre post
regular past they looked around and they look around in many places
the dog still looks for the frog. (not mentioned) (not mentioned) They look out the many places and when they look around so they looked into the other side
3.2.2.2. Complexity rate
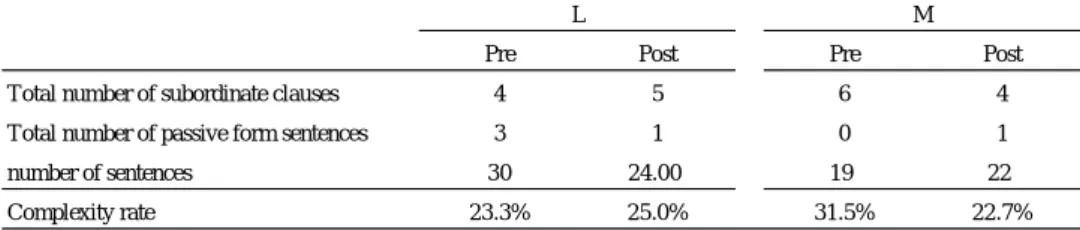
The numerical formula by Taura (2008a) as introduced in 2.4.2 was used to calculate the lexicon complexity rate. Table 7 summarizes the results for each participant.
From the calculation, L’s complexity rate slightly improved from 23.3% in the pre-test to 25.0% in the post-test. M’s complexity rate showed a large decline from 31.5% in the pre-test, to 22.7% in the post-test.
Table 7. Complexity rate results of the storytelling
Pre Post Pre Post
Total number of subordinate clauses 4 5 6 4
Total number of passive form sentences 3 1 0 1
number of sentences 30 24.00 19 22
Complexity rate 23.3% 25.0% 31.5% 22.7%
L M
3.2.3 Lexicon
The analysis results of lexical related variables are discussed below.
3.2.3.1 Type, Token and TTR analysis
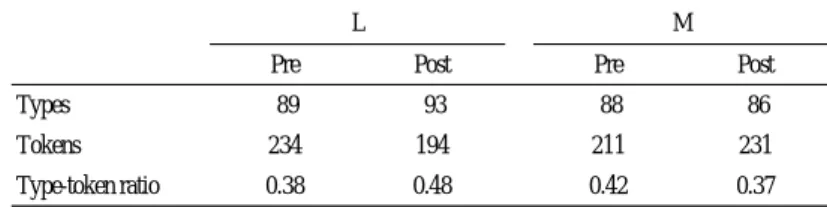
Table 8 summarizes the results of the lexical analysis of the storytelling test.
From the table, we can see that L’s total words (tokens) used in storytelling decreased from 234 to 194. However, the variation of words (types) she used all together in the storytelling showed an increase from 89 to 93 words. Also, her type-token ration (TTR) improved from 0.38 to 0.48. In other words, no
significant changes were seen in L’s lexicon and her lexical content seemed to be maintained. Meanwhile, M’s tokens used in the data increased from 211 in the pre-test to 231 in the post-test. Although there was an increase in the total number of words used, the types of words she used did not show an increase. The types she had used changed from 88 in the pre-test to 86 in the post-test. M’s TTR showed a slight decrease from 0.42 in the pre-test, to 0.37 in the post-test. M’s lexical analysis shows that, although there were some slight changes, no significant change was found and lexical stabilization was observed.
Table 8. Lexical analysis results of the storytelling
Pre Post Pre Post
Types 89 93 88 86
Tokens 234 194 211 231
Type-token ratio 0.38 0.48 0.42 0.37
M L
3.2.3.2 Lexical frequency level analysis
The “Complete Lexical Tutor” (http://lextutor.ca/vp/bnc/output.pl), also calculated the vocabulary frequency level. This level shows the percentage of words a learner uses at different vocabulary frequency levels. Each level of the word in the storytelling test was classified into twenty frequency levels.
Table 9.1 shows L’s lexical frequency level in the storytelling test. Word levels higher than 5 were combined as “other words”. From the data, we can see that approximately 90% of L’s lexical use accounted for vocabulary levels of 1 to 5. However, we can also see that some words higher than level 5 were used in the storytelling.
Table 9.1 L’s lexical frequency level analysis results of the storytelling Freqency level
pre post pre post pre post Level 1 words 66 70 184 155 78.63 79.90 Level 2 words 6 4 6 6 2.56 3.09 Level 3 words 4 5 8 7 3.42 3.61 Level 4 words 1 2 8 2 3.42 1.03 Level 5 words 2 4 11 11 4.70 5.67 total 92.73% 93.30% other words 3 3 4 3 1.71 1.56 off list 7 5 13 10 5.56 5.15 total 89 93 234 194 100% 100%
Type Token Token Coverage (%)
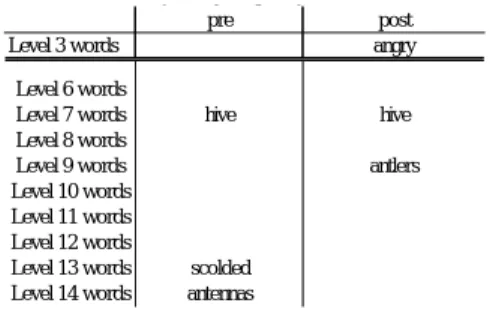
Table 9.2 shows detailed information of the words higher than level 5. From the table, we can see that L used the same word “hive” in both pre-test and post-test, which belongs to the frequency level 7. From this, we can see that the word “hive” was retained. The highest frequency word that L used in the
pre-test was “antennas” which belongs to level 14. However, this was a mistake that L made in the pre-test, because she was supposed to use the word “antlers” in this section. In the post-test, L used the correct word, “antlers” which is frequency level 9.
What we should note here is the level 13 word, “scolded”, used in the pre-test. L used this word when she said “Bobby then scolded the dog” in the pre-test. In the post-test when she described the same picture, she said “Bob was angry at him”. She had replaced the word “scolded” for “angry” which only belongs to level 5. From this, we can see that there were changes in L’s lexical frequency levels although the types, tokens and type-token ratio did not change greatly.
Table 9.2 L’s storytelling frequency level words
y g f q y
pre post
Level 3 words angry
Level 6 words
Level 7 words hive hive Level 8 words
Level 9 words antlers Level 10 words
Level 11 words Level 12 words
Level 13 words scolded Level 14 words antennas
Table 10.1 shows the frequency level analysis of M’s storytelling data. From the table we can see that M’s lexical use included words only from level 1 to level 5 in both pre-test and post-test. From this number it can be said that, no significant change was observed when comparing the pre-test and post-test.
Table 10.1 M’s lexical frequency level analysis results of the storytelling Freqency level
pre post pre post pre post Level 1 words 73 76 186 211 88.15 91.34 Level 2 words 3 1 3 1 1.42 0.43 Level 3 words 6 5 6 7 2.84 3.03 Level 4 words 1 0 1 0 0.47 0.00 Level 5 words 3 2 13 9 6.16 3.90 total 99.04% 98.70% other words 0 0 0 0 0 0 off list 2 2 2 3 0.95 1.30 total 88 86 211 231 100% 100%
Token Token Coverage (%) Type
Table 10.2 shows the frequency level of the lexicon M used in her storytelling. Although there were no significant changes seen, there were also some changes in M’s lexical frequency level, within the frequency levels of 1 through 3. For example, M used level 1 word “realized” in the pre-test. Her use changed to “found out” in the post-test, which is also a level 1 word. The word “pond” is frequency level 3, and the word “lake” she used in the post-test is also frequency level 3. From these examples, we
can see that although M used different words between the pre-test and post-test, her frequency level did not change largely.
M’s use of the word “branch” showed a slight decline in frequency level. She used the word “branch” in the pre-test which belongs to frequency level 2. In the post-test, she used the frequency level 1 word “wood” as a substitute. A small decline was seen in this part. In addition, from the table we can see that some lexical phrases were retained throughout the pre-test and post-test. A typical example of this is the phrase used in the beginning of the storytelling, “once upon a time”. M used this phrase both in the pre-test and post-test. M also used the word “cliff” in both pre-data and post-test. We can assume that the phrase and word, “once upon a time” and “cliff” were retained.
Table 10.2 M’s storytelling frequency level words
3.3 Writing test (TOWL-3)
3.3.1 Raw score and Age conversion
Table 11.1 and 11.2 show the raw scores and age conversion results of the participants’ writing tests. The raw scores suggest that L’s score did not undergo much change. Her raw score on the CL and StC increased, but her age conversion did not change and was 17;09 on both the pre-test and post-test. Her CC showed a slight decrease and her age conversion of her CC result changed to 16;03 from 17;09. However, L’s chronological age was 15;00 on the pre-test, and 15;06 on the post-test. Comparing the age conversion with L’s actual age, it can be said that L had a high ability of writing skill and her initial proficiency was high from the start.
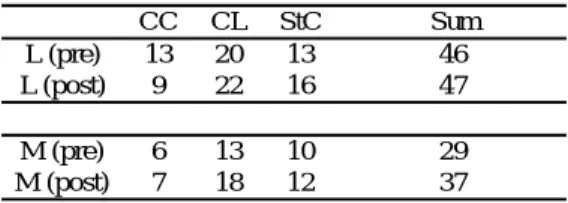
M’s scores show improvement in each of the sections. Her total score improved from 29 in the pre-test to 37 in the post-test. From this result, M’s age conversion showed improvement in all three sections. M’s StC which showed the most improvement in the age conversion was 11;0 in the pre-test, but improved to 16;3 in the post-test. Her CL showed also showed an improvement to 17;09 which was approximately her chronological age. This indicates that although M’s L2 environment changed, her writing skills did not show a decline but even showed a progress. She especially showed advancement in her skills of StC, which is the skill to construct a story from the start to the end.
Pre Post
Level 1 words once upon a time once upon a time
realized found out
wood
Level 2 words branch
Level 3 words cliff cliff
Table 11.1 Raw scores results Table 11.2 Age conversion results CC CL StC Sum L (pre) 13 20 13 46 L (post) 9 22 16 47 M (pre) 6 13 10 29 M (post) 7 18 12 37 g ( )
CC CL StC Quotient Chronological age
L (pre) 17;9 17;9 17;9 134 15;00
L (post) 16;3 17;9 17;9 136 15;06
M (pre) 10;6 14;0 11;0 98 17;05
M (post) 11;6 17;9 16;3 115 17;11
3.3.2 Fluency
Table 12 summarizes the fluency analysis account of the writing data.From the data, we can see that L showed some decline in her fluency of types and tokens. She showed a slight increase in her number of sentences. Looking at this result, L’s data virtually did not show any change. Her fluency in writing can be said to have been retained.
Regarding M’s result, she showed an increase in all types, tokens and the number of sentences. From this result we can say that M’s writing fluency was retained and even more, improved.
Table 12. Fluency analysis results of the writing test
Pre Post Fluency (Pre/Post) Pre Post Fluency (Pre/Post)
Types 123 144 8.2/7.5 65 105 4.3/7.0 Tokens 1239 226 15.9/15.0 105 107 7.0/12.1 Number of sentences 22 19 1.5/1.7 9 19 0.6/1.3 L M 3.3.3 Accuracy 3.3.3.1 Morphosyntactic accuracy
Table 13.1 shows the result of L’s morphosyntactic accuracy of the writing test. L’s total accuracy of content morphemes virtually stayed the same, 99% and 100% respectively. However, her early system morphemes, bridge late system morphemes and outside late system morphemes showed a decline overall, from 97% to 96%, 94% to 88% and 100% to 97%, respectively. What showed the most declines in L’s writing test was her accurate use of copula “be”, which declined to 88% in the post-test from 94% in the pre-test.
Table 13.2 compares L’s errors regarding her use of copula “be” in the pre-test and post-test. She tended to make mistakes such as omitting the copula “be” or using the singular form “was” where she should have used the plural form “were”. For example, “Forty men was going to be needed” was written in her post-writing test.
In contrast to L, M’s accurate use of morphemes showed improvement in all four morphemes as can be seen in Table 14.1. The only part that showed decline was M’s use of the regular past tense. Her
accuracy percentage was 100% in the pre-test, which had declined to 50% in the post-test. In the pre-test, M’s use of the past tense was only once without any error, resulting in 100% of accuracy. In the post-test, her use of the past tense occurred twice and the number of errors was also twice. This indicates that, although her use of regular past tense showed a slight increase, her errors also increased which resulted in her accuracy percentage declining to 50%. While her use of past tense showed a decline, her total accuracy percentage in the use of outsider late system morphemes improved to 88% in the post-test, from 57% in the pre-test. This is due to the fact that although her use in past tense declined, her use of the third person present singular “s” improved greatly in the post-test. Her third person present singular “s” was 25% in the pre-test, and this had changed to 100% in the post. From this result, her total accuracy of outsider late system morphemes was 63% in the pre, and 88% in the post-test.
Table 13.1 L’s Morphosyntactic accuracy results of the writing test
content morphemes error
pre post pre post pre post noun/ pronoun 79 68 2 0 98 100 verb 39 34 0 0 100 100 auxiliary verb 2 2 0 0 100 100 adjective/ adverb 25 45 0 0 100 100 demonstrative 0 0 0 0 0 0 conjunction 18 15 0 0 100 100 relative 3 1 0 0 100 100 preposition 22 20 1 0 96 100 interjection etc 0 0 0 0 0 0 total 188 185 2 0 99 100
pre post pre post pre post
article 17 11 1 1 94 92 possessive pronoun 0 0 0 0 0 0 deteminer: demonstrative 0 0 0 0 0 0 plural "s" 10 20 0 1 100 95 present participle 3 7 0 0 100 100 past participle 2 3 0 0 100 100 verb phrase 0 1 0 0 0 100 infinitive 0 3 0 0 0 100 total 32 45 1 2 97 96
pre post pre post pre post possessive "of" 0 0 0 0 0 0 possessive "s" 0 0 0 0 0 0 formulaic article 0 0 0 0 0 0 formal subject: it/there 0 0 0 0 0 0 copula "be" 16 15 1 2 94 88 parataxis "and" 0 0 0 0 0 0 infinitive (adjective usage) 0 1 0 0 0 100
total 16 16 1 2 94 89
pre post pre post pre post third person singular
present 0 0 0 0 0 0
regular past tense 11 7 0 0 100 100 irregular past tense 9 7 0 0 100 100 "be" verb past tense 13 15 0 1 100 94 auxiliary verb: be/have/do 0 0 0 0 0 0 clitics affixes 2 0 0 0 100 0 infinitive (adverbial usage) 2 2 0 0 100 100
total 37 31 0 1 100 97
outsider late system morphemes
correct error accuracy (%) bridge late system
morphemes
early system morphemes
accuracy (%) correct
correct error accuracy (%)
correct error accuracy (%)
Table 13.2 L’s errors in the copula “be”
pre post
coupla "be" found wolves and nothing that (was) big.
Forty men was going to be needed One of the lead programmers were on the