Genetic variants of SLC17A1
are associated with
cholesterol homeostasis and
hyperhomocysteinaemia in
Japanese men
Teruhide Koyama1, Daisuke Matsui1, Nagato Kuriyama1, Etsuko Ozaki1, Keitaro Tanaka2, Isao Oze3, Nobuyuki Hamajima4, Kenji Wakai5, Rieko Okada5, Kokichi Arisawa6,
Haruo Mikami7, Keiichi Shimatani8, Akie Hirata9, Naoyuki Takashima10, Sadao Suzuki11, Chisato Nagata12, Michiaki Kubo13 & Hideo Tanaka3
Hyperuricaemia is an undisputed and highly predictive biomarker for cardiovascular risk. SLC17A1, expressed in the liver and kidneys, harbours potent candidate single nucleotide polymorphisms that decrease uric acid levels. Therefore, we examined SLC17A1 polymorphisms (rs1165196, rs1179086, and rs3757131), which might suppress cardiovascular risk factors and that are involved in liver functioning, via a large-scale pooled analysis of the Japanese general population in a cross-sectional study. Using data from the Japan Multi-Institutional Collaborative Cohort Study, we identified 1842 participants of both sexes, 35–69-years-old, having the requisite data, and analysed their SLC17A1 genotypes. In men, logistic regression analyses revealed that minor alleles in SLC17A1 polymorphisms (rs1165196 and rs3757131) were associated with a low-/high-density lipoprotein cholesterol ratio >2.0 (rs1165196: odds ratio [OR], 0.703; 95% confidence interval [CI], 0.536–0.922; rs3757131: OR, 0.658; 95% CI, 0.500–0.866), and with homocysteine levels of >10.0 nmol/mL (rs1165196: OR, 0.544; 95% CI, 0.374–0.792; rs3757131: OR, 0.509; 95% CI, 0.347–0.746). Therefore, these polymorphisms had dominant negative effects on cholesterol homeostasis and hyperhomocysteinaemia, in men, independent of alcohol consumption, physical activity, or daily energy and nutrition intake. Thus, genetic variants of SLC17A1 are potential biomarkers for altered cholesterol homeostasis and hyperhomocysteinaemia in Japanese men.
1Department of Epidemiology for Community Health and Medicine, Kyoto Prefectural University of Medicine, Kyoto, Japan. 2Department of Preventive Medicine, Faculty of Medicine, Saga University, Saga, Japan. 3Division of Epidemiology and Prevention, Aichi Cancer Center Research Institute, Nagoya, Japan. 4Department of Healthcare Administration, Nagoya University Graduate School of Medicine, Nagoya, Japan. 5Department of Preventive Medicine, Nagoya University Graduate School of Medicine, Nagoya, Japan. 6Department of Preventive Medicine, Institute of Health Biosciences, The University of Tokushima Graduate School, Tokushima, Japan. 7Division of Cancer Registry, Prevention and Epidemiology, Chiba Cancer Center, Chiba, Japan. 8Department of International Island and Community Medicine, Kagoshima University Graduate School of Medical and Dental Science, Kagoshima, Japan. 9Department of Geriatric Medicine, Graduate School of Medical Sciences, Kyushu University, Fukuoka, Japan. 10Department of Public Health, Shiga University of Medical Science, Otsu, Japan. 11Department of Public Health, Nagoya City University Graduate School of Medical Sciences, Nagoya, Japan. 12Department of Epidemiology and Preventive Medicine, Gifu University Graduate School of Medicine, Gifu, Japan. 13Laboratory for Genotyping Development, Center for Genomic Medicine, RIKEN, Yokohama, Japan. Correspondence and requests for materials should be addressed to T.K. (email: [email protected])
Received: 07 May 2015 Accepted: 05 October 2015 Published: 03 November 2015
Cardiovascular diseases, including coronary heart disease, stroke, and peripheral arterial disease, are the most prevalent conditions and leading causes of mortality, worldwide. In addition, age, sex, overweight, hypertension, smoking, and diabetes are widely accepted as major risk factors for the development of cardiovascular disease1. Furthermore, recent studies have reported that hyperuricaemia2–4 and elevated
levels of homocysteine5,6 are also associated with cardiovascular disease, and a significant positive
corre-lation has been observed between the serum concentrations of uric acid and homocysteine7.
In addition to the above-mentioned factors, altered lipid metabolism, such as the disruption of cho-lesterol homeostasis via altered liver function, is another major risk factor for cardiovascular disease8.
Cholesterol is a critical lipid that is a component of biological cell membranes and is an important precur-sor of steroid hormones and bile acids. Unfortunately, the disruption of cholesterol homeostasis signifi-cantly increases the risk of premature cardiovascular disease9. To monitor for this disruption, low-density
lipoprotein cholesterol (LDL-C) and high-density lipoprotein cholesterol (HDL-C) are among the most commonly used clinical biomarkers10, with high LDL-C and low HDL-C levels indicating major risks for
the development of coronary heart disease11. In addition, prospective studies investigating different racial
and ethnic populations have confirmed that HDL-C is a strong, consistent, and independent predictive factor for the incidence of cardiovascular disease10,12. Furthermore, the Framingham study demonstrated
that a combination of high LDL-C and low HDL-C levels is a strong predictor of the relative risk of car-diovascular events13. Moreover, the LDL-C/HDL-C ratio is a precise marker of cholesterol homeostasis,
and can help predict cardiovascular events14.
Previous genome-wide association studies have examined the genetic factors that control serum uric acid concentrations, and have identified 14 candidate causal single nucleotide polymorphisms (SNPs) and two pathways involving the PKD2, SLC17A1, SLC17A3, SLC17A4, and SLC2A9 genes15. One of
these genes (SLC17A1) encodes the solute carrier family 17 (organic anion transporter), member 1, which is also known as sodium phosphate transport protein 1. This protein is expressed in the sinusoidal membrane of hepatocytes and in the proximal tubules in the kidneys16; in the proximal tubules, it acts
as a renal transporter of uric acid and mediates the co-transport of sodium and inorganic phosphate17.
Additionally, SLC17A1 SNPs are associated with kidney function indicators, such as suppressed serum uric levels and gout, in Japanese men18. Because hyperuricaemia is an undisputed and highly effective
biomarker for predicting cardiovascular risk, SLC17A1 SNPs might also suppress cardiovascular risk factors. However, whether SLC17A1 SNPs, associated with liver function, are also associated with car-diovascular risk factors remains unknown. Cholesterol and homocysteine are both metabolised in the liver; therefore, we analysed three SLC17A1 SNPs (rs1165196, rs1179086, and rs3757131) to evaluate their association with cholesterol homeostasis and homocysteine levels, and their roles as predictors of cardiovascular events. This analysis was conducted as a cross-sectional study using a large-scale pooled analysis of the Japanese general population.
Results
Participant characteristics. Table 1 shows the participants’ characteristics, including their anthropo-metric measures, blood chemistry data, questionnaire responses, total energy and macronutrient intake, and distribution of the three polymorphisms according to sex. The mean age of the included men was 55.6 years, compared to 54.8 years for the women. Significant differences were not observed in compar-isons of the metabolic equivalents (METs) and polymorphism allele frequency data between the men and women. Furthermore, the allele frequencies for the polymorphisms were similar to those in other Japanese populations18, and were in agreement with the Hardy-Weinberg equilibrium (rs1165196 for
men: χ 2 = 0.571, p = 0.319; rs1165196 for women: χ 2 = 1.241, p = 0.265; rs1179086 for men: χ 2 = 0.023,
p = 0.877; rs1179086 for women: χ 2 = 1.350, p = 0.245; rs3757131 for men: χ 2 = 0.284, p = 0.593;
rs3757131 for women: χ 2 = 1.053, p = 0.304).
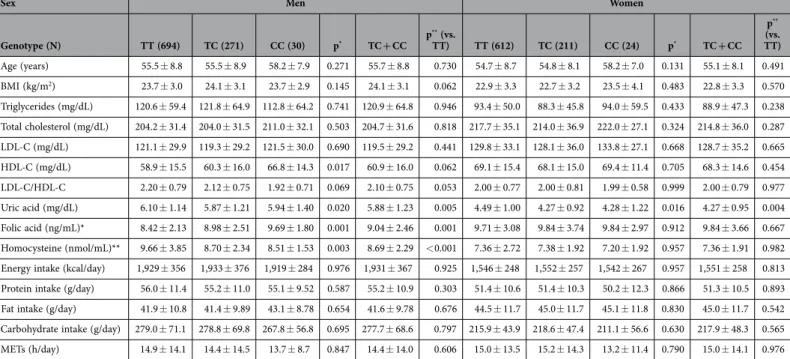
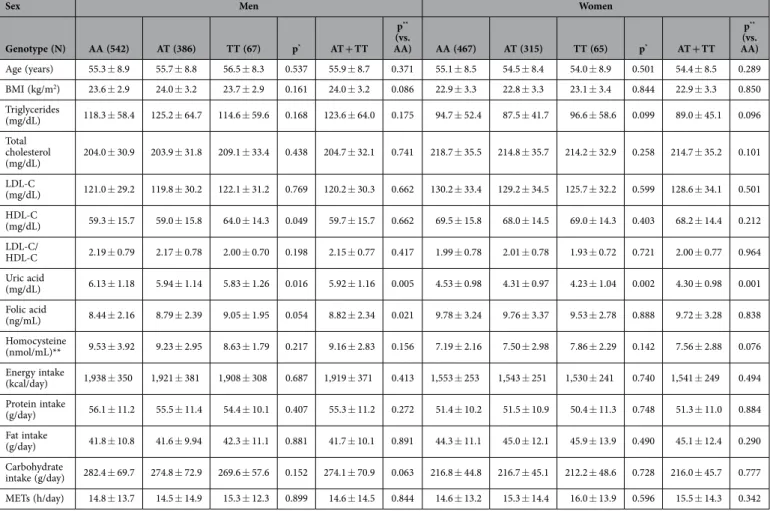
Associations between polymorphisms and participant characteristics, according to sex. The distributions of the three polymorphism genotypes are listed in Tables 2–4. For each genotype, the major homozygotes had significantly higher levels of uric acid, compared to the heterozygotes and minor homozygotes, in both sexes. Similarly, the major homozygous alleles in rs1165196 and rs3757131 exhib-ited high homocysteine and low folic acid levels in men. We also compared the major homozygotes with the heterozygotes and minor homozygotes. In men, rs1165196 and rs3757131 exhibited similar statistical significance. When compared to the major homozygous alleles, the combined minor genotype (TC + CC in rs1165196 and CT + TT in rs3757131) was associated with significantly higher folic acid levels, and significantly lower uric acid and homocysteine levels. In contrast, women did not demonstrate any sig-nificant variables associated with uric acid and homocysteine levels in each genotype.
Associations of polymorphism genotypes with LDL-C/HDL-C ratios and homocysteine levels.
Table 5 shows the proportion of participants with LDL-C/HDL-C ratios ≤ 2.0 and those > 2.0, according to the polymorphism genotypes. For the logistic regression analysis, the major homozygous genotypes were used as the reference group and the heterozygous and minor homozygous genotypes were used as the exposed group in the dominant model. When we combined the TC and CC genotypes for rs1165196 as the low-risk genotype comparison group (assuming a dominant effect for the variant C allele), the
combined genotype (TC + CC) in men was associated with a significantly lower proportion of partici-pants with an LDL-C/HDL-C ratio of > 2.0 (OR, 0.703; 95% CI, 0.536–0.922; OR adjusted for age, body mass index [BMI], research area, alcohol consumption and smoking habits, 0.642; 95% CI, 0.483–0.853), relative to the TT genotype. The combined genotype (CT + TT) in rs3757131 was also associated with a significantly lower proportion of participants with an LDL-C/HDL-C ratio > 2.0 (OR, 0.658; 95% CI, 0.500–0.866; OR adjusted for age, BMI, research area, alcohol consumption and smoking habits, 0.607; 95% CI, 0.455–0.808), relative to the major homozygous alleles. When we compared the rs1165196 and rs3757131 alleles in men using an LDL-C/HDL-C ratio of > 2.0, rs1165196 had a significantly lower
Men (n = 995) Women (n = 847)
Mean ± SD (%) CV (%) Mean ± SD (%) CV (%) p-value
Age (years) 55.6 ± 8.8 15.8 54.8 ± 8.5 15.5 0.052 BMI (kg/m2) 23.8 ± 3.1 13.0 22.9 ± 3.3 14.4 < 0.001 Triglycerides (mg/dL) 120.7 ± 61.0 50.5 92.2 ± 49.3 53.4 < 0.001 Total cholesterol (mg/dL) 204.3 ± 31.4 15.3 216.9 ± 35.4 16.3 < 0.001 LDL-C (mg/dL) 120.6 ± 29.7 24.6 129.5 ± 33.7 26.0 < 0.001 HDL-C (mg/dL) 59.5 ± 15.7 26.3 68.9 ± 15.2 22.0 < 0.001 LDL-C/HDL-C 2.17 ± 0.78 35.9 2.00 ± 0.77 38.5 < 0.001 Uric acid (mg/dL) 6.03 ± 1.17 19.4 4.43 ± 0.99 22.3 < 0.001 Folic acid (ng/mL)* 8.61 ± 2.25 26.1 9.75 ± 3.26 33.4 < 0.001 Homocysteine (nmol/mL)** 9.37 ± 3.48 37.1 7.36 ± 2.51 34.1 < 0.001
Energy intake (kcal/day) 1,930 ± 360 18.6 1,547 ± 251 16.2 < 0.001
Protein intake (g/day) 55.8 ± 11.2 20.0 51.3 ± 10.5 20.4 < 0.001
Fat intake (g/day) 41.8 ± 10.5 25.1 44.6 ± 11.7 26.2 < 0.001
Carbohydrate intake (g/day) 278.6 ± 70.3 25.2 216.4 ± 45.1 20.8 < 0.001
METs (h/day) 14.7 ± 14.0 95.2 15.0 ± 13.7 91.3 0.693 Alcohol drinking 0 g/d 393 (39.4) 593 (70.0) 0.1–22.9 g/d 414 (41.6) 238 (28.0) < 0.001 23.0–45.9 g/d 122 (12.2) 15 (1.77) ≥ 46.0 g/d 66 (6.63) 1 (0.11) Smoking Current 272 (27.3) 45 (5.31) < 0.001 Former 433 (43.5) 25 (2.95) Never 290 (29.1) 777 (91.7) rs1165196 TT 694 (69.7) 612 (72.2) 0.496 TC 271 (27.2) 211 (24.9) CC 30 (3.01) 24 (2.83) rs1179086 AA 542 (54.4) 467 (55.1) 0.634 AT 386 (38.7) 315 (37.1) TT 67 (6.73) 65 (7.67) rs3757131 CC 703 (70.6) 610 (72.0) 0.795 CT 264 (26.5) 213 (25.1) TT 28 (2.81) 24 (2.83)
Table 1. Clinical characteristics and genotype frequencies of the participants, according to sex. Data
are means ± standard deviation. CV, coefficient of variance BMI, body mass index; LDL-C, low-density lipoprotein cholesterol. HDL-C, high-density lipoprotein cholesterol; METs, metabolic equivalents. Sex-related differences were analysed using the t-test, Chi-square tests were used for smoking and alcohol habits and genotypes. *Men = 751, Women = 620, **Men = 719, Women = 606.
frequency of the C allele, whereas rs3757131 had a significantly lower frequency of the T allele (T vs. C alleles in rs1165196: OR, 0.726; 95% CI, 0.573–0.920; C vs. T alleles in rs3757131: OR, 0.689; 95% CI, 0.542–0.876). Furthermore, we found that physical activity and daily energy or nutritional intake did not affect the LDL-C/HDL-C ratio in rs1165196 or rs3757131. In contrast, the proportions of women with an LDL-C/HDL-C ratio of > 2.0 were not significantly different when the various polymorphism genotypes were compared.
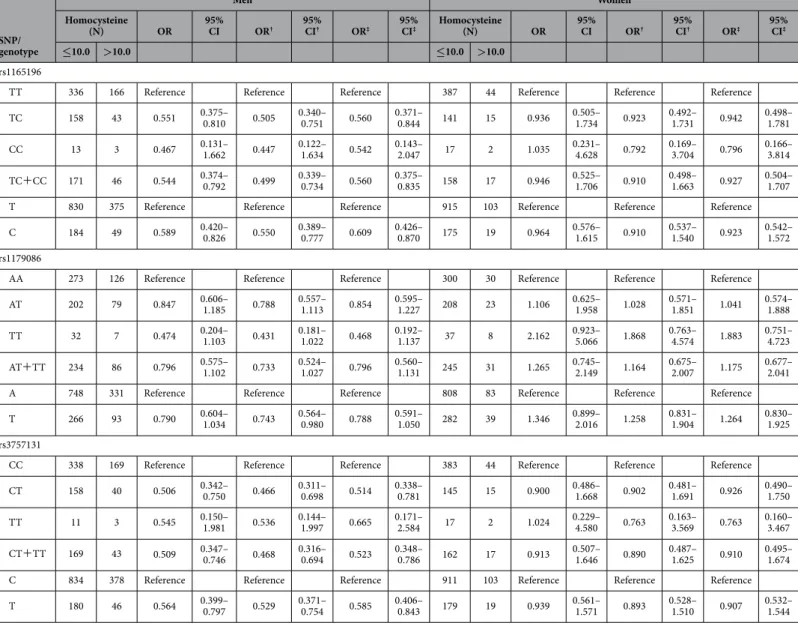
Similar analyses were performed for homocysteine levels (Table 6). In men, when we compared the alleles for rs1165196 and rs3757131 using homocysteine levels of > 10.0 nmol/mL, rs1165196 had a sig-nificantly lower frequency of the C allele, whereas rs3757131 had a sigsig-nificantly lower frequency of the T allele (T vs. C alleles in rs1165196: OR, 0.589; 95% CI, 0.420–0.826; C vs. T alleles in rs3757131: OR, 0.564; 95% CI, 0.399–0.797). Moreover, we confirmed that the tendency attenuated the relationship between hyperhomocysteinaemia and the SLC17A1 polymorphisms, after adjusting for folic acid levels. In contrast, the proportion of women with homocysteine levels >10.0 nmol/mL were not significantly different when we compared the various polymorphism genotypes.
Discussion
High levels of uric acid are historically associated with gout, although recent studies have revealed that they might also be associated with cardiovascular disease and the incidence of coronary heart disease, hypertension, stroke, metabolic syndrome, and other disorders. Therefore, patients presenting with high uric acid levels should be screened and treated for comorbid cardiovascular risk factors19. Furthermore,
a previous genome-wide association study of uric acid transporters revealed that several SNPs were significant genetic determinants of uric acid levels20. In that study, the SLC17A1 polymorphisms
exhib-ited an association with low serum levels of uric acid. The polymorphisms of interest for SLC17A1 are rs1165196, rs1179086, and rs3757131; these polymorphisms are known to be associated with low levels of uric acid in Japanese men18. However, because these three SNPs exhibit strong linkage disequilibrium18,
determining which SNP is responsible for the functional changes in SLC17A1 is difficult. In agreement with these previous studies, our findings revealed significant associations between the SLC17A1 poly-morphisms and uric acid levels in Japanese men. Furthermore, in the present study, we also compared the associations between various SLC17A1 genotypes and cardiovascular risk factors via altered choles-terol homeostasis and hyperhomocysteinaemia, after combining the heterozygous and minor homozy-gous alleles due to the small number of minor homozygotes. Our results indicated that, among male participants, the presence of minor alleles in rs1165196 and rs3757131 were associated with significantly lower homocysteine levels, compared to the major alleles. In addition, the odds of having a high LDL-C/
Sex Men Women
Genotype (N) TT (694) TC (271) CC (30) p* TC + CC p ** (vs. TT) TT (612) TC (211) CC (24) p* TC + CC p** (vs. TT) Age (years) 55.5 ± 8.8 55.5 ± 8.9 58.2 ± 7.9 0.271 55.7 ± 8.8 0.730 54.7 ± 8.7 54.8 ± 8.1 58.2 ± 7.0 0.131 55.1 ± 8.1 0.491 BMI (kg/m2) 23.7 ± 3.0 24.1 ± 3.1 23.7 ± 2.9 0.145 24.1 ± 3.1 0.062 22.9 ± 3.3 22.7 ± 3.2 23.5 ± 4.1 0.483 22.8 ± 3.3 0.570 Triglycerides (mg/dL) 120.6 ± 59.4 121.8 ± 64.9 112.8 ± 64.2 0.741 120.9 ± 64.8 0.946 93.4 ± 50.0 88.3 ± 45.8 94.0 ± 59.5 0.433 88.9 ± 47.3 0.238 Total cholesterol (mg/dL) 204.2 ± 31.4 204.0 ± 31.5 211.0 ± 32.1 0.503 204.7 ± 31.6 0.818 217.7 ± 35.1 214.0 ± 36.9 222.0 ± 27.1 0.324 214.8 ± 36.0 0.287 LDL-C (mg/dL) 121.1 ± 29.9 119.3 ± 29.2 121.5 ± 30.0 0.690 119.5 ± 29.2 0.441 129.8 ± 33.1 128.1 ± 36.0 133.8 ± 27.1 0.668 128.7 ± 35.2 0.665 HDL-C (mg/dL) 58.9 ± 15.5 60.3 ± 16.0 66.8 ± 14.3 0.017 60.9 ± 16.0 0.062 69.1 ± 15.4 68.1 ± 15.0 69.4 ± 11.4 0.705 68.3 ± 14.6 0.454 LDL-C/HDL-C 2.20 ± 0.79 2.12 ± 0.75 1.92 ± 0.71 0.069 2.10 ± 0.75 0.053 2.00 ± 0.77 2.00 ± 0.81 1.99 ± 0.58 0.999 2.00 ± 0.79 0.977 Uric acid (mg/dL) 6.10 ± 1.14 5.87 ± 1.21 5.94 ± 1.40 0.020 5.88 ± 1.23 0.005 4.49 ± 1.00 4.27 ± 0.92 4.28 ± 1.22 0.016 4.27 ± 0.95 0.004 Folic acid (ng/mL)* 8.42 ± 2.13 8.98 ± 2.51 9.69 ± 1.80 0.001 9.04 ± 2.46 0.001 9.71 ± 3.08 9.84 ± 3.74 9.84 ± 2.97 0.912 9.84 ± 3.66 0.667 Homocysteine (nmol/mL)** 9.66 ± 3.85 8.70 ± 2.34 8.51 ± 1.53 0.003 8.69 ± 2.29 < 0.001 7.36 ± 2.72 7.38 ± 1.92 7.20 ± 1.92 0.957 7.36 ± 1.91 0.982
Energy intake (kcal/day) 1,929 ± 356 1,933 ± 376 1,919 ± 284 0.976 1,931 ± 367 0.925 1,546 ± 248 1,552 ± 257 1,542 ± 267 0.957 1,551 ± 258 0.813
Protein intake (g/day) 56.0 ± 11.4 55.2 ± 11.0 55.1 ± 9.52 0.587 55.2 ± 10.9 0.303 51.4 ± 10.6 51.4 ± 10.3 50.2 ± 12.3 0.866 51.3 ± 10.5 0.893
Fat intake (g/day) 41.9 ± 10.8 41.4 ± 9.89 43.1 ± 8.78 0.654 41.6 ± 9.78 0.676 44.5 ± 11.7 45.0 ± 11.7 45.1 ± 11.8 0.830 45.0 ± 11.7 0.542
Carbohydrate intake (g/day) 279.0 ± 71.1 278.8 ± 69.8 267.8 ± 56.8 0.695 277.7 ± 68.6 0.797 215.9 ± 43.9 218.6 ± 47.4 211.1 ± 56.6 0.630 217.9 ± 48.3 0.565
METs (h/day) 14.9 ± 14.1 14.4 ± 14.5 13.7 ± 8.7 0.847 14.4 ± 14.0 0.606 15.0 ± 13.5 15.2 ± 14.3 13.2 ± 11.4 0.790 15.0 ± 14.1 0.976
Table 2. The distribution of the participants, according to sex, for rs1165196. Data are presented as
means ± standard deviation; BMI, body mass index; LDL-C, low-density lipoprotein cholesterol; HDL-C, high-density lipoprotein cholesterol; METs, metabolic equivalents. Genotype differences were analysed using one-way analysis of variance*, or the t-test**. *Men (TT = 524, TC = 208, CC = 19) Women (TT= 439,
HDL-C ratio or hyperhomocysteinaemia were significantly lower for patients with the minor alleles (vs. the major homozygous alleles), both before and after adjusting for age, BMI, research area, daily energy and nutritional intake, and alcohol consumption and smoking habits.
In healthy humans, uric acid is excreted in the urine, although kidney disease can impair this excre-tion route, leading to hyperuricaemia. In addiexcre-tion, hyperuricaemia can be caused by the increased gen-eration of uric acid. Furthermore, exposure to lead or diets involving excessive intake of alcohol, purine nucleotides, protein, and carbohydrates can also contribute to high levels of uric acid3. However, in
the present study, we found that alcohol consumption, physical activity, and daily energy or nutritional intake were not different for each SNP. Another potential mechanism leading to high uric acid levels is mutation(s) in the genes coding for the glucokinase regulatory protein; PDZ domain-containing pro-teins; and transporters of organic anions, glucose, ATP-binding cassettes, or monocarboxylic acid15,20,21;
these transport proteins are key regulators of uric acid levels. Interestingly, SLC17A1 is the gene involved in the renal transport of uric acid, and has been associated with low uric acid levels18.
HDL-C is an undisputed and highly predictive biomarker of cardiovascular risk. In this context, HDL-C is central to reverse cholesterol transport, which is the cardioprotective mechanism by which cholesterol, synthesized in the peripheral tissues, is transported to the liver for degradation or recycling. Various factors can result in elevated HDL-C levels, including smoking, alcohol consumption, exercise, and statin therapy. However, epidemiological studies have demonstrated that uric acid levels are inversely correlated with HDL-C levels22, and that there is a strong relationship between LDL-C levels and the
incidence of atherosclerotic cardiovascular disease10,23. Another recent study has demonstrated that the
LDL-C/HDL-C ratio is a precise marker of cholesterol homeostasis, and can be used to predict the risk of cardiovascular events24. Nicholls et al. showed that an LDL-C/HDL-C ratio > 2.0 was associated
with plaque progression (despite statin usage), whereas a ratio < 1.5 was significantly associated with plaque regression25. Many studies have indicated that cholesterol homeostasis is a major mechanism for
Sex Men Women
Genotype (N) AA (542) AT (386) TT (67) p* AT + TT p** (vs. AA) AA (467) AT (315) TT (65) p* AT + TT p** (vs. AA) Age (years) 55.3 ± 8.9 55.7 ± 8.8 56.5 ± 8.3 0.537 55.9 ± 8.7 0.371 55.1 ± 8.5 54.5 ± 8.4 54.0 ± 8.9 0.501 54.4 ± 8.5 0.289 BMI (kg/m2) 23.6 ± 2.9 24.0 ± 3.2 23.7 ± 2.9 0.161 24.0 ± 3.2 0.086 22.9 ± 3.3 22.8 ± 3.3 23.1 ± 3.4 0.844 22.9 ± 3.3 0.850 Triglycerides (mg/dL) 118.3 ± 58.4 125.2 ± 64.7 114.6 ± 59.6 0.168 123.6 ± 64.0 0.175 94.7 ± 52.4 87.5 ± 41.7 96.6 ± 58.6 0.099 89.0 ± 45.1 0.096 Total cholesterol (mg/dL) 204.0 ± 30.9 203.9 ± 31.8 209.1 ± 33.4 0.438 204.7 ± 32.1 0.741 218.7 ± 35.5 214.8 ± 35.7 214.2 ± 32.9 0.258 214.7 ± 35.2 0.101 LDL-C (mg/dL) 121.0 ± 29.2 119.8 ± 30.2 122.1 ± 31.2 0.769 120.2 ± 30.3 0.662 130.2 ± 33.4 129.2 ± 34.5 125.7 ± 32.2 0.599 128.6 ± 34.1 0.501 HDL-C (mg/dL) 59.3 ± 15.7 59.0 ± 15.8 64.0 ± 14.3 0.049 59.7 ± 15.7 0.662 69.5 ± 15.8 68.0 ± 14.5 69.0 ± 14.3 0.403 68.2 ± 14.4 0.212 LDL-C/ HDL-C 2.19 ± 0.79 2.17 ± 0.78 2.00 ± 0.70 0.198 2.15 ± 0.77 0.417 1.99 ± 0.78 2.01 ± 0.78 1.93 ± 0.72 0.721 2.00 ± 0.77 0.964 Uric acid (mg/dL) 6.13 ± 1.18 5.94 ± 1.14 5.83 ± 1.26 0.016 5.92 ± 1.16 0.005 4.53 ± 0.98 4.31 ± 0.97 4.23 ± 1.04 0.002 4.30 ± 0.98 0.001 Folic acid (ng/mL) 8.44 ± 2.16 8.79 ± 2.39 9.05 ± 1.95 0.054 8.82 ± 2.34 0.021 9.78 ± 3.24 9.76 ± 3.37 9.53 ± 2.78 0.888 9.72 ± 3.28 0.838 Homocysteine (nmol/mL)** 9.53 ± 3.92 9.23 ± 2.95 8.63 ± 1.79 0.217 9.16 ± 2.83 0.156 7.19 ± 2.16 7.50 ± 2.98 7.86 ± 2.29 0.142 7.56 ± 2.88 0.076 Energy intake (kcal/day) 1,938 ± 350 1,921 ± 381 1,908 ± 308 0.687 1,919 ± 371 0.413 1,553 ± 253 1,543 ± 251 1,530 ± 241 0.740 1,541 ± 249 0.494 Protein intake (g/day) 56.1 ± 11.2 55.5 ± 11.4 54.4 ± 10.1 0.407 55.3 ± 11.2 0.272 51.4 ± 10.2 51.5 ± 10.9 50.4 ± 11.3 0.748 51.3 ± 11.0 0.884 Fat intake (g/day) 41.8 ± 10.8 41.6 ± 9.94 42.3 ± 11.1 0.881 41.7 ± 10.1 0.891 44.3 ± 11.1 45.0 ± 12.1 45.9 ± 13.9 0.490 45.1 ± 12.4 0.290 Carbohydrate intake (g/day) 282.4 ± 69.7 274.8 ± 72.9 269.6 ± 57.6 0.152 274.1 ± 70.9 0.063 216.8 ± 44.8 216.7 ± 45.1 212.2 ± 48.6 0.728 216.0 ± 45.7 0.777 METs (h/day) 14.8 ± 13.7 14.5 ± 14.9 15.3 ± 12.3 0.899 14.6 ± 14.5 0.844 14.6 ± 13.2 15.3 ± 14.4 16.0 ± 13.9 0.596 15.5 ± 14.3 0.342
Table 3. The distribution of participants, according to sex, for rs1179086. Data are presented as
means ± standard deviation; BMI, body mass index; LDL-C, low-density lipoprotein cholesterol; HDL-C, high-density lipoprotein cholesterol; METs, metabolic equivalents. Genotype differences were analysed using one-way analysis of variance*, or the t-test**. *Men (TT = 412, TC = 294, CC = 45) Women (TT = 335,
suppressing cardiovascular disease. In the present study, we used the LDL-C/HDL-C ratio to evaluate cholesterol homeostasis because it is a better predictor of future cardiovascular disease than are single lipid parameters (e.g., triglyceride, LDL-C, or HDL-C levels)14. However, we did not find a correlation
between uric acid levels and cholesterol homeostasis for minor alleles in rs1165196 and rs3757131 (data not shown). These results suggest that the minor alleles in rs1165196 and rs3757131 had independent effects on uric acid levels and cholesterol homeostasis.
Various cardiovascular disease risk factors are reported to be related to homocysteine levels, includ-ing total cholesterol, other lipids, smokinclud-ing, and the presence or absence of hypertension and diabetes mellitus. However, adjusting for these risk factors only weakly attenuates the strong relationship between homocysteine levels and mortality due to cardiovascular causes5. In addition, homocysteine levels are
higher in patients with gout than in healthy controls, and uric acid levels are known to be correlated with homocysteine levels22. In contrast, hyperhomocysteinaemia is not correlated with uric acid levels
in patients with gout, although there is an inverse association between homocysteine levels and renal function26. These reports indicate that hyperhomocysteinaemia, which may be related to uric acid levels
and cardiovascular mortality, is clearly a cardiovascular risk factor, although the precise relationship remains unknown.
Interestingly, an association between hyperlipidaemia and hyperhomocysteinaemia has been sug-gested. In an animal model, hyperhomocysteinaemia inhibited reverse cholesterol transport by reducing circulating HDL levels, via inhibition of apoA-I protein synthesis, and enhanced HDL-C clearance27.
Therefore, the liver may be a major organ involved in regulating homocysteine and cholesterol homeo-stasis28. These studies suggest that the interactions between homocysteine and HDL metabolism may be
clinically important. Based on our findings, the rs1165196 and rs3757131 polymorphisms may be suit-able biomarkers for cardiovascular disease risk factors, although their direct effect(s) on the metabolic pathway remains unknown.
Sex Men Women
Genotype (N) CC (703) CT (264) TT (28) p* CT+ TT p ** (vs. CC) CC (610) CT (213) TT (24) p* CT+ TT p** (vs. CC) Age (years) 55.5 ± 8.8 55.4 ± 8.9 58.0 ± 7.9 0.342 55.7 ± 8.8 0.808 54.7 ± 8.7 54.9 ± 8.0 57.5 ± 7.7 0.293 55.1 ± 8.0 0.496 BMI (kg/m2) 23.7 ± 3.0 24.1 ± 3.2 23.6 ± 2.6 0.155 24.0 ± 3.1 0.073 22.9 ± 3.3 22.7 ± 3.2 23.3 ± 4.0 0.630 22.8 ± 3.3 0.570 Triglycerides (mg/dL) 120.6 ± 59.2 122.0 ± 65.6 111.9 ± 64.0 0.708 121.0 ± 65.4 0.932 93.1 ± 49.6 89.3 ± 47.3 94.1 ± 59.4 0.628 89.8 ± 48.5 0.394 Total cholesterol (mg/dL) 203.9 ± 31.4 204.6 ± 31.4 212.2 ± 32.8 0.391 205.3 ± 31.6 0.536 217.8 ± 35.1 213.8 ± 37.0 220.7 ± 27.7 0.310 214.5 ± 36.2 0.219 LDL-C (mg/dL) 121.0 ± 29.8 119.3 ± 29.3 122.7 ± 30.6 0.673 119.6 ± 29.4 0.501 129.9 ± 33.2 128.0 ± 35.9 131.1 ± 28.6 0.749 128.3 ± 35.2 0.530 HDL-C (mg/dL) 58.7 ± 15.4 60.8 ± 16.3 67.0 ± 14.2 0.007 61.4 ± 16.2 0.014 69.2 ± 15.4 67.8 ± 14.8 70.7 ± 12.7 0.449 68.1 ± 14.6 0.362 LDL-C/ HDL-C 2.20 ± 0.79 2.10 ± 0.76 1.94 ± 0.73 0.058 2.09 ± 0.76 0.032 2.00 ± 0.77 2.00 ± 0.80 1.93 ± 0.62 0.919 1.99 ± 0.79 0.962 Uric acid (mg/dL) 6.10 ± 1.15 5.86 ± 1.21 5.95 ± 1.42 0.015 5.87 ± 1.23 0.004 4.48 ± 1.00 4.29 ± 0.92 4.19 ± 1.19 0.029 4.28 ± 0.95 0.009 Folic acid (ng/mL) 8.43 ± 2.12 9.00 ± 2.52 9.72 ± 1.85 0.001 9.05 ± 2.48 < 0.001 9.70 ± 3.08 9.88 ± 3.74 9.71 ± 2.86 0.830 9.86 ± 3.65 0.572 Homocysteine (nmol/mL)** 9.67 ± 3.84 8.63 ± 2.29 8.60 ± 1.60 0.001 8.63 ± 2.25 < 0.001 7.38 ± 2.73 7.34 ± 1.92 7.18 ± 1.93 0.940 7.32 ± 1.91 0.803 Energy intake (kcal/day) 1,928 ± 355 1,934 ± 379 1,923 ± 294 0.973 1,933 ± 372 0.854 1,546 ± 247 1,550 ± 260 1,553 ± 267 0.979 1,550 ± 260 0.843 Protein intake (g/day) 56.0 ± 11.4 55.2 ± 11.0 55.0 ± 9.86 0.586 55.2 ± 10.9 0.303 51.3 ± 10.5 51.4 ± 10.4 50.5 ± 12.3 0.918 51.3 ± 10.6 0.957 Fat intake (g/day) 41.8 ± 10.8 41.6 ± 9.81 42.6 ± 8.92 0.891 41.7 ± 9.71 0.918 44.5 ± 11.7 45.0 ± 11.7 46.0 ± 11.6 0.720 45.1 ± 11.7 0.483 Carbohydrate intake (g/day) 279.2 ± 70.6 278.2 ± 70.8 268.1 ± 58.8 0.711 277.2 ± 69.7 0.683 216.1 ± 43.7 217.9 ± 47.9 212.3 ± 56.8 0.794 217.3 ± 48.8 0.718 METs (h/day) 14.9 ± 14.2 14.2 ± 14.1 13.1 ± 8.82 0.649 14.1 ± 13.6 0.396 14.9 ± 13.5 15.4 ± 14.4 12.8 ± 11.5 0.669 15.1 ± 14.1 0.840
Table 4. The distribution of the participants, according to sex, for rs3757131. Data are presented as
means ± standard deviation; BMI, body mass index; LDL-C, low-density lipoprotein cholesterol; HDL-C, high-density lipoprotein cholesterol; METs, metabolic equivalents. Genotype differences were analysed using one-way analysis of variance*, or the t-test**. *Men (TT = 530, TC = 204, CC = 17) Women (TT = 435,
Plasma homocysteine concentrations are typically considered to be inversely related to folic acid levels (a cofactor or substrate for enzymes involved in homocysteine metabolism). Similarly, a previous study reported that homocysteine levels in elderly Japanese individuals are inversely related to folic acid lev-els29. Furthermore, another study reported that folic acid supplementation lowered homocysteine levels,
although the change in lipid metabolism was not significant at the end of the treatment period28,30.
Nevertheless, the preventative effects of folic acid supplementation on cardiovascular disease cannot be excluded31. In the present study, high homocysteine and low folic acid levels were associated with the
major homozygous alleles in rs1165196 and rs3757131. However, adjusting for folic acid weakly attenu-ated the relationship between hyperhomocysteinaemia and the SLC17A1 polymorphisms. Nevertheless, the odds of hyperhomocysteinaemia were significantly different for rs1165196 and rs3757131, even after adjusting for folic acid levels. Therefore, SLC17A1 polymorphisms appear to independently affect low homocysteine levels.
To the best of our knowledge, the present study was the first to explore the association between rs1165196 and rs3757131 genotypes and cardiovascular risk factors, altered cholesterol homeostasis, and homocysteine levels in Japanese men. However, in women, statistically significant differences in cholesterol homeostasis and homocysteine levels were not identified. Similarly, pronounced sex-related
SNP/geno-type
Men Women
LDL-C/ HDL-C
ratio (N) OR 95% CI OR† 95% CI† OR‡ 95% CI‡
LDL-C/ HDL-C
ratio (N) OR 95% CI OR† 95% CI† OR‡ 95% CI‡
≤2.0 >2.0 ≤2.0 >2.0
rs1165196
TT 292 402 Reference Reference Reference 336 276 Reference Reference Reference
TC 136 135 0.721 0.544–0.956 0.653 0.486–0.878 0.649 0.481–0.877 124 87 0.854 0.622–1.173 0.844 0.594–1.198 0.846 0.595–1.204
CC 17 13 0.555 0.266–1.162 0.549 0.253–1.191 0.572 0.261–1.253 12 12 1.217 0.538–2.753 0.920 0.376–2.251 0.978 0.399–2.401
TC+CC 153 148 0.703 0.536–0.922 0.642 0.483–0.853 0.642 0.481–0.857 136 99 0.886 0.654–1.201 0.845 0.604–1.183 0.853 0.609–1.195
T 720 939 Reference Reference Reference 796 639 Reference Reference Reference
C 170 161 0.726 0.573–0.920 0.679 0.531–0.869 0.684 0.533–0.878 148 111 0.934 0.715–1.220 0.869 0.647–1.167 0.877 0.653–1.179
rs1179086
AA 234 308 Reference Reference Reference 256 211 Reference Reference Reference
AT 175 211 0.916 0.704–1.191 0.866 0.657–1.143 0.884 0.666–1.172 177 138 0.946 0.709–1.261 0.898 0.652–1.237 0.894 0.647–1.234
TT 36 31 0.654 0.393–1.089 0.671 0.391–1.152 0.689 0.399–1.190 39 26 0.809 0.477–1.372 0.677 0.375–1.222 0.668 0.369–1.209
AT+TT 211 242 0.871 0.678–1.120 0.828 0.636–1.078 0.686 0.646–1.106 216 164 0.921 0.701–1.210 0.861 0.635–1.167 0.860 0.633–1.169
A 643 827 Reference Reference Reference 689 560 Reference Reference Reference
T 247 273 0.859 0.703–1.050 0.835 0.677–1.029 0.849 0.686–1.050 255 190 0.917 0.737–1.141 0.855 0.671–1.090 0.857 0.672–1.093
rs3757131
CC 293 410 Reference Reference Reference 334 276 Reference Reference Reference
CT 136 128 0.673 0.506–0.894 0.614 0.456–0.828 0.614 0.453–0.832 125 88 0.852 0.621–1.168 0.842 0.594–1.194 0.845 0.595–1.201
TT 16 12 0.536 0.250–1.150 0.537 0.242–1.189 0.563 0.251–1.265 13 11 1.024 0.452–2.322 0.782 0.320–1.909 0.823 0.335–2.021
CT+TT 152 140 0.658 0.500–0.866 0.607 0.455–0.808 0.609 0.455–0.816 138 99 0.868 0.641–1.176 0.831 0.594–1.162 0.839 0.599–1.175
C 722 948 Reference Reference Reference 793 640 Reference Reference Reference
T 168 152 0.689 0.542–0.876 0.649 0.506–0.833 0.656 0.509–0.846 151 110 0.903 0.691–1.179 0.844 0.629–1.133 0.853 0.635–1.146
Table 5. Associations between the SLC17A1 gene variants and the LDL-C/HDL-C ratio. SNP, single
nucleotide polymorphism; LDL-C, low-density lipoprotein cholesterol; HDL-C, high-density lipoprotein cholesterol; OR, odds ratio; CI, confidence interval. †Adjusted for age, body mass index, research area,
alcohol consumption, smoking habits. ‡Adjusted for age, body mass index, research area, METs, daily energy
differences in the regulation of uric acid levels have been reported in both humans and animals32. In the
Framingham Heart Study, the association between uric acid levels and mortality risk in men was not significant in the univariate analysis, and the association in women was not significant after adjusting for diuretic use, blood pressure, and total cholesterol levels33. Therefore, the specific physiological
char-acteristics of women may be related to the sex-related differences in SNP genotypes that were observed to be associated with uric acid levels, although the underlying mechanism has yet to be elucidated. Furthermore, alcohol consumption, physical activity, and daily energy and nutrition intake did not affect the associations in either men or women. Therefore, identification of the pathogenic genetic factor(s) for cardiovascular disease remains critically important.
The limitations of our study include its cross-sectional design and the relatively small number of participants. Although a study with a low statistical power has a reduced likelihood of detecting a true effect, case-control studies with small sample sizes are still widely used, and can be used to assess pre-viously identified candidate regions and more precisely determine target selections. In addition, we only assessed Japanese participants in the present study, and further studies in other ethnic groups are needed to validate our findings. Therefore, large, prospective trials involving patients from multiple eth-nic groups are needed to better assess the effects of SLC17A1 polymorphisms on cholesterol homeostasis and hyperhomocysteinaemia. SNP/ genotype Men Women Homocysteine (N) OR 95% CI OR† 95% CI† OR‡ 95% CI‡ Homocysteine (N) OR 95% CI OR† 95% CI† OR‡ 95% CI‡ ≤10.0 >10.0 ≤10.0 >10.0 rs1165196
TT 336 166 Reference Reference Reference 387 44 Reference Reference Reference
TC 158 43 0.551 0.375– 0.810 0.505 0.340– 0.751 0.560 0.371– 0.844 141 15 0.936 0.505– 1.734 0.923 0.492– 1.731 0.942 0.498– 1.781
CC 13 3 0.467 0.131– 1.662 0.447 0.122– 1.634 0.542 0.143– 2.047 17 2 1.035 0.231– 4.628 0.792 0.169– 3.704 0.796 0.166– 3.814
TC+CC 171 46 0.544 0.374– 0.792 0.499 0.339– 0.734 0.560 0.375– 0.835 158 17 0.946 0.525– 1.706 0.910 0.498– 1.663 0.927 0.504– 1.707
T 830 375 Reference Reference Reference 915 103 Reference Reference Reference
C 184 49 0.589 0.420– 0.826 0.550 0.389– 0.777 0.609 0.426– 0.870 175 19 0.964 0.576– 1.615 0.910 0.537– 1.540 0.923 0.542– 1.572
rs1179086
AA 273 126 Reference Reference Reference 300 30 Reference Reference Reference
AT 202 79 0.847 0.606– 1.185 0.788 0.557– 1.113 0.854 0.595– 1.227 208 23 1.106 0.625– 1.958 1.028 0.571– 1.851 1.041 0.574– 1.888
TT 32 7 0.474 0.204– 1.103 0.431 0.181– 1.022 0.468 0.192– 1.137 37 8 2.162 0.923– 5.066 1.868 0.763– 4.574 1.883 0.751– 4.723
AT+TT 234 86 0.796 0.575– 1.102 0.733 0.524– 1.027 0.796 0.560– 1.131 245 31 1.265 0.745– 2.149 1.164 0.675– 2.007 1.175 0.677– 2.041
A 748 331 Reference Reference Reference 808 83 Reference Reference Reference
T 266 93 0.790 0.604– 1.034 0.743 0.564– 0.980 0.788 0.591– 1.050 282 39 1.346 0.899– 2.016 1.258 0.831– 1.904 1.264 0.830– 1.925
rs3757131
CC 338 169 Reference Reference Reference 383 44 Reference Reference Reference
CT 158 40 0.506 0.342– 0.750 0.466 0.311– 0.698 0.514 0.338– 0.781 145 15 0.900 0.486– 1.668 0.902 0.481– 1.691 0.926 0.490– 1.750
TT 11 3 0.545 0.150– 1.981 0.536 0.144– 1.997 0.665 0.171– 2.584 17 2 1.024 0.229– 4.580 0.763 0.163– 3.569 0.763 0.160– 3.467
CT+TT 169 43 0.509 0.347– 0.746 0.468 0.316– 0.694 0.523 0.348– 0.786 162 17 0.913 0.507– 1.646 0.890 0.487– 1.625 0.910 0.495– 1.674
C 834 378 Reference Reference Reference 911 103 Reference Reference Reference
T 180 46 0.564 0.399– 0.797 0.529 0.371– 0.754 0.585 0.406– 0.843 179 19 0.939 0.561– 1.571 0.893 0.528– 1.510 0.907 0.532– 1.544
Table 6. Associations between the SLC17A1 gene variants and hyperhomocysteinaemia. SNP, single
nucleotide polymorphism; OR, odds ratio; CI, confidence interval. †Adjusted for age, body mass index,
research area, alcohol consumption, smoking habits. ‡Adjusted for age, body mass index, research area, folic
Conclusion
In conclusion, our results indicate that the rs1165196 and rs3757131 polymorphisms, expressed in the liver, confer dominant negative effects on LDL-C/HDL-C ratios and hyperhomocysteinaemia in Japanese men. Although the exact biological mechanism for this association remains unknown, our findings provide credible evidence that the rs1165196 and rs3757131 polymorphisms may be associated with a decreased risk of cardiovascular disease. This risk reduction may be due to their important role in main-taining cholesterol homeostasis and preventing hyperhomocysteinaemia through altered liver function. However, further studies are needed to interpret the effects of SLC17A1 polymorphisms on cardiovas-cular disease.
Methods
Study participants. In the present study, we evaluated participant data collected during the Japan Multi-Institutional Collaborative Cohort (J-MICC) Study. That cohort study evaluated the general Japanese population in 10 research areas, using genetic and clinical data to detect and confirm gene-en-vironment interactions related to lifestyle-associated diseases34. The study participants were 35–69 years
old, and were enrolled after responding to study announcements in their specific research areas, attend-ing health check-up examinations that were commissioned by their local governments, visitattend-ing local health check-up centres, or visiting a cancer hospital. A total of 4490 participants were selected, with approximately 500–600 participants from each research area, except for two areas in which fewer par-ticipants were recruited35.
Among these 4490 participants, 2035 were excluded because they had consumed a meal < 6 h before having their blood drawn, 228 because they were receiving cholesterol-lowering medication, 24 due to high triglyceride levels (≥ 400 mg/dL), 338 due to insufficient laboratory data, and 23 individuals were excluded due to the absence of other data. After these exclusions, 1842 individuals (995 men and 847 women) were eligible for analyses. Folic acid (751 men and 620 women) and homocysteine (719 men and 606 women) levels limited the number of participants.
All participants provided written informed consent for the J-MICC Study, and the main study pro-tocol of the J-MICC Study was approved by Ethics Committee at Nagoya University School of Medicine (Approval number 253 and 939). Since actual studies are slightly different from the main J-MICC Study protocol, all procedures involved in this study were performed in accordance with the institutional ethi-cal committees (Chiba Cancer Center, Nagoya University, Nagoya City University, Aichi Cancer Center, Shiga University of Medical Science, Kyoto Prefectural University of Medicine, Tokushima University, Kyushu University, Saga University, and Kagoshima University).
Blood biochemistry, lifestyle, and nutritional data. In the present study, we evaluated lifestyle and medical information obtained through self-administered questionnaires (alcohol consumption sta-tus [0, 0.1–22.9, 23.0–45.9, or ≥ 46.0 g ethanol/day], smoking habits, current medications, and exercise). In addition, blood chemistry data (serum levels of triglycerides, total cholesterol, HDL-C, uric acid, LDL-C [calculated using the Friedewald formula36, and plasma levels of homocysteine and folic acid) and
anthropometric data were obtained from health check-ups performed in the research areas. Each blood sample was centrifuged and the plasma was separated and stored at –80 °C until analysis. Serum samples were measured by laboratories in each research area. Plasma folic acid concentrations were measured using a chemiluminescent enzyme immunoassay, and plasma homocysteine concentrations were meas-ured using high-performance liquid chromatography by a contract laboratory (SRL, Tokyo, Japan).
For the dietary assessment, a validated food-frequency questionnaire was used to evaluate the intake frequency of 47 foods and beverages over the preceding year, and the total daily energy (kcal), protein (g), fat (g), and carbohydrate (g) intakes were calculated37–40. Physical activity was assessed as METs for
daily and leisure activities, as previously reported41. In brief, METs-hours per day (METs·h/day) of daily
activity were estimated for heavy physical work and walking. For leisure activities, METs·h/day were estimated by multiplying the reported daily time spent in each activity by the relevant MET intensity.
Genotyping SLC17A1 polymorphisms. Our previous study described the details of the genetic analysis35. Briefly, genomic DNA was extracted from the buffy coat fraction of the participant’s blood
sample, using a BioRobot M48 Workstation (QIAGEN Group, Tokyo, Japan). The SLC17A1 polymor-phisms (rs1165196, rs1179086, and rs3757131) were genotyped using a multiplex polymerase chain reaction-based Invader assay (Third Wave Technologies, Madison, WI, USA) at the RIKEN Laboratory for Genotyping Development, Center for Genomic Medicine (Yokohama, Japan)42. The rs1165196
pol-ymorphism is located at exon 7, where a conversion from thymine to cytosine at nucleotide 806 results in the substitution of threonine for isoleucine. The rs1179086 and rs3757131 polymorphisms are located at intron 1218.
Statistical analyses. Inter-group comparisons were performed using Student’s unpaired t-tests for continuous variables and chi-square tests for categorical variables (alcohol consumption in current drinkers, smokers, and allele independence [Hardy-Weinberg equilibrium]). Differences in quantitative
data, between the genotypes, were evaluated using one-way analysis of variance. All data were expressed as means ± standard deviation, or as indicated, and the coefficients of variation (CVs) for each param-eter were calculated. ORs, 95% CIs, and p-values were calculated using logistic regression analyses; the LDL-C/HDL-C ratio (> 2.0) was defined as the dependent variable, and participant age, sex, BMI (kg/ m2), research area, METs, daily energy and nutritional intake (protein, fat, and carbohydrate), and alcohol
consumption and smoking habits, were included as independent variables. In the general Japanese popu-lation, a plasma homocysteine concentration of > 10.0 nmol/mL is defined as hyperhomocysteinaemia29,
and this cut-off value was used for our analyses. We performed logistic regression analyses with the homocysteine level defined as the dependent variable, and patient age, sex, BMI, research area, folic acid level, and alcohol consumption and smoking habits were included as independent variables. All statistical tests were two-sided, and differences with a p-value of < 0.05 were considered statistically significant. SPSS software (version 18.0, SPSS, Japan, Inc.) was used for all statistical analyses.
References
1. World Health Organization. Prevention of cardiovascular disease: guidelines for assessment and management of total cardiovascular
risk. (2007). Available at: http://www.who.int/cardiovascular_diseases/guidelines/Full text.pdf. (Accessed: 21st April 2015).
2. Jin, M. et al. Uric acid, hyperuricemia and vascular diseases. Front. Biosci. (Landmark Ed). 17, 656–669 (2012).
3. Grassi, D. et al. Chronic hyperuricemia, uric acid deposit and cardiovascular risk. Curr. Pharm. Des. 19, 2432–2438 (2013). 4. Kim, S. Y. et al. Hyperuricemia and risk of stroke: a systematic review and meta-analysis. Arthritis Rheum. 61, 885–892 (2009). 5. Nygard, O. et al. Plasma homocysteine levels and mortality in patients with coronary artery disease. N. Engl. J. Med. 337, 230–236
(1997).
6. Okura, T. et al. Hyperhomocysteinemia is one of the risk factors associated with cerebrovascular stiffness in hypertensive patients, especially elderly males. Sci. Rep. 4, 5663 (2014).
7. Micle, O., Muresan, M., Antal, L., Bodog, F. & Bodog, A. The influence of homocysteine and oxidative stress on pregnancy outcome. J. Med. Life. 5, 68–73 (2012).
8. Arsenault, B. J., Boekholdt, S. M. & Kastelein, J. J. Lipid parameters for measuring risk of cardiovascular disease. Nat. Rev.
Cardiol. 8, 197–206 (2011).
9. Maxfield, F. R. & Tabas, I. Role of cholesterol and lipid organization in disease. Nature. 438, 612–621 (2005).
10. Expert Panel on Detection, Evaluation, and Treatment of High Blood Cholesterol in Adults. Executive summary of the third report of the National Cholesterol Education Program (NCEP) Expert Panel on Detection, Evaluation, and Treatment of High Blood Cholesterol in Adults (Adult Treatment Panel III). JAMA. 285, 2486–2497 (2001).
11. Stone, N. J. et al. 2013 ACC/AHA guideline on the treatment of blood cholesterol to reduce atherosclerotic cardiovascular risk in adults: a report of the American College of Cardiology/American Heart Association Task Force on Practice Guidelines.
Circulation. 129 (suppl 2), S1–S45 (2014).
12. Goff, D. C., Jr. et al. 2013 ACC/AHA guideline on the assessment of cardiovascular risk: a report of the American College of Cardiology/American Heart Association Task Force on Practice Guidelines. Circulation. 129 (Suppl 2), S49–S73 (2014). 13. Kannel, W. B. Lipids, diabetes, and coronary heart disease: insights from the Framingham Study. Am. Heart J. 110, 1100–1107
(1985).
14. Ingelsson, E. et al. Clinical utility of different lipid measures for prediction of coronary heart disease in men and women. JAMA. 298, 776–785 (2007).
15. Lee, Y. H. & Song, G. G. Pathway analysis of genome-wide association studies on uric acid concentrations. Hum. Immunol. 73, 805–810 (2012).
16. Reimer, R. J. SLC17: a functionally diverse family of organic anion transporters. Mol. Aspects Med. 34, 350–359 (2013). 17. Busch, A. E. et al. Expression of a renal type I sodium/phosphate transporter (NaPi-1) induces a conductance in Xenopus oocytes
permeable for organic and inorganic anions. Proc. Natl. Acad. Sci. USA. 93, 5347–5351 (1996).
18. Urano, W. et al. Sodium-dependent phosphate cotransporter type 1 sequence polymorphisms in male patients with gout. Ann.
Rheum. Dis. 69, 1232–1234 (2010).
19. Roddy, E., Mallen, C. D., Hider, S. L. & Jordan, K. P. Prescription and comorbidity screening following consultation for acute gout in primary care. Rheumatology (Oxford). 49, 105–111 (2010).
20. Kolz, M. et al. Meta-analysis of 28,141 individuals identifies common variants within five new loci that influence uric acid concentrations. PLoS Genet. 5, e1000504 (2009).
21. Yang, Q. et al. Multiple genetic loci influence serum urate levels and their relationship with gout and cardiovascular disease risk factors. Circ. Cardiovasc. Genet. 3, 523–530 (2010).
22. Ioachimescu, A. G., Brennan, D. M., Hoar, B. M., Hazen, S. L. & Hoogwerf, B. J. Serum uric acid is an independent predictor of all-cause mortality in patients at high risk of cardiovascular disease: a preventive cardiology information system (PreCIS) database cohort study. Arthritis Rheum. 58, 623–630 (2008).
23. Ridker, P. M. LDL cholesterol: controversies and future therapeutic directions. Lancet. 384, 607–617 (2014).
24. LaRosa, J. C. et al. Intensive lipid lowering with atorvastatin in patients with stable coronary disease. N. Engl. J. Med. 352, 1425–1435 (2005).
25. Nicholls, S. J. et al. Statins, high-density lipoprotein cholesterol, and regression of coronary atherosclerosis. JAMA. 297, 499–508 (2007).
26. Choi, S. T., Kim, J. S. & Song, J. S. Elevated serum homocysteine levels were not correlated with serum uric acid levels, but with decreased renal function in gouty patients. J. Korean Med. Sci. 29, 788–792 (2014).
27. Liao, D. et al. Hyperhomocysteinemia decreases circulating high-density lipoprotein by inhibiting apolipoprotein A-I Protein synthesis and enhancing HDL cholesterol clearance. Circ. Res. 99, 598–606 (2006).
28. Obeid, R. & Herrmann, W. Homocysteine and lipids: S-adenosyl methionine as a key intermediate. FEBS. Lett. 583, 1215–1225 (2009).
29. Kario, K. et al. High plasma homocyst(e)ine levels in elderly Japanese patients are associated with increased cardiovascular disease risk independently from markers of coagulation activation and endothelial cell damage. Atherosclerosis. 157, 441–449 (2001).
30. Olthof, M. R., van Vliet, T., Verhoef, P., Zock, P. L. & Katan, M. B. Effect of homocysteine-lowering nutrients on blood lipids: results from four randomised, placebo-controlled studies in healthy humans. PLoS Med. 2, e135 (2005).
31. Lonn, E. et al. Homocysteine lowering with folic acid and B vitamins in vascular disease. N. Engl. J. Med. 354, 1567–1577 (2006). 32. Taniguchi, A. & Kamatani, N. Control of renal uric acid excretion and gout. Curr. Opin. Rheumatol. 20, 192–197 (2008).
33. Culleton, B. F., Larson, M. G., Kannel, W. B. & Levy, D. Serum uric acid and risk for cardiovascular disease and death: the Framingham Heart Study. Ann. Intern. Med. 131, 7–13 (1999).
34. Hamajima, N. The Japan Multi-Institutional Collaborative Cohort Study (J-MICC Study) to detect gene-environment interactions for cancer. Asian Pac. J. Cancer Prev. 8, 317–323 (2007).
35. Wakai, K. et al. Profile of participants and genotype distributions of 108 polymorphisms in a cross-sectional study of associations of genotypes with lifestyle and clinical factors: a project in the Japan Multi-Institutional Collaborative Cohort (J-MICC) Study.
J. Epidemiol. 21, 223–235 (2011).
36. Friedewald, W. T., Levy, R. I. & Fredrickson, D. S. Estimation of the concentration of low-density lipoprotein cholesterol in plasma, without use of the preparative ultracentrifuge. Clin. Chem. 18, 499–502 (1972).
37. Imaeda, N. et al. Reproducibility of a short food frequency questionnaire for Japanese general population. J. Epidemiol. 17, 100–107 (2007).
38. Tokudome, Y. et al. Relative validity of a short food frequency questionnaire for assessing nutrient intake versus three-day weighed diet records in middle-aged Japanese. J. Epidemiol. 15, 135–145 (2005).
39. Tokudome, S. et al. Development of a data-based short food frequency questionnaire for assessing nutrient intake by middle-aged Japanese. Asian Pac. J. Cancer Prev. 5, 40–43 (2004).
40. Goto, C. et al. Validation study of fatty acid consumption assessed with a short food frequency questionnaire against plasma concentration in middle-aged Japanese people. Scand. J. Nutr. 50, 77–82 (2006).
41. Hara, M. et al. Effect of the PPARG2 Pro12Ala polymorphism and clinical risk factors for diabetes mellitus on HbA1c in the Japanese general population. J. Epidemiol. 22, 523–531 (2012).
42. Ohnishi, Y. et al. A high-throughput SNP typing system for genome-wide association studies. J. Hum. Genet. 46, 471–477 (2001).
Acknowledgements
The authors thank Kyota Ashikawa, Tomomi Aoi, and the other members of the Laboratory for Genotyping Development, RIKEN Center for Genomic Medicine, for their support with the genotyping, as well as Yoko Mitsuda, Keiko Shibata, and Etsuko Kimura of the Department of Preventive Medicine, Nagoya University Graduate School of Medicine for their technical assistance. The authors also thank Shinkan Tokudome of the National Institute of Health and Nutrition (formerly Nagoya City University), Chiho Goto of Nagoya Bunri University, Nahomi Imaeda of Nagoya Women’s University, Yuko Tokudome of Nagoya University of Arts and Sciences, Masato Ikeda of the University of Occupational and Environmental Health, and Shinzo Maki of the Aichi Prefectural Dietetic Association for providing the food frequency questionnaire and a program to calculate the participants’ nutritional intake. This study was supported by Grants-in-Aid for Scientific Research on Priority Areas (No. 17015018) and Innovative Areas (No. 221S0001) from the Japanese Ministry of Education, Culture, Sports, Science, and Technology. The funding sources played no role in the study design; the collection, analysis and interpretation of data; the writing of this report; or the decision to submit this manuscript for publication.
Author Contributions
T.K. analysed the data and wrote the main manuscript text. N.H., H.T., K.W., K.T., K.A., H.M. and S.S. designed the study. I.O. provided critical comments on the manuscript. R.O., K.S., A.H., N.T., C.N., D.M., E.O. and N.K. contributed to data collection, and M.K. performed the genotyping. All authors contributed to and have approved the final manuscript.
Additional Information
Competing financial interests: The authors declare no competing financial interests.
How to cite this article: Koyama, T. et al. Genetic variants of SLC17A1 are associated with cholesterol
homeostasis and hyperhomocysteinaemia in Japanese men. Sci. Rep. 5, 15888; doi: 10.1038/srep15888 (2015).
This work is licensed under a Creative Commons Attribution 4.0 International License. The images or other third party material in this article are included in the article’s Creative Com-mons license, unless indicated otherwise in the credit line; if the material is not included under the Creative Commons license, users will need to obtain permission from the license holder to reproduce the material. To view a copy of this license, visit http://creativecommons.org/licenses/by/4.0/