Analysis of Water Quality and Purification Process
Improvement for Urban Water Supply in North-Eastern
China
中国東北地区の都市における水供給のための
水質分析と浄化プロセスの改善に関する研究
北九州市立大学国際環境工学研究科
2020 年 12 月
王 晓东
Xiaodong WANG
Analysis of Water Quality and Purification Process
Improvement for Urban Water Supply in North-Eastern
China
December 2020
Xiaodong WANG
The University of Kitakyushu
Faculty of Environmental Engineering
Department of Architecture
Gao Laboratory
Preface
This thesis research was performed at the Department of Architecture, the University of Kitakyushu. This thesis presents a comparison of water quality between the Mopanshan Reservoir and Songhuajiang River. This study has investigated the pollution source analysis and comparison of the finished water quality of the Mopanshan Reservoir and Songhuajiang River. Meanwhile, a pilot study on the enhanced conventional process and the advanced treatment in a waterwork of Harbin are proposed in this research.
Acknowledgements
This work could not have been completed without the support, guidance, and help of many people. I am very grateful for their assistance in data, insights and encouragement and they are deserve to be mentioned.
First of all, I would like to extend my sincere gratitude to my supervisor, Prof. Weijun Gao, for his support in many ways over the years and for giving me the opportunity to study at the University of Kitakyushu. He has exquisite academic skills and rigorous work style, and friendly and amiable. He helped and guided me in all my research and office work.
Also, I would like to thank Prof. Xindong Wei of Jilin Jianzhu University who given me many valuable advice, guidance, and support during this work.
Special thanks to Prof. Chongwei, Cui of Harbin Institute of Technology for the guidance in water environment evaluation.
I would also like to thank all university colleagues, Dr. Jinming JIANG, Dr. Rui WANG, Ms. Tingting CAO who given me the guidance and research supports; and Ms. Xue FANG, Ms. Nan XIANG, Mr. Jiahao ZHANG, Mr. Yuang GUO etc., who given me their time in fulfilling my life along these years in Japan and helping me carry out my problems during the difficult course of the thesis, I would also like to express my gratitude.
Finally, I would like to express my deepest thanks to my families for their loving considerations and great confidence in me that made me possible to finish this study.
Improvement for Urban Water Supply in North-Eastern
China
Abstract
With the continuous development of urbanization, the problem of urban water supply security in China is becoming more and more serious, even seriously affecting people's normal life. Urban water supply is an important part of urban infrastructure. It is not only the basis of urban formation, but also the basic condition to ensure the stability, development and prosperity of the city, and is inseparable from the various elements of urban economic development. Therefore, it is necessary to analyze the water quality and the distribution of pollutant sources in the water sources around the city, and put forward an effective scheme to meet the local urban development and ensure the safety of water supply. Harbin is an important city in northeast of China. Since the occurrence of the nitrobenzene pollution incident in Songhuajiang River in 2005, the water supply in its main urban area has been limited. With the development of urban economy and the continuous expansion of people's demand, the single and long-distance water supply source can not meet the urban planning requirements of Harbin. Therefore, in order to ensure the city's economic development and water supply safety, the water quality of Mopanshan Reservoir and Songhuajiang River, which are two kinds of water sources around Harbin, are analyzed comprehensively and the pollution sources are also analyzed. It is an important content of urban planning to put forward a solution.
In this paper, we compared and analyzed the water quality of Mopanshan Reservoir water and Songhuajiang River water from 2016 to 2018 based on the “Environmental Quality Standards for Surface Water” (GB3838-2002) and “Standards for drinking water quality” (GB5749-2006), so as to comprehensively understand the water quality of the two water sources in Harbin in recent years. At the same time, the characteristic pollutants of the two water sources were determined, and the distribution of the pollution sources was analyzed. The quality of the effluent after the treatment of the conventional water purification process (coagulation sedimentation filtration disinfection) of the two water sources was compared, so as to provide the basis for the subsequent response plan. In addition, based on the conventional water purification process, the operation parameters of enhanced conventional process (enhanced coagulation and enhanced filtration) and advanced water purification process mainly based on ozone-biological activated carbon (O3-BAC) were studied
And based on the characteristics of water quality pollution, a suitable water purification process method was proposed. Meanwhile, the water quality of joint water supply of two water sources was also preliminarily studied. This paper proposes an emergency plan for the emergency situation of water use in Harbin. In addition, we also made a preliminary engineering economic analysis on the proposed deep water purification process based on the O3-BAC process.
The thesis consists of eight chapters and the summary of each chapter is shown as follows.
In the chapter 1, background, previous research, purposes, and configuration of the thesis are described.
In the chapter 2, the involved theories, material, research method, and process overview are presented.
In the chapter 3, we compared the water quality between the Mopanshan Reservoir and Songhuajiang River and applied WQI method to evaluate the water quality of the two drinking water sources.
In the chapter 4, the characteristic pollutants and pollution sources of the two drinking water sources are analyzed. Meanwhile, the finished water quality of the two drinking water sources are also carried out.
In the chapter 5, the enhanced conventional process in a waterworks of Harbin was researched. In the chapter 6, we studied the advanced treatment in a waterworks of Harbin and analyzed the operating parameter of each treatment unit.
In the chapter 7, the engineering economic of the O3/BAC process was analyzed.
In the chapter 8, the results of the thesis are summarized.
Keywords: Drinking water source, Water quality, Harbin City, Water supply security,
Preface
Acknowledgements Abstract
Chapter 1. Introduction...1-1
1.1 Background...1-1
1.1.1 Water supply and water demand...1-1 1.1.2 Current situation of water supply...1-2
1.2 Research status of water supply safety at home and abroad...1-4 1.3 Research status of water purification technology at home and abroad...1-5
1.3.1 Enhanced coagulation...1-6 1.3.2 Enhanced filtration...1-7 1.3.3 Preoxidation...1-8 1.3.4 Ozone-activated carbon advanced treatment process...1-10 1.3.5 Biological Activated Carbon...1-11 1.3.6 Photochemical oxidation...1-12 1.3.7 Membrane treatment...1-14 1.3.8 Comprehensive assessment...,...1-15
1.4 Research on the application of O3/BAC process at home and abroad...1-16 1.4.1 Meilin waterworks in Shenzhen...1-16 1.4.2 Bijiashan waterworks in Shenzhen...1-17 1.4.3 Nanzhou waterworks in Guangzhou...1-17 1.4.4 Yangshupu waterworks in Shanghai...1-18 1.4.5 Shijiu waterworks in Jiaxing...1-18 1.4.6 Deep purification water plant of Qianguo Refinery in Jilin Province...1-19
1.5 Drinking water treatment process...1-20
1.5.1 Conventional treatment process...1-20 1.5.2 Ozone-activated carbon advanced treatment process...1-22
1.6 Review of water quality assessment method...1-23 1.7 Current Situation of water supply in Harbin...1-25
1.9 Organization of Thesis...1-26
1.9.1 Chapter 1. Introduction...1-26 1.9.2 Chapter 2. Theory of urban safe water supply and Water purification renovation method....1-27 1.9.3 Chapter 3. Comparison of water quality between the Mopanshan Reservoir and Songhuajiang River...1-27 1.9.4 Chapter 4. Pollution source analysis and comparison of the finished water quality of the Mopanshan Reservoir and Songhuajiang River ...1-27 1.9.5 Chapter 5. Pilot study on the enhanced conventional process in a waterworks of Harbin...1-27 1.9.6 Chapter 6. Pilot study on the advanced treatment in a waterworks of Harbin...1-27 1.9.7 Chapter 7. Engineering economic analysis...1-27 1.9.8 Chapter 8. Conclusions...1-27
Reference...1-29
Chapter 2. Theory of urban safe water supply and water purification renovation method...2-1
2.1 Theoretical analysis of urban water supply safety...2-1
2.1.1 Policy of the urban water supply safety at home and abroad...2-1 2.1.2 Drinking water quality standards at home and abroad...2-3
2.2 Study area...2-5
2.2.1 Mopanshan Reservoir...2-5 2.2.2 Songhuajiang River...2-6
2.3 Waterworks profiles of Harbin...2-6
2.3.1 Profiles of the conventional process...2-6 2.3.2 Profiles of the advanced treatment process...2-6
2.4 Methods of monitoring water quality...2-7
2.4.1 Experimental reagents and equipment...2-7 2.4.2 Sampling method of drinking water source and water treatment plant...2-9 2.4.3 Conventional water quality index detection methods...2-9 2.4.4 Unconventional water quality index detection methods...2-10 2.4.5 Water Quality Indicator (WQI) analysis...2-11 2.4.6 Eutrophication analysis...2-11 2.4.7 Export coefficient model...2-13 2.4.8 Determination of velocity gradient...2-14 2.4.9 Orthogonal experiment...2-14
Reference...2-17
Chapter 3. Comparison of water quality between the Mopanshan Reservoir and Songhuajiang River...3-1
3.1 Introduction...3-1 3.2 Comparative analysis of the water body classification...3-1
3.2.1 Water body classification of the Mopanshan Reservoir...3-2 3.2.2 Water body classification of the Songhuajiang River...3-2
3.3 Comparative water quality analysis of raw water...3-3
3.3.1 Sensory traits and physical indicators...3-3 3.3.2 Inorganic non-metallic index...3-6 3.3.3 Metal index, selenium and arsenic...3-9 3.3.4 Comprehensive organic contaminant index...3-11 3.3.5 Biological index...3-13 3.3.6 Assessment of the Water Quality Indicator (WQI)...3-15
3.4 Summary...3-16 Reference...3-17
Chapter 4. Pollution source analysis and comparison of the finished water quality of the Mopanshan Reservoir and Songhuajiang River...4-1
4.1 Introduction...4-1 4.2 Comparison analysis of the characteristic pollutants...4-1
4.2.1 Analysis of characteristic pollutants of the Mopanshan Reservoir...4-1 4.2.2 Analysis of characteristic pollutants of the Songhuajiang River...4-3
4.3 Comparative study on the distribution of pollution sources...4-5
4.3.1 Pollution source analysis of the Mopanshan reservoir...4-5 4.3.2 Pollution sources analysis of the Songhuajiang River...4-16
4.4 Finished water quality...4-24
4.4.1 Finished water quality in the Mopanshan Reservoir...4-24 4.4.2 Finished water quality in the Songhuajiang River...4-25
Chapter 5. Pilot study on the enhanced conventional process in a waterworks of Harbin...5-1
5.1 Introduction...5-1 5.2 Raw water and effluent water quality of the waterworks...5-2 5.3 Enhanced coagulation test...5-3
5.3.1 Orthogonal experiment design for the flocculation process...5-3 5.3.2 Choice of coagulant...5-5 5.3.3 Determination of the optimum coagulant dose...5-6 5.3.4 Property comparison of the inclined-tube sedimentation tank...5-6
5.4 Enhanced filtration test...5-7
5.4.1 Load-reduction operation test...5-7 5.4.2 Determination of the backwash cycle...5-9 5.4.3 Determination of washing intensity...5-10
5.5 Summary...5-10 Reference...5-12
Chapter 6. Pilot study on the advanced treatment in a waterworks of Harbin...6-1
6.1 Introduction...6-1 6.2 Pilot study of the O3/BAC process...6-1 6.2.1 Determination test of ozone dosage...6-1 6.2.2 Influence of pre-ozonation process on conventional treatment...6-2 6.2.3 Influence of main ozone process on carbon filter...6-4 6.2.4 Removal efficiency of UV254, THMFP and TOC...6-5
6.3 Pilot study of the BAC process...6-9
6.3.1 Activated carbon selection test...6-9 6.3.2 Operation test of the activated carbon filter...6-10
6.4 Liquid chlorine disinfection...6-13 6.5 Stable operation of the O3/BAC process and biological stability...6-18 6.5.1 Stable operation of the O3/BAC process...6-18
6.5.2 Biostability analysis...6-21
6.6.2 Unconventional water quality test index...6-23
6.7 Water quality of the combined water supply...6-23
6.7.1 Water quality of the urban water supply network...6-24 6.7.2 Study on the chemical stability of pipe network...6-26
6.8 Summary...6-27 Reference...6-29
Chapter 7. Engineering economic analysis...7-1
7.1 Introduction...7-1 7.2 Introduction to the transformation of advanced treatment process...7-1
7.2.1 Pre-ozonation contact tank...7-1 7.2.2 Intermediate lifting pump station...7-1 7.2.3 Main ozonation contact tank...7-1 7.2.4 Ozone generator...7-1 7.2.5 Biological activated carbon filter...7-2
7.3 Environmental and social benefit analysis...7-2 7.4 Total project cost...7-3 7.5 Operating cost estimation of the advanced processing...7-3
7.5.1 Conditions and basic data for the financial evaluation...7-3 7.5.2 Estimate of the total cost...7-5
7.6 Summary...7-6 Reference...7-7
CONTENTS OF FIGURES
Fig. 1-1 Total water supply and water consumption of China. (a) Total water supply (b) Water consumption...1-2 Fig. 1-2 Conventional process flow chart...1-22 Fig. 1-3 O3/BAC advanced treatment process flow chart...1-23
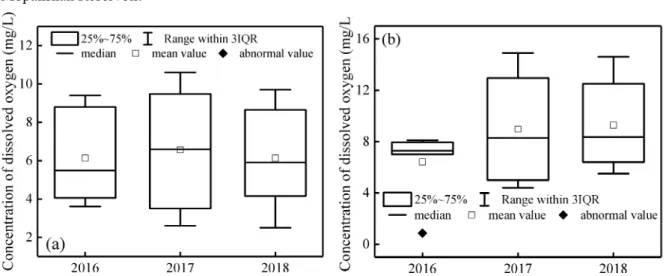
Fig. 1-4 The structural of the thesis...1-28 Fig. 2-1 Location map of Mopanshan Reservoir...2-6 Fig. 2-2 Location map of Songhuajiang River...2-6 Fig. 2-3 Advanced treatment process flow chart...2-7 Fig. 3-1 Variation of chroma and turbidity in the Mopanshan Reservoir and Songhuajiang River. (a) chroma, (b) turbidity...3-4 Fig. 3-2 Variation of pH in the Mopanshan Reservoir and Songhuajiang River. (a) Mopanshan Reservoir, (b) Songhuajiang River...3-5 Fig. 3-3 Variation of total hardness in the Mopanshan Reservoir and Songhuajiang River. (a) Mopanshan Reservoir, (b) Songhuajiang River...3-5 Fig. 3-4 Variation of dissolved oxygen in the Mopanshan Reservoir and Songhuajiang River. (a) Mopanshan Reservoir, (b) Songhuajiang River...3-6 Fig. 3-5 Variation of NH3-N in the Mopanshan Reservoir and Songhuajiang River. (a) Mopanshan
Reservoir, (b) Songhuajiang River...3-7 Fig. 3-6 Variation of TP in the Mopanshan Reservoir and Songhuajiang River. (a) Mopanshan Reservoir, (b) Songhuajiang River...3-8 Fig. 3-7 Variation of CODMnand CODCrin the Mopanshan Reservoir and Songhuajiang River. (a)
CODMn in the Mopanshan Reservoir, (b) CODCr in the Mopanshan Reservoir, (c) CODMn in the
Songhuajiang River, (d) CODCr in the Songhuajiang
River...3-12 Fig. 3-8 The variation trend and regression of CODCr with CODMn in the Mopanshan
Reservoir...3-12 Fig. 3-9 The variation trend and regression of CODCr with CODMn in the Songhuajiang
River...3-12 Fig. 3-10 Variation of BOD5in the Mopanshan Reservoir and Songhuajiang River. (a) Mopanshan
Reservoir, (b) Songhuajiang River...3-13 Fig. 4-1 Variation of CODMn, TN and TP in the Mopanshan Reservoir from 2016 to 2018. a) CODMn,
Fig. 4-2 Variation of CODMn and NH4+-N in the Songhuajiang River. a) CODMn, b)
NH4+-N...4-4
Fig. 4-3 Variation of CODCrin the Songhuajiang river...4-5
Fig. 4-4 Comparison diagram of the TSIM and TLI...4-8 Fig. 4-5 Diagram of water and pollutant balance of the Mopanshan Reservoir...4-9 Fig. 4-6 COD variation at the outlet of the Mopanshan Reservoir... 4-13 Fig. 4-7 Simulated calculation of organic matter. (a) input, (b) output...4-13 Fig. 4-8 Balance of suspended sediment and organic material in different seasons...4-14 Fig. 4-9 Distribution proportion of the bottom sludge...4-15 Fig. 4-10 Distribution density of the bottom sludge...4-15 Fig. 4-11 Variation of NH4+-N and CODMn at the Jilin monitoring section. (a) NH4+-N, (b)
CODMn...4-21
Fig. 4-12 Variation of NH4+-N and CODMn at the Songyuan monitoring section. (a) NH4+-N, (b)
CODMn...4-21
Fig. 4-13 Variation of NH4+-N and CODMn at the Qiqihaer monitoring section. (a) NH4+-N, (b)
CODMn...4-22
Fig. 4-14 Variation of NH4+-N and CODMn at the Zhaoyuan monitoring section. (a) NH4+-N, (b)
CODMn...4-22
Fig. 5-1 Variation of turbidity, CODMnand NH3-N in the raw water and effluent...5-3
Fig. 5-2 Effects of the different coagulants on the removal of chroma and turbidity...5-5 Fig. 5-3 The relationship between coagulant dosage and turbidity and chroma removal rate...5-6 Fig. 5-4 Influence of different inlet flows on turbidity, chroma, CODMn and NH4+-N removal
rate...5-9 Fig. 5-5 Influence of different inlet flows on the backwash cycle...5-9 Fig. 5-6 Effect of sand filtration washing intensity on the removal rate of effluent turbidity...5-10 Fig. 6-1 Effect of ozone dosage on CODMnand NH4+-N removal...6-2
Fig. 6-2 Variation of effluent UV254in each process...6-6
Fig. 6-3 The variation of THMFP in each treatment units...6-6 Fig. 6-4 The variation of TOC in each treatment units...6-7 Fig. 6-5 Relationship between backwash intensity and average turbidity removal rate...6-10 Fig. 6-6 Relationship between backwash intensity and CODMnand NH4+-N...6-11
Fig. 6-8 Relationship between backwash intensity and filter material swelling capacity...6-12 Fig. 6-9 Relationship between dosage of chlorine and residual chlorine, NH4+-N, and
UV254...6-14
Fig. 6-10 Breakpoint chloranation...6-16 Fig. 6-11 Relationship between dosage of chlorine and NH4+-N of the effluent...6-16
Fig. 6-12 Variation of chlorine with the change of contact time...6-18 Fig. 6-13 Turbidity variation during stable operation...6-19 Fig. 6-14 Chroma variation during stable operation...6-19 Fig. 6-15 CODMnvariation during stable operation...6-20
Fig. 6-16 NH4+-N variation during stable operation...6-21
CONTENTS OF TABLES
Table 2-1 The drinking water quality standards in China with the international three standards...2-3 Table 2-2 Comparison of indicators in the drinking water quality standards in China with the international three standards...2-5 Table 2-3 List of main reagents...2-8 Table 2-4 List of main equipment...2-8 Table 2-5 Main water quality index detection methods...2-9 Table 2-6 The scoring criteria of the WQI...2-11 Table 2-7 The formulas of the amended Carlson trophic state index...2-12 Table 2-8 The relationship between the TSIM and eutrophication...2-12 Table 2-9 The formulas of the comprehensive trophic level index...2-12 Table 2-10 The correlation between Chl-a of Chinese reservoirs and other parameters (rij, rij2 and
Wj)...2-13
Table 2-11 The relationship between the TLI and eutrophication...2-13 Table 2-12 The kinematic viscosity coefficient of water at different temperatures...2-14 Table 2-13 Factor level table...2-15 Table 3-1 Water body classification of the Mopanshan Reservoir...3-2 Table 3-2 Water body classification of the Songhuajiang River...3-2 Table 3-3 Variation of anion in the Mopanshan Reservoir and Songhuajiang River...3-8 Table 3-4 Variation of Fe and Mn in the Mopanshan Reservoir and Songhuajiang River...3-9 Table 3-5 Variation of Mn in April of 2017 and 2018 of the Mopanshan Reservoir...3-10 Table 3-6 Variation of heavy metal, Se and As in the Mopanshan Reservoir and Songhuajiang River...3-10 Table 3-7 Variation of fecal coliform in the raw water of the Mopanshan Reservoir and Songhuajiang River...3-14 Table 3-8 Variation of alga in the Mopanshan Reservoir...3-14 Table 3-9 Evaluation result of the CCME WQI...3-15 Table 4-1 The value of the eutrophication indicators of the Mopanshan Reservoir from 2016 to 2018...4-6 Table 4-2 The amended Carlson trophic state index of the reservoir...4-7 Table 4-3 The comprehensive trophic level index of the reservoir...4-7 Table 4-4 The major common water quality indices of the finished water in the Mopanshan
Table 4-5 Monitoring value of DBPs of the finished water in the Mopanshan Reservoir...4-25 Table 4-6 The major common water quality indices of the finished water in the Songhuajiang River...4-26 Table 4-7 Monitoring value of disinfection by-products of finished water in the Songhuajiang River in 2017...4-26 Table 5-1 Raw water quality of the Songhuajiang River...5-3 Table 5-2 Orthogonal test designs table...5-4 Table 5-3 Property comparison list of the U-shaped high efficiency settling inclined tube and hexagonal inclined tube...5-7 Table 6-1 Influence of pre-ozonation process on conventional treatment...6-3 Table 6-2 Effect of different dosage of ozone on dosage of coagulant...6-4 Table 6-3 Influence of the main ozone process on carbon filter...6-4 Table 6-4 The list of the detectable DBPs in the effluent...6-8 Table 6-5 The average removal rate of the two activated carbons...6-9 Table 6-6 Test of breakpoint chloranation...6-14 Table 6-7 Test of adding ammonia and chloride...6-17 Table 6-8 Variation of turbidity and hardness in the pipe network...6-24 Table 6-9 Variation of Fe and Mn in the pipe network...6-25 Table 6-10 Variation of total coliform and total plate count in the pipe network...6-25 Table 6-11 Water quality index and LR of the effluent...6-26 Table 6-12 Water quality index and WQCR of the effluent...6-27 Table 7-1 Estimate sheet of the fixed investments...7-3
Chapter 1. Introduction
Chapter 1. Introduction...1-1
1.1 Background...1-1
1.1.1 Water supply and water demand...1-1 1.1.2 Current situation of water supply...1-2
1.2 Research status of water supply safety at home and abroad...1-4 1.3 Research status of water purification technology at home and abroad...1-5
1.3.1 Enhanced coagulation...1-6 1.3.2 Enhanced filtration...1-7 1.3.3 Preoxidation...1-8 1.3.4 Ozone-activated carbon advanced treatment process...1-10 1.3.5 Biological Activated Carbon...1-11 1.3.6 Photochemical oxidation...1-12 1.3.7 Membrane treatment...1-14 1.3.8 Comprehensive assessment...,...1-15
1.4 Research on the application of O3/BAC process at home and abroad...1-16 1.4.1 Meilin waterworks in Shenzhen...1-16 1.4.2 Bijiashan waterworks in Shenzhen...1-17 1.4.3 Nanzhou waterworks in Guangzhou...1-17 1.4.4 Yangshupu waterworks in Shanghai...1-18 1.4.5 Shijiu waterworks in Jiaxing...1-18 1.4.6 Deep purification water plant of Qianguo Refinery in Jilin Province...1-19
1.5 Drinking water treatment process...1-20
1.5.1 Conventional treatment process...1-20 1.5.2 Ozone-activated carbon advanced treatment process...1-22
1.6 Review of water quality assessment method...1-23 1.7 Current Situation of water supply in Harbin...1-25 1.8 Research objectives and purposes...1-26 1.9 Organization of Thesis...1-26
1.9.3 Chapter 3. Comparison of water quality between the Mopanshan Reservoir and Songhuajiang River...1-27 1.9.4 Chapter 4. Pollution source analysis and comparison of the finished water quality of the Mopanshan Reservoir and Songhuajiang River ...1-27 1.9.5 Chapter 5. Pilot study on the enhanced conventional process in a waterworks of Harbin...1-27 1.9.6 Chapter 6. Pilot study on the advanced treatment in a waterworks of Harbin...1-27 1.9.7 Chapter 7. Engineering economic analysis...1-27 1.9.8 Chapter 8. Conclusions...1-27
1. Introduction
1.1 BackgroundIn the process of urban development, water plays a very important role. People's production and life are inseparable from it. It is the blood of the city, the basic needs of urban people's life, the basic guarantee of urban economic development, and the spiritual place of the city. For a city, water is not only a basic condition for production and life, but also an indispensable precious resource for ecological construction, economic construction, cultural construction and social construction. However, with the accelerating process of urbanization, the shortage of urban water resources and the harm of water pollution to the environment and ecology, as well as the problem of water quality shortage are becoming increasingly serious, which puts forward higher and more urgent requirements for the utilization of urban water resources and the protection of water environment. At the same time, the expansion of urban scale and the improvement of urban functions put forward higher requirements on water quantity, water quality, water environment, water ecology, water safety, water landscape, water culture and so on. Therefore, urban water environment planning is an important part of urban development planning, and also an important aspect of urban human settlements planning. Among them, water source plays an important role in urban development planning and ensuring the safety of urban water supply. As far as China's current development situation is concerned, the problems of water sources are mainly divided into the imbalance between water supply and urban water supply demand, and the water quality pollution of water sources. 1.1.1 Water supply and water demand
Water supply refers to the amount of water that can be provided by water conservancy projects under the given water supply conditions and considering the water demand requirements of water supply objects. It is an important link in the development of urban water supply whether the urban water supply quantity and water supply demand can be balanced [1, 2]. China is a country with serious drought and water shortage. Its total freshwater resources are 2800 billion cubic meters, accounting for 6% of the world's water resources, second only to Brazil, Russia and Canada. However, China's per capita water resources is only 2300 cubic meters, only 1/4 of the world average level. China is one of the countries with the poorest per capita water resources in the world, and there are obvious regional differences in water resources. Water resources in the north are scarce, while those in the south are relatively rich. At the same time, China is still a big agricultural country, agricultural water consumption has always accounted for a large proportion of the total water consumption. However, with the rapid development of urbanization and industry, the water consumption of various industries has not only changed greatly, but also its proportion [3, 4].
Fig. 1-1 (a) shows the changes of China's total water supply and growth rate from 2009 to 2019. As can be seen from the figure, China's total water supply reached its peak in 2013, and then with
the government's governance, the growth rate of total water supply began to slow down. In recent years, the total amount of water supply in China has remained basically stable, with an average annual variation of about ±1%. In 2018, China's total water supply volume was 601.55 billion cubic meters, a year-on-year decrease of 0.46%. China's water supply market has approached saturation and entered a stable development state. In addition, according to the survey, agricultural water consumption has always been the industry with the largest water demand, often exceeding 60%. The second is industrial water, which accounts for about 20%, the third is domestic water, and the last is ecological water. As can be seen from Fig. 1-1 (b), in 2019, China's agricultural water consumption reached 367.5 billion cubic meters, accounting for 61%; industrial water consumption reached 123.7 billion cubic meters, accounting for 21%; domestic water consumption reached 87.7 billion cubic meters, accounting for 15%; and ecological water consumption reached 20.2 billion cubic meters, accounting for 3%. From the change trend of the proportion, the demand proportion of domestic water and ecological water gradually increased, while the demand proportion of industrial water decreased gradually. It can be seen that although the urban water supply and water supply demand can reach a balance, domestic water and agricultural water still occupy a large proportion. However, domestic water and agricultural water are closely related to people's life and health. Therefore, compared with the relationship between water supply quantity and water supply demand, ensuring the water quality of water supply is particularly important in ensuring the safety of urban water supply, especially the water quality of water sources.
Fig. 1-1 Total water supply and water consumption of China. (a) Total water supply (b) Water consumption
1.1.2 Current situation of water supply
In recent years, with the rapid development of urban economy and society in China, the main problems faced by urban drinking water sources in China are water shortage and water pollution. Compared with the problem of water shortage, drinking water source pollution is more prominent. From the point of view of water sources, relevant reports show that one fifth of the water is below
the standard [5, 6]. As a water source, the most common water forms include rivers, lakes, reservoirs and groundwater. According to the results of the national water source investigation conducted by the Environmental Protection Bureau in 1989, 48% of the surface water sources and 20% of the underground water sources could not meet the standards of drinking water sources. By 1996, the two figures had risen to 83.31% and 27.71% respectively. In 2007, the river type water sources in Hunan and Anhui Province were the most worrying, with the compliance rate of 71.40% and 3.07%; the lake reservoir type water sources in Anhui and Jiangsu Province were the worst, with the compliance rates of 60.28% and 46.70%, respectively; and the worst groundwater source was Shanxi Province, with the compliance rate of 54.16%. Through investigation and analysis, it is found that frequent natural disasters and man-made organic pollution are the main threats to the drinking water sources in China. For example, in 2012, aniline leakage from a chemical plant in Shanxi Province led to water pollution in Zhanghe River Basin, which caused serious pollution in the upstream of Yuecheng Reservoir, leading to a large area of water cut-off in Handan city. In 2013, the tailing water discharged from the local industry and mining industry in Yunnan Province was directly discharged into Xiaojiang River. The main pollutant was xanthate, which led to the emergence of "milk River" in the urban area, which seriously threatened the safety of irrigation water for the surrounding people. In addition, the landfill pit in the upstream of Miyun Reservoir in Beijing seriously threatened the water quality safety of the reservoir water source. In addition, similar water source pollution incidents occur from time to time, such as Guiyang, Guangxi, Huaihe River, Taihu Lake, Tuojiang River, Songhuajiang River and other rivers, groundwater pollution in Shandong and North China Plain, Sanmenxia reservoir, Dongguan Songmushan reservoir, Fenhe reservoir and Chongqing Qianzhangyan reservoir were polluted. It can be seen that ensuring the water quality safety of water source is very important for urban development and people's health. Therefore, it is necessary to monitor the water quality of the water source, determine the distribution of the main pollutants and pollution sources, and put forward corresponding measures in line with the development of local cities.
Harbin is located in the northernmost part of China. It is an important central city, national granary and an important manufacturing base in northeast China. At present, there are two water sources in Harbin, one is Mopanshan Reservoir located in Wuchang City, which is a lake reservoir type water source area, and the other is Songhuajiang River which passes through Harbin urban area, belonging to river type water source area. Songhuajiang River has always been an important water source in the main urban area of Harbin. However, after the nitrobenzene pollution incident occurred in 2005, the Songhuajiang River gradually withdrew from the stage as the water source of Harbin. Therefore, the municipal government decided to use Mopanshan Reservoir as the main water supply source in the main urban area. However, after more than ten years of development, Mopanshan Reservoir as a water source has gradually highlighted the following three aspects: 1) Distance. Mopanshan
Reservoir is 180 km away from the main urban area of Harbin. The water supply belongs to long-distance water transmission, and the water loss is large. 2) Once the pipe burst, the water will be cut off in the main urban area of Harbin, which seriously hinders the development of urban production and the daily life of residents. 3) Mopanshan Reservoir has the trend of eutrophication, and the water quality is getting worse year by year. With the development of Harbin City, it not only puts forward higher requirements for water supply, but also ensures the safety of water quality. Therefore, monitoring the water quality of the two water sources (Mopanshan Reservoir and Songhuajiang River) in Harbin and proposing corresponding solutions to the problems faced by the urban water sources are the top priority to solve the water supply problems in the main urban area of Harbin. In addition, due to the special geographical location of Harbin, the winter duration is as long as five months, and the ice cover period is as long as 150 days. The special climate characteristics and water environment conditions in cold regions make the water pollution problem of the basin particularly prominent. Therefore, it is of great significance for the urban development of Harbin to analyze the water quality and pollution causes of water sources in Harbin and put forward corresponding control strategies.
In this paper, the Mopanshan Reservoir and Songhuajiang water source in Harbin are taken as the main research objects. The water quality monitoring data of the two water sources in recent three years are comprehensively analyzed and deeply studied. The water quality change characteristics, characteristic pollutants and pollution causes of the two water sources are determined. In order to ensure the safety of water supply in Harbin and the healthy development of the city, an effective technological process is used to treat the water source.
1.2 Research status of water supply safety at home and abroad
Water is an irreplaceable limited natural resource that human society depends on for survival and development. Among them, drinking water is closely related to human life. Obtaining safe drinking water is the basic need for human survival, and it is related to the people's physical and mental health and normal life. With the rapid economic and social development of cities, the urban population continues to grow, the living standards of residents continue to improve, the demand for water continues to increase, and the shortage of urban water supply is becoming increasingly prominent. At the same time, due to the extensive agricultural production methods in various drinking water sources, weak rural environmental protection work, insufficient environmental supervision capabilities, environmental pollution and ecological damage are prominent, water supply quality has deteriorated and changed, and urban drinking water supply safety faces water volume and the double challenge of water quality. To solve the problem of drinking water safety management, we must first clarify the definition of drinking water safety and establish its evaluation system. The opinion generally held by scholars in the industry in China is that drinking water safety refers to convenient and timely access to sanitary, healthy and clean drinking water. The evaluation indicators are: water
quality, water volume, guarantee rate, and convenience. The above indicators must meet the requirements at the same time [7, 8]. Only then can drinking water be considered safe or basically safe. The basic consensus reached so far is that water quality and water quantity are the two basic criteria for evaluating the safety of drinking water, and they are also important criteria [9, 10]. At present, in the urban areas of our country, the municipal pipe network is used for centralized water supply, so the degree of convenience does not affect the safety of drinking water. Therefore, in order to ensure the safety of water quality in drinking water sources, many domestic and foreign researchers have conducted a large number of relevant studies [11-14].
Zhu et al. [15] revealed the water supply safety of riverbank filtration wells from the comprehensive perspective of water level, quality and supply capacity of the well group. They concluded the RBF could provide turbidity, trace organic substances and major cations and anions (except for Ca2+and Mg2+) pre-treatment of the river water with the removal rates of 29%-95% for
some water quality indicators. However, limited improvement of water quality was observed with respect to some inorganic contaminants (Fe, Mn and NH4+-N) because the background
concentrations of them in the groundwater were higher than in the river water. When compared with the quality of the river water, the quality of RBFWs water was more stable, which made it more favorable for the design of post-treatment processes and long-term stable operation of waterworks. Shamsuzzoha et al. [16] attained the research objectives both qualitative and quantitative data were collected through household level questionnaire survey, visual observation, literature review, key informants interview (KII), sanitary inspection and laboratory analysis for water quality testing to find out the major disaster risks which have subsequent impacts on water supply system. Results showed about 54 percent of the respondents marked that increase of temperature, excessive rainfall and frequent storms are common disaster risks in the study area and around 67 percent of them mentioned that these disasters have impacts on water supply system. Li et al. [17] made use of the fuzzy comprehensive evaluation methods on the basis of fuzzy mathematics and GUI in MATLAB technology for Ji Nan urban supply system's all-round evaluation to find the potential impact factors. They found the main factors are: some pipelines are too old to be used, pipe material is aging, partial pipeline stress is too big.
1.3 Research status of water purification technology at home and abroad
Micro-polluted source water refers to water bodies that are polluted by organic matter, some of which do not meet the “Environmental Quality Standards for Surface Water” (GB3828-2002) Case III standard. The pollution degree of organic matter, ammonia nitrogen, and phosphorus in the micro-polluted water source water is relatively low, but there are many types of pollutants and the water quality is more complicated, which affects the reuse of water [18,19]. According to the nature of pollutants, the pollutants in the source water include physical pollutants, chemical pollutants and biological pollutants. Among them, physical pollutants include suspended solids, thermal pollution
and radioactive pollutants. Chemical pollutants include organic compounds and inorganic compounds. Biological pollutants include viruses, bacteria, and parasites. Although the concentration of pollutants in micro-polluted water sources is generally low, the existing conventional water treatment processes have limited ability to effectively remove low-concentration organic matter, but their harm cannot be ignored. The presence of some assimilable organic substances (AOC) can cause bacteria to multiply and spread diseases. After chlorine disinfection, disinfection by-products (DBPs), such as trihalomethanes (THMs) and haloacetic acids (HAAS), are produced. These pollutants are very harmful, difficult to degrade, and have bioaccumulation and "three causes" (carcinogenic, mutagenic, Teratogenic) effect. In general, the current water quality characteristics of domestic micro-polluted water sources show the following four aspects: ① Largely affected by industrial wastewater and domestic sewage; ② A large increase in dissolved organic matter in water; ③ It is difficult to remove harmful microorganisms; ④ Endocrine disrupting substances. the removal efficiency of environmental hormones is not high [20-22]. In view of the current water quality of micro-polluted drinking water sources, domestic and foreign researchers have already begun to study new technologies for water purification, and many technologies have been applied in actual production and have achieved good results. At present, the treatment technologies that are widely used at home and abroad mainly include: enhanced coagulation, enhanced filtration, pre-oxidation technology, ozone activated carbon combined technology, biological activated carbon technology, photocatalytic oxidation, membrane advanced treatment technology, etc [23-25].
1.3.1 Enhanced coagulation
Coagulation is an effective method to remove suspended and colloidal substances in water, and it is a common treatment technology in water treatment plant [26]. Enhanced coagulation technology is to improve flocculation conditions and increase the removal rate of organic matter in conventional treatments through a certain method [27]. Zhou et al. [28] investigated the removal of polystyrene (PS) and polyethylene (PE) microplastics using PAC and FeCl3 coagulation. Results showed that
PAC was better than FeCl3 in removal efficiency of PS and PE microplastics due to the charge
neutralization. Ren et al. [29] utilized various coagulants to treat concentrated leachate of an municipal solid waste incineration. The results showed that removals of chemical oxygen demand, light absorbing substances (at 25 nm), total nitrogen, color and turbidity were 68.42%, 69.01%, 44.14%, 92.31% and 87.44% under the optimal condition. And some parts of high molecular weight compounds could be eliminated by coagulation process. Zhang et al. [30] evaluated the feasibility of integrating high-basicity polyaluminum chloride (PAC) and high-viscosity chitosan for the coagulation of low-temperature and low-turbidity water. They found that higher-basicity PAC with a larger proportion of Alc(colloidal Al species in PAC) and smaller proportion of Ala(monomeric Al
species in PAC) was beneficial for removing turbidity and natural organic matter (NOM), as well as controlling the residual Al content. The combined coagulant exhibited an excellent coagulation
performance. The similar researches could be obtained from Eskibalci et al. [31] , Ding et al. [32], Hu et al. [33], Xiao et al. [34] and so on.
Intensified coagulation usually has the following methods [35-37]:
(1) More coagulants are used to destabilize the colloid in the water, and the colloid in the water settles from the water under the adsorption of the flocs;
(2) Another flocculant is added to enhance the adsorption and bridging effect, so that the organic matter is easily absorbed by the flocs and sink, such as adding the coagulant polyacrylamide (PAM), the newly developed MR polymer flocculant, etc;
(3) Adding a new type of water treatment agent has a comprehensive effect of oxidation and coagulation, which can effectively remove organic matter in the water;
(4) Adjust the mixing and flocculation reaction time to make the agent fully play its role, that is, to improve the flocculation conditions from the hydraulic conditions;
(5) Adjust the pH value. Practice shows that when there are a lot of organic matter, the effect of pH value 5~6 is better.
Intensified coagulation requires more coagulant or other agents, which will inevitably cause the increase of agent costs and sludge treatment costs.
1.3.2 Enhanced filtration
Filtration is a process in which solid pollutants in water can be separated from water by the interception capacity of medium [38]. It is also an essential treatment method in water purification process. The enhanced filtration technology is to cultivate microorganisms on the surface of the filter material without pre-chlorination, and use the physiological activities of microorganisms to remove organic matter in the water. Enhanced filtration means that the filter material can not only reduce turbidity, but also degrade organic matter, ammonia nitrogen and nitrite nitrogen. However, there are greater difficulties in the operation and management of this technology [39]. For example, it is necessary to control the intensity of backwashing, which can not only flush away the accumulated mud, but also maintain a certain biofilm. It is necessary to control the micro-environment of the filter to facilitate the growth of microorganisms. In addition, researchers have modified the surface of the filter material to improve the removal of pollutants in the filter.
Li et al. [40] investigated the filtration performance of multi-fiber filters by computational fluid dynamics simulating. Results indicated that filtration efficiency changed with the face velocity for different particle sizes. Marais et al. [41] compared the NOM removal efficiency by granular activated carbon (GAC) filtration, an ultrafiltration membrane and conventional water treatment plant. The results indicated that the conventional water treatment processes (coagulation, sedimentation and sand filtration) removed 61% and 24% NOM as indicated by UV254and dissolved
organic carbon (DOC) removal, respectively. A respective reduction of 73% and 25% of UV254and
achieved UV254removal of 86% and DOC removal of 28%. The performance and the capacity of the
activated carbon filtration in the natural organic matter removal were studied by Matilainen et al. [42]. They found that regeneration of the carbon improved the removal capacity considerably, but efficiency was returned to a normal level after few months. There was about 95% of the NOM was eliminated from the raw water. A detailed comparison of sand filtration (SF) and ultrafiltration (UF) was conducted by Xu et al. [43]. The results showed that SF conferred a slightly higher removal rate for UV-absorbing compounds, humic-like substances and protein-like substances than UF, with removal efficiencies of 21.9%, 19.8% and 26.1%. However, UF process achieved significantly higher removal of algae cells (98.7%) than SF due to size exclusion. Zheng et al. [44] also carried out a similar research.
1.3.3 Preoxidation
Pre-oxidation technology refers to adding a strong oxidant to raw water, using the oxidizing power of the oxidant to oxidize and decompose organic pollutants in the water, and improve the effect of coagulation and precipitation [45, 46]. Commonly used oxidants are chlorine, ozone, potassium permanganate and chlorine dioxide. Chlorine is the most commonly used oxidant in water plants, but because organic pollutants in water can react with chlorine to produce trihalomethanes (THMs), pre-chlorination to treat micro-polluted water sources has caused concerns [47]. Ozone (O3)
oxidation is a method that has received widespread attention in water treatment due to chlorine disinfection by-products have lethal harm to the human body. The ozone oxidation method does not produce harmful halogenated compounds like pre-chlorination, nor will it remain in the water. Because ozone has a strong oxidizing ability, it can change the nature of the pollutants by destroying the molecular structure of organic pollutants. Ozone is the most widely used new oxidant. It can improve the biochemical properties of organic matter in water, help improve the flocculation effect, and reduce the dosage of coagulant. However, studies have shown that if the water contains a higher concentration of bromide ions, ozone will interact with it to produce bromate, which is more toxic. After the water containing organic matter is treated with O3, it is possible to decompose
macromolecular organic matter into small molecular organic matter. Among these intermediate products, mutagenic substances may also exist. When the amount of O3is limited, it is impossible to
remove the ammonia nitrogen in the water, because when the organic nitrogen content in the water is high, O3oxidizes the organic nitrogen into ammonia nitrogen, causing the ammonia nitrogen content
in the water to increase instead. In addition, O3 is poorly oxidizing to some common priority
pollutants in water such as chloroform, carbon tetrachloride, polychlorinated biphenyls, etc., and easily generates glycerin, complexed ferricyanide, acetic acid, etc., resulting in the accumulation of incomplete oxidation products [48-50]. Potassium permanganate has a good effect on removing organic pollutants in water, and can significantly reduce the mutagenicity of water. It has been used in the production test of treating micro-polluted water sources. Pre-oxidation of potassium
permanganate can control the generation of chlorophenol and THMS, and has a certain color, smell and taste removal effect. It also has a good removal ability for olefins, aldehydes and ketones. However, some of the products after oxidation by potassium permanganate are precursors of base substitution mutants, which are not easily removed by subsequent processes. When the dosage of Cl2
is high, the precursors are transformed into mutagenic substances, which increase the mutagenic activity of the effluent [51, 52]. Chlorine dioxide (ClO2) can effectively destroy algae and phenol,
and improve the color, smell and taste of water. Chlorine dioxide is an oxidizing agent, not a chlorinating agent. It will not react with organic matter in the water like Cl2to produce halogenated
organic compounds that are harmful to humans and cause cancer. Studies have suggested that even the oxidation of ClO2itself can remove THMS precursors. However, due to incomplete oxidation,
some small molecular organic compounds are more likely to generate trihalomethanes [53-55]. Although chemical oxidants have a good effect on removing pollutants in water, the expensive operating costs and the formation of toxic by-products are always the limiting factors for their promotion and application.
Nakada et al. [56] assessed the occurrence of Giardia cysts in raw water, and in chlorinated or ozonated water from a drinking water treatment plant (DWTP) in Brazil, over a 16-month period. They found Giardia non-viable cysts were detected more frequently in ozonated water (80%) than in chlorinated water (68.2%) or raw water (37.7%). Ozonation and chlorination resulted, respectively, in ≈27.5- and ≈13- fold reduction of Giardia infection risk, when compared to the risk calculated for raw water. Ozonation has proven more efficient than chlorination against Giardia cysts in surface water. Laszakovits and MacKay [57] investigated the removal of cyanotoxins by potassium permanganate with a focus on incorporating competition by cyanobacterial cells and dissolved organic matter (DOM). The work showed that permanganate could efficiently remove microcystins on a treatment-relevant time scale. For most bloom conditions, potassium permanganate treatment (1 mg/L) alone will be sufficient to reduce microcystin concentrations (around 10 ppb) below state regulated standards (1.6 ppb). A treatment plant for lake Kinneret water, comprising treatment by two filtration steps, flocculation and disinfection with chlorine dioxide, was studied by Limoni and Teltsch [58] with a view to evaluating the effect of ClO2disinfection on drinking water quality and
determining the optimal mode of operation for the treatment plant. The finished water contained a residue of approx. 0.2 mg/L ClO2, approx. 0.35 mg/L ClO2− and low concentrations of suspended
matter (1.5 mg/L) and of chlorophyll (0.1 μg/L). Trihalomethane concentrations were negligible, and the bacteriological quality of the water was within the health authorities' requirements. It was shown that disinfection of treated water (after flocculation and filtration) was much more effective than that of raw water. Furthermore, disinfection in the optimal mode prevents accumulation of high chlorite concentrations leaving a residue of ClO2.
1.3.4 Ozone-activated carbon advanced treatment process
Ozone activated carbon method is commonly used at the end of the process for deep removal of pollutants in water. The treated water quality is stable and the water quality standard rate is high. In particular, ozone can not only destroy the structure of dissolved organic matter in water, improve its biological assimilation, but also improve the adsorption and biological treatment effect of activated carbon filter, and prolong the regeneration cycle of activated carbon. At the same time, ozone has the function of decolorization and sterilization. Therefore, ozone activated carbon technology is gradually favored by researchers [59-61]. At present, the activated carbon used in domestic water treatment can effectively remove small molecular organics. But it is difficult to remove large molecular organics, and the organic molecules in the water are much larger. Thus, the surface area of the activated carbon pores will not be fully utilized, which will inevitably accelerate the saturation and shorten the water production cycle. After adding ozone in front of the carbon or in the carbon layer, on the one hand, the macromolecules in the water can be converted into small molecules, and the molecular structure and form of the molecules can be changed, which provides the possibility of organic matter entering the smaller pores. The organic matter on the surface of the carbon is oxidized and decomposed, which reduces the burden of the activated carbon, so that the activated carbon can fully absorb the unoxidized organic matter, so as to achieve the purpose of deep water purification. This method can give full play to the advantages of both and has been widely used at home and abroad.
Guillossou et al. [62] studied the removal of 28 organic micropollutants (OMPs) present in a real wastewater effluent by ozonation coupled to activated carbon adsorption and compared to a sole adsorption. They found the OMPs removal increased with both the specific ozone dose and the powdered activated carbon dose. Wang et al. [63] carried out an advanced treatment of bio-treated dyeing and finishing wastewater (BDFW) using ozone-biological activated carbon (O3-BAC). They
found that O3-BAC could synergistically degrade the dissolved organic carbon (43.0%), chemical
oxygen demand (45.8%), color (73.0%), and specific UV absorbance (SUVA254) (29.7%) of BDFW.
Removal of sulfonamides (SAs) by an integrated O3-BAC process was evaluated in a pilot-scale
study by Li et al. [64]. Results indicated that ozonation could effectively remove SAs from water at an appropriate ozone dose with an improvement of water quality and result in an increase of disinfection byproducts formation potential (DBPsFP). However, the BAC filtration would lead to an increase of sulfonamide-resistant bacteria and effectively reduce DBPsFP to the safety-standard level of water quality. Kosaka et al. [65] applied ozone/biological activated carbon treatment to remove haloacetamides and their precursors (HAcAm-FPs) at water purification plants. The results showed that removal of total HAcAm-FPs during advanced water purification processes ranged from 50% to 75%. Gerrity et al. [66] carried out a pilot-scale evaluation of O3-BAC process for trace
processes were extremely effective in reducing the concentrations of a suite of trace organic contaminants after five months of continuous pilot-scale testing. Nishijima et al. [67] investigated the performance of an O3-BAC process under long term operation. They proved that the removal of
DOC and THMFP could maintain at 36% and 57% after operation for 910 days. Kim et al. [68] carried out a pilot plant study on O3-BAC process for drinking water treatment. The results showed
that biodegradable DOC increased by 20% after ozonation in O3-BAC and was removed effectively
by the attached bacteria on the activated carbon after 8 months of operation. Furthermore, Kato et al. [69], Knopp et al. [70], Lee et al. [71], Reungoat et al. [72], and Chu et al. [73] all reported the preferable removal efficiency of the O3-BAC process.
1.3.5 Biological Activated Carbon
Biological activated carbon (BAC) technology relies on the good adsorption performance of activated carbon, cultivates microorganisms on the surface of activated carbon, and uses the biodegradation of microorganisms to achieve the purpose of removing organic pollutants. Activated carbon is a good carrier for the growth of microorganisms, and the microorganisms on the activated carbon will play a positive role in improving the water treatment effect, especially prolonging the life of the activated carbon [74-76]. Therefore, activated carbon is not only used as an adsorbent for water treatment, but can also use the synergistic effect of activated carbon adsorption and microbial degradation to achieve good economic results. The premise of the biological activated carbon method is to avoid pre-chlorination, otherwise it will be difficult for microorganisms to grow on activated carbon. This technology uses the oxidation of microorganisms to increase the removal rate of organic matter, prolong the operation cycle of activated carbon, and reduce operating costs. However, the microorganisms on the activated carbon will fall off under the action of water flow, affecting the quality of the effluent, so it is usually in the biological activated carbon filter. After adding sand filter or precision filter to ensure the water quality.
Meng et al., [77] reported that aeration could be used to enhance the removal of long-chain PFAAs during AC treatments of drinking water at environmentally. They found aeration during AC treatment of water could enhance the removal of long-chain PFAAs, and improve the performance of AC during water treatment. Piai et al. [78] performed experiments at 5 °C and 20 °C with biologically active and autoclaved GAC to assess the biodegradation of ten micropollutants by the biofilm grown on the GAC surface. They have shown that temperature is positively correlated to adsorption of iopromide, iopamidol, diclofenac and hexamethylenetetramine, but negatively correlated to adsorption of desphenyl-chloridazon, guanylurea, melamine and metformin. Meanwhile, they could also demonstrate that the adsorption capacity of GAC used for more than 100,000 bed volumes is comparable to adsorption of fresh GAC for diclofenac and benzotriazole and higher for guanylurea, metformin and hexamethylenetetramine. Zheng et al. [79] applied high-throughput qPCR and sequencing to investigate the dynamics of ARGs and bacterial communities during the
advanced treatment of drinking water using biological activated carbon. The promotion of ARGs was observed, and the normalized copy number of ARGs increased significantly after BAC treatment, raising the number of detected ARGs from 84 to 159. Additionally, Twenty-nine ARGs were identified as biofilm-influencing sources in the BAC, and they persisted after chlorination. Lou et al. [80] focused on reducing the concentration of assimilable organic carbon (AOC) in treated drinking water. Experiments were conducted to evaluate the efficiency of AOC removal by biological activated carbon filters (BACF) in a pilot-scale system. The results showed that BACF reduced the total concentration of AOC. The concentration of AOC primarily indicated microorganism growth in a water supply network, and the amount of AOC in water was significantly reduced after BACF treatment. Li et al. [81] investigated the 17β-estradiol (E2) and estrone (E1) adsorption characteristics on GAC and evaluated the removal and E2 and E1 in a continuously operated GAC reactor, which was later converted to a BAC reactor. Under optimal operating conditions, the BAC reactor had an effluent E2 concentration of ∼ 50 ng/L. With the empty bed contact times tested, the reactor exhibited more robust E2 removal performance under the BAC operation than under the GAC operation.
1.3.6 Photochemical oxidation
The photochemical oxidation method is a water treatment technology that makes the oxidation reaction rate and oxidation capacity significantly higher than that of chemical oxidation and radiation under the combined action of chemical oxidation and light radiation. All photooxidation methods use ultraviolet light as the radiation source, and at the same time, a certain amount of oxidant such as hydrogen peroxide, ozone or some catalysts such as dyes and humus must be put into the water in advance. It has an excellent removal effect on difficult-to-degrade and toxic small-molecule organics. The photooxidation reaction produces many highly active free radicals in the water, which can easily destroy the structure of organics. It belongs to photochemical oxidation methods such as photo-sensitized oxidation, photo-activated oxidation, photo-catalytic oxidation and so on [82, 83].
The light-excited oxidation method uses ozone, hydrogen peroxide, oxygen and air as oxidants, and combines the oxidation effect of the oxidants with photochemical radiation to generate free radicals with strong oxidizing ability. Ultraviolet-ozone combined technology can oxidize organic matter in micro-polluted water that can not be oxidized by ozone, such as chloroform, hexachlorobenzene, carbon tetrachloride, and benzene, turning them into CO2and H2O, reducing the
mutagenic activity in water. Its oxidation effect is better than using UV and O3 alone. However, the
ability of UV-ozone process to remove organic matter or THMs needs to be further explored. The process cost is relatively high, and it is not easy to popularize and apply.
The photocatalytic oxidation method is to add a certain amount of semiconductor catalyst to the water. It can also generate strong oxidizing free radicals under ultraviolet radiation, which can
oxidize organic matter in the water. The commonly used catalyst is TiO2. The strong oxidizing
property of the method, the non-selectivity to the target and the characteristics of complete mineralization of organic matter in the end make the photocatalytic oxidation have a better application prospect in the advanced treatment of drinking water. However, the TiO2powder has fine
particles and is inconvenient to recycle. Compared with the traditional water purification process, the photocatalytic oxidation treatment has a higher cost and complex equipment, and its promotion and use in the near future are restricted. The main problems that need to be solved when photocatalytic oxidation is put into practical application are to determine the catalyst poisoning during long-term operation and seek the ideal regeneration method; solve the separation, recovery or immobilization of the catalyst; the design of the reactor and the improvement of the utilization rate of light energy. Therefore, the photocatalytic oxidation method is rarely used in large-scale actual water plants. However, it is foreseeable that with the continuous deepening of research, photocatalytic oxidation will certainly receive more and more attention [84].
The main research object of photosensitized degradation is the petroleum pollutant linear alkanes in the water environment. The sensitizer can extract hydrogen atoms from the carbon atoms of linear alkanes to generate hydroxyl groups, which are degraded into ketones, alkenes, aldehydes, alcohols, etc. under the action of oxygen. These compounds are more easily degraded by microorganisms in the water environment than alkanes. The commonly used sensitizer for photosensitization degradation is anthraquinone.
Comparison of O3-BAC, UV/H2O2-BAC, and O3/H2O2-BAC treatments for limiting the formation
of disinfection byproducts during drinking water treatment in India was investigated by Tak and Vellanki. [85]. The results indicated that AOP-BAC treatment was more effective in degrading precursors to THMs in highly anthropogenically influenced waters than treatment by only AOP or BAC, with O3/H2O2 -BAC treatment being the most effective. The efficiency of elimination of
organic UV filters by ozonation and UV254nm/H2O2 processes was assessed and predicted in
simulated treatments of sewage-impaired drinking water and wastewater effluent in bench-scale experiments by Seo et al. [86]. They mentioned that the elimination of the UV filters by the UV254/H2O2 treatment was controlled by radical ·OH, with a marginal contribution by the UV
photolysis. Graumans et al., [87] studied the effect of advanced oxidation on the cytostatic drug cyclophosphamide (CP) by comparing thermal plasma activation with UV/H2O2 treatment. They
found the oxidative degradation of CP in PAW resulted in a complete degradation within 80 min at 150 W, while CP was also completely degraded within 60 min applying UV/H2O2 oxidation.
Advanced oxidation process UV/H2O2was evaluated by Rozas et al., [88] as an alternative treatment
for the founded Organic micropollutants. Results indicated that 80% of DCL and TCS oxidation was achieved with a UV dose below 200 mJ·cm-2. For ATZ and CBZ de 80% degradation was achieved
and the main oxidation mechanism was driven by hydroxyl radical. Yin and Shang [89] investigated the removal of three selected micropollutants (i.e., bisphenol A, diclofenac and caffeine) in drinking water using the UV-LED/chlorine advanced oxidation process (AOP) followed by activated carbon adsorption. They found the degradation of bisphenol A, diclofenac and caffeine was predominantly contributed by chlorination (>60%), direct UV photolysis (>80%) and radical oxidation (>90%), respectively, during the treatment by the UV-LED/chlorine AOP at three tested UV wavelengths (i.e., 265, 285 and 300 nm).
The photochemical oxidation method is still in the development stage. Due to the high operating cost, it is difficult to apply it in large-scale production. However, the technology is developing rapidly, and its application in production will not be far away.
1.3.7 Membrane treatment
Membrane separation method is an emerging high separation, concentration, purification and purification technology. It uses natural or synthetic polymer membrane as a medium, and uses external energy or chemical potential as the driving force to filter two-component or multi-component solutions. Physical treatment methods for separation, fractionation, purification and enrichment. Membrane separation technology is a new and high-efficiency separation technology. It has the characteristics of no phase change of substances, large separation coefficient, operation at room temperature, wide application range, chemical saving, simple device and convenient operation. In recent years, the membrane method has been recommended by the U.S. Environmental Protection Agency (EPA) as one of the best processes in the United States, while Japan has adopted membrane technology as the base technology for the 21st century, and implemented the national key project "21st Century Water Treatment Membrane Research (MAC21)" , specially developed membrane water purification system. Common membrane methods include: microfiltration, ultrafiltration, nanofiltration, reverse osmosis, electrodialysis, pervaporation, liquid membrane and nanofiltration technology that just appeared. From the perspective of the function of membrane filtration, reverse osmosis can effectively remove pesticides, surfactants, disinfection by-products, THMs, humic acid and chroma in water. Nanofiltration membranes are used for the removal of organic substances with a molecular weight in the range of 300-1000. Ultrafiltration and microfiltration membranes can remove humic acid and other large molecular weight (greater than 1000) organic matter. Therefore, membrane filtration technology is an effective way to solve the poor quality of drinking water [90, 91].
Bu et al., [92] built a dynamic C-UF set-up to carry out the treatment of micro-polluted surface water, to investigate the characteristics of dissolved organic matter from different units. The influences of poly aluminum chloride and poly dimethyldiallylammonium chloride (PDMDAAC) on removal efficiency and membrane fouling were also investigated. Results showed that the dosage of PDMDAAC evidently increased the UV254 and dissolved organic carbon removal efficiencies, and
thereby alleviated membrane fouling in the C-UF process. The performance of a pilot-scale PAC-MBR under intermittent aeration and short SRTs (2, 4, 6, and 8 d) was investigated by Shao et al. [93]. It was found that intermittent aeration allowed enough sludge to be kept in suspension, and to provide enough oxygen for the PAC-MBR, and consequently did not have a dramatically negative effect on the pollutants removal efficiency of the PAC-MBR. Chu et al. [94] investigated the pollutant removal mechanisms for micro-polluted surface water purification in a BDDM reactor using a gravity filtration mode to drive the BDDM filtration. They found that Bacteroidetes, Firmicutes, Proteobacteria (e.g. α-, β-, γ-proteobacteria), Verrucomicrobia, and Nitrospirae were dominant in the bio-diatomite mixed liquor and removed organic matter and ammonium nitrogen. Yu et al. [95] evaluated the use of pulsed-UVC light, applied within an ultrafiltration membrane module, together with coagulation, as a method to control membrane fouling. They obtained UVC light with enough contact time and intensity in the membrane tank could prevent measurable membrane fouling over an operational period of 32 days. Under less favorable conditions (lower UVC intensity and higher flux), the combination of UV irradiation and coagulation was still able to mitigate membrane fouling compared to the conventional pre-treatment.
The membrane method can remove macromolecular organic substances such as colloids, particles, bacteria and humic acid in water, but is almost ineffective for low molecular weight oxygenated organic substances such as acetone, phenols, acids, and propionic acid. The barriers to further application of membrane technology to water treatment are: high capital investment and operating costs, prone to clogging, the need for high-level pretreatment and regular chemical cleaning, and the problem of concentrate disposal. However, with the improvement of cleaning methods, the improvement of membrane clogging and membrane fouling, and the reduction of various membrane prices, it is believed that in the near future, the membrane method will definitely have a significant impact in the field of water supply and drainage. At present, many universities and scientific research institutes in China have conducted a lot of research on membrane separation water treatment technology. Some researchers believe that it will become the core technology of the fourth generation of water treatment technology and has broad application prospects. However, the process still lacks mature operating experience and management experience, and large-scale engineering application still needs time [96].
1.3.8 Comprehensive assessment
In general, physical and chemical methods are more efficient. In particular, the development of various combined technologies is very effective in the removal of some refractory organic matter. Through efficient oxidation, most of the organic matter in the water is removed, and the mutagenic activity of drinking water is effectively reduced. However, these methods and equipment are relatively complex and require high operating and operating conditions. In particular, cost issues have severely restricted their popularization and use. Comprehensive comparison of these types of