Effects of n-Butanol Blends on the Formation
of Hydrocarbons and PAHs from Fuel-Rich
Heptane Combustion in a Micro Flow Reactor
with a Controlled Temperature Profile
著者
Mohd Hafidzal Bin Mohd Hanafi, Hisashi
Nakamura, Susumu Hasegawa, Takuya Tezuka,
Kaoru Maruta
journal or
publication title
Combustion Science and Technology
year
2020-02-20
URL
http://hdl.handle.net/10097/00130588
1
Effects of n-Butanol Blends on the Formation of
Hydrocarbons and PAHs from Fuel-Rich Heptane Combustion
in a Micro Flow Reactor with a Controlled Temperature Profile
Mohd Hafidzal Bin Mohd Hanafi 1, 2, Hisashi Nakamura 1, Susumu Hasegawa 1, Takuya Tezuka 1, Kaoru Maruta 1, 3
1 Institute of Fluid Science, Tohoku University, 2-1-1 Katahira, Aoba-ku, Sendai 980-8577, Japan
2 Faculty of Mechanical Engineering, Universiti Teknikal Malaysia Melaka, Hang Tuah Jaya, 76100, Durian Tunggal, Melaka, Malaysia
3 ICE Lab., Far Eastern Federal University, Russky Island, Vladivostok, Russia
Corresponding author Mohd Hafidzal Bin Mohd Hanafi Universiti Teknikal Malaysia Melaka
2 Abstract
The effects of the addition of n-butanol on the formation of hydrocarbons and polycyclic aromatic hydrocarbons (PAHs) of n-heptane combustions were investigated using a micro flow reactor (MFR) with a controlled temperature profile. The concentrations of small and large hydrocarbons, as well as PAHs were measured at a maximum wall temperature of 1,100 K and atmospheric pressure. The values obtained from several mechanisms were compared to the measurement values at equivalence ratios of 2.0 - 5.0. The CRECK mechanism was in fair agreement with the measurements.
The computational results confirmed that the concentration of the PAHs and soot precursors’decreased, while that of CO and CO2 increased due to the addition of butanol. These trends were also shown by the measurement values. The reaction path and rate of production analyses were carried out to identify the major reactions contributing towards species concentrations. (142 words/150 words).
Keywords
3 Introduction
Polycyclic Aromatic Hydrocarbons (PAHs) and soot emission are known to be harmful to humans (Barfknecht 1983; Nielsen et al., 1996), the environment (Andreae 2001; Bond et al., 2013) and engines (Green and Lewis 2007; Mahmood 2011). Soot is produced from the accumulation of hydrocarbons and PAHs (Haynes and Wagner 1981; Glassman 1988; Randall et al., 1997; Ruiz et al., 2007), which renders the reduction of hydrocarbons and PAHs extremely important in the context of solving the aforementioned associated problems.
Alexandrino et al. (2016) posited that one method that can be used to reduce soot emission from engines is mixing the main fuels with additives, such as oxygenated fuels. Westbrook et al. (2006) came up with and used a chemical kinetic model to elucidate the effects of the addition of oxygenated hydrocarbons on soot emissions from diesel engines. He reported that most of the oxygen atoms in oxygenated fuels produce increased amounts of CO and CO2, and the stagnation of the content of CO and CO2 in the emission reduced the subsequent concentration of soot precursor. Esarte et al. (2012) analyzed the pyrolysis of acetylene as a baseline, mixed with methanol, ethanol, iso-propanol, and n-butanol in a flow reactor. Their results and subsequent conclusion were similar to that of Westbrook et al. (2006), reporting that alcohol reduced the concentration of soot in the emission. The mixed fuel mostly forms into CO and CO2, which then remove the carbon from alcohol, negating soot formation pathways in this case, resulting in reduced soot formation.
Butanol, which is an oxygenated fuel, is a promising alternative fuel and is regarded as a second generation biofuel (Jin et al., 2011; He et al., 2013). Butanol is being studied due to its superior properties relative to methanol and ethanol (Merola et al., 2012; Yang et al., 2014), such as its higher energy density (Merola et al., 2012), excellent intersolubility relative to base fuels such as gasoline and diesel (Rakopoulos et al., 2010), and lower corrosion ability (Grana et al., 2010) and vapor pressure (Sarathy et al., 2009; Grana et al., 2010). Moreover, butanol, as an oxygenated fuel, is known for its capability for reducing soot. This increased interest in soot reduction via the application of butanol as a fuel additive. n-butanol was selected for use in this study, while n-heptane was selected as the base fuel, due to its status as being one of the components of primary reference fuel (PRF) for verifying gasoline octane number and also an element of commercial gasoline.
Overview of previous studies involving heptane and butanol are tabulated in Table 1, encompassing parametric conditions, measured properties, and experimental devices.
4
Table 1 Previous studies on n-butanol and n-heptane.
Fuel Temperature [K] Equivalence
ratio Pressure Measured properties Experimental device Reference
n-butanol Flame: 400 to 2,000
JSR: 850 to 1,250
0.25 to 2 1 [atm] Species measurement and chemical kinetic mechanism
JSR, counterflow diffusion flame with FTIR and GC (Sarathy et al., 2009) n-butanol 1,100 to 1,800 0.5, 1.0 and 2.0 1, 2.0 and 8 [atm]
Ignition delay times Shock tube (Black et al., 2010)
n-butanol/O2/Ar 1,200 to 1,650 0.5, 1.0 and 2.0
2, 5 and 10 [atm]
Ignition delay times Shock tube (Zhang et al., 2012) Butanol isomer 500 to 2,000 0.7 to 1.6 1 to 80 [atm] Chemical kinetic
mechanism JSR, MBMS, Shock tube and RCM (Sarathy et al., 2012)
n-heptane/n-butanol
1,200 to 1,500 0.5 and 1.0 2 and 10 [atm] Ignition delay times Shock tube (Zhang et al., 2013)
n-butanol/n-dodecane
1,200 to 1,600 2.2 1 [atm] Sooting behaviour A two-stage burner with SMPS (Ghiassi et al., 2014) n-butanol and soybean biodiesel
700 to 1000 0.5 to 1.0 0 to 1.5 MPa Spray, flame natural luminosity and soot quantitative
Constant volume
chamber with multi laser diagnostics
(Liu et al., 2014)
n-heptane Ignition delay times: 726–1,412 Species: 500– 1100
0.25, 2.0 and 4.0
1 [atm] Ignition delay times Shock tubes (Zhang et al., 2016)
Diethyl ether (DEE) and n-butanol/n-butane
400 to 2,500 1.75 and 1.8 4 [kPa] Hydrocarbons related to soot precursor Measurement Laminar premixed flame, EI-MBMS-GC and SVUV-PI-MBMS (Tran et al., 2017) Butanol isomers and diesel surrogate
1750 5.0 1 [atm] PAHs and soot volume fraction
LIF and LII (Chen et al., 2017)
Toluene/n-butanol
400 to 2,000 1.75 30 [torr] Flame species such as radicals, isomers and
Synchrotron beamlines and SVUV-PIMS
5 PAHs n-butanol, 2,5-dimethylfuran (DMF) and diesel surrogate
500 to 1900 5 1 [atm] Sooting behaviour LIF and 2C-LII (Liu et al. 2018)
n-heptane/n-butanol
1,300 1.5 to 4 1 [atm] Sooting limits Micro flow reactor with a controlled temperature profile (Hafidzal et al., 2018) Butanol isomers/ethylene
1200 to 2000 2.01 to 2.46 1 [atm] Carbon particulate matter formation
Particle size distribution measurement with LIF and LII
(Russo et al., 2019) Jet stirred reactor (JSR), fourier transform infrared spectroscopy (FTIR), gas chromatography (GC), molecular-beam mass spectrometry (MBMS), scanning mobility particle sizer (SMPS), rapid compression machine (RCM), electron ionization (EI), synchrotron vacuum ultraviolet (SVUV), photoionization (PI), laser-induced fluorescence (LIF), laser-induced incandescence (LII) and two-color laser-induced incandescence (2C-LII).
6
Sarathy et al. (2009, 2012) proposed a chemical kinetic mechanism for butanol isomers, and validated it using measurement values obtained from jet-stirred reactors (JSR), shock tubes, and rapid compression machines (RCM). Black et al. (2010) and Zhang et al. (2012, 2013, 2016) investigated ignition delay using shock tubes at multiple temperatures, equivalence ratios, and pressures. Tran et al. (2017) and Li et al. (2018) conducted mole fraction measurements for PAHs species and soot precursor. Trans et al. (2017) reported that mixing butanol and n-butane did not show clear reduction effects to the species measurement of soot precursor while Li et al. (2018) shows blending n-butanol and toluene reduces concentration of soot precursor . In another approach, Ghiassi et al. (2014) investigated sooting behaviors of butanol and n-dodecane mixings by looking at sooting tendency and sooting stability. Hafidzal et al. (2018) analyzed the influence of the addition of butanol on the sooting limit of n-heptane at a maximum wall temperature of 1,300 K, 1 atm, and equivalence ratios of 1.5 - 4.0. Liu et al. (2014) investigated soot formation by n-butanol and soybean biodiesel in temperature ranged from 700 K to 1000 K. They found out that n-butanol is better than biodiesel in soot reduction. Then, Liu et al. (2018) investigated the effects of oxygenated fuel (n-butanol and 2, 5 – dimethylfuran (DMF)) on PAHs and soot from diesel surrogate (n-heptane and toluene). Measurement were conducted by laser induced fluorescence (LIF) and two-color laser – induced incandescence (2C – LII). On the other hand, a combined detailed kinetic model has been applied to investigate on chemical effect. They found out that addition of n-butanol shows more significant PAHs and soot reduction compared to the addition of DMF. Chen et al. (2017) and Russo et al. (2019) performed detailed investigation about butanol group, by looking to the effects of the addition of butanol isomers (n-butanol, s-butanol, i-butanol, and t-butanol) on soot formation. Chen et al. (2017) found out that soot formation tendency is different for each butanol isomers. They clarified that the tendency by t-butanol > i-butanol > s-butanol > n-butanol. This finding is consistent with the study of Russo et al. (2019) which reported that soot reduction by t-butanol is better compare to n-butanol.
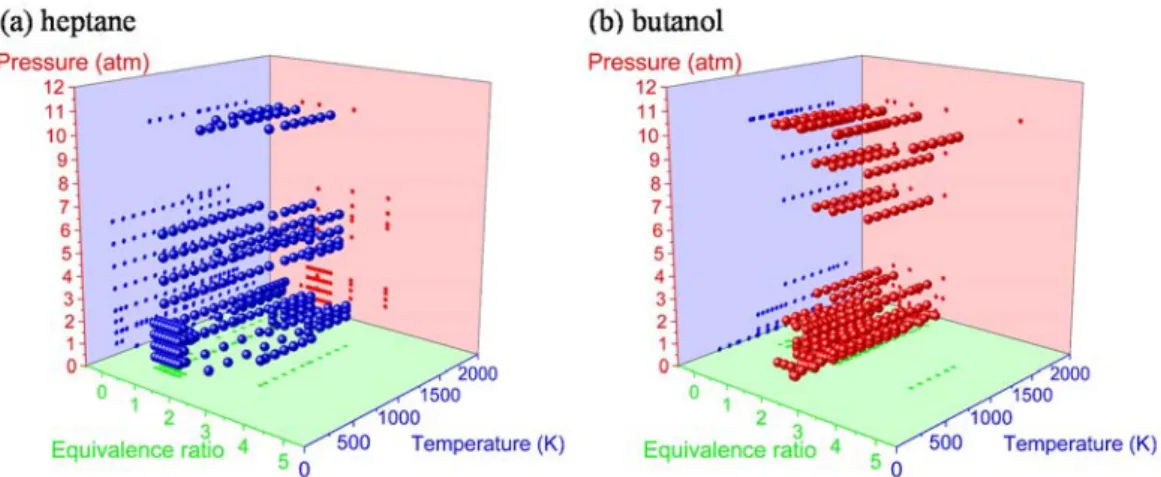
To gain a more detailed insight into the parameters outlined in previous studies, a three-dimensional graph of fundamental studies involving multiple equivalence ratios, temperatures, and pressures for heptane and butanol were plotted, and is shown in Fig. 1.
7
Figure 1. Parameter ranges of pressure, equivalence ratio, and temperature studied for (a) heptane and (b) butanol. Data were from Ingemarsson et al. (1999), Davidson et al. (2007, 2010), Smallbone et al. (2009), Yao et al. (2009), Akih-kumgeh and Bergthorson (2010), Yamamoto et al. (2011), Herbinet et al. (2012), Sileghem et al. (2013), Hakka et al. (2015), Seidel et al. (2015), Tekawade et al. (2016), Loparo et al. (2017) and Savard et al. (2018) studied for (a) heptane and Dagaut et al. (2009), Sarathy et al, (2009), Black et al. (2010), Togbé et al. (2010), Oßwald et al. (2011), Cai et al. (2012), Zhang et al. (2012), Hansen et al. (2013), Braun-unkhoff et al. (2017) and Tran et al. (2017) for (b) butanol.
Figure 1 shows most of the past studies evaluated equivalence ratios less than 2.0. This could be due to the difficulty associated with handling stable premixed flames at higher equivalence ratios. However, this work explored the usage of range of higher equivalence ratios (2.0 - 5.0). This method was pursued due to the capability of the MFR in carrying out experiments at wider equivalence ratios relative to other reported methods (See Table 1). Previous studies reported significant progress in covering an approximate range of temperatures (500 – 2,000 K) and pressures (1 - 10 atm). A maximum wall temperature of 1,100 K and atmospheric pressure were the parameters used in this study, which takes advantage of the MFR, where soot formation could be prevented even at higher equivalence ratios, which would allow for the investigation of the formation of PAHs and soot precursors at atmospheric pressures and under 1,100 K for extremely fuel rich conditions.
Hafidzal et al. (2018) conducted an experiment examining the critical sooting equivalence ratio for heptane, heptane and butanol, and butanol using MFR to determine their respective sooting tendencies. The critical sooting equivalence ratio was defined as the lowest equivalence ratio where soot is evident. The experimental results confirmed that the critical sooting equivalence ratio for n-heptane is 2.0, which is further extended with the addition of butanol, implying that the addition of butanol does indeed reduce sooting tendencies. The present work involved the continuous measurements of intermediate species related to soot formation, encompassing small and large hydrocarbons, as well as PAHs species. As per
8
(Hafidzal et al., 2018), the MFR was equipped with a sampling device to elucidate the effect of the addition of butanol on multiple intermediate species and equivalence ratios, including fuels in rich conditions.
MFR is a simple device that was developed during micro-combustion research. Initially, it was used to examine overall flame response in microscale heated channel and three modes of flames such as normal flames, oscillating flames and weak flames were found. Among them, weak flames of various fuels were examined to identify the fuels’ reactivity and ignition-related characteristics, such as dimethyl ether (DME) (Oshibe et al., 2010), n-heptane (Yamamoto et al., 2011), gasoline primary reference fuel (PRF) (Hori et al., 2012), n-heptane/n-toluene (Hori et al., 2013), diesel surrogate (n-cetane, n-decane, n-heptane, iso-cetane, and α -methylnaphthalene) (Suzuki et al., 2013), natural gas components (methane, ethane, propane and n-butane) (Kamada et al., 2014), and syngas (Nakamura et al., 2016). Previous studies also confirmed that the radical quenching effect(s) of the quartz tube is indeed negligible (Saiki and Suzuki, 2013; Kizaki et al., 2015). Subsequently, MFR was used to determine the sooting behavior of the tested fuels at higher equivalence ratios (Nakamura et al., 2014; Nakamura et al., 2015; Dubey et al., 2016; Hafidzal et al. 2018). A significant advantage of MFR is its ability to distinguish three separate zones, corresponding to the flame, PAHs growth, and soot formation.
The objective of this study is to determine the effects of n-butanol blends on the formation of hydrocarbons and PAHs from fuel-rich n-heptane combustion in an MFR equipped with a controlled temperature profile.
9 Experimental setup and method
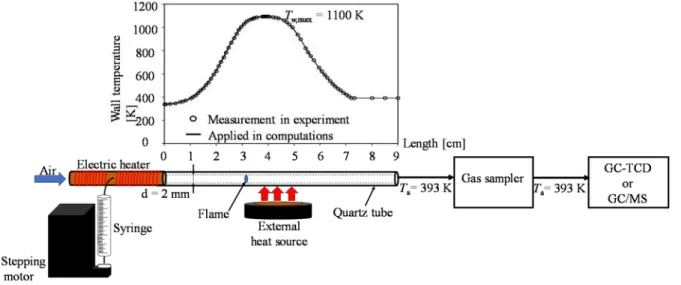
A schematic of the MFR and the wall temperature profile measured in the experiments are shown in Fig. 2. It consists of a quartz tube with a 2 mm inner diameter, which is smaller than the conventional quenching diameter. A quartz tube is employed as its reactor channel. An external heat source (hydrogen/air burner) is located below the reactor channel to form a stationary temperature gradient in the reactor channel in the flow direction. The wall temperature along the inner surface of the reactor is measured using a K-type thermocouple, by inserting the TC from the downstream end of the quartz tube.
Figure 2. Schematic diagram of the MFR connected to a gas sampler and GC-TCD or GC/MS. All of the experiments were conducted at atmospheric pressure. This study used an oxygenated-gasoline/diesel surrogate fuel, consisting of an n-heptane/n-butanol mixtures with different mole percentages, which are 100/0 (hp100), 50/50 (hp50bt50), and 0/100 (bt100). The fuel mixture in this study are denoted as hp100, hp50bt50, and bt100. The purities of n-heptane and n-butanol exceeds ~99% (Wako Pure Chemical Industries, LTD). The fuels are pumped using a 500 μL syringe (1750; Hamilton Co.), and the flow rate of the fuels are controlled by a stepping motor. A calibrated mass flow controller (3200; KOFLOC Co.) is used to control the air flow rates. The fuels are vaporized by air that had been heated by an electric heater, located on the upstream side of the quartz tube.
Two types of gas analyzers were used for the MFR sampling experiment: 1) Gas Chromatography-Thermal Conductivity Detector (GC-TCD) for small hydrocarbon (C1 to C2) measurements, and 2) Gas Chromatography/Mass Spectrometry (GC/MS) for larger hydrocarbons and PAHs (C6 to C10) measurements. Figure 2 also shows a schematic diagram
10 of the MFR setup equipped with GC-TCD or GC/MS.
For the first experiment, the small hydrocarbon measurements were conducted at higher equivalence ratio, ϕ, of 2.0 - 5.0. The inlet mean velocity, U0, was set to 10 cm/s, and the maximum wall temperature, Tw,max,was set to 1,100 K. This temperature was selected after conducting several trial experiments to ensure the absence of soot formation during species measurement. The measurements target the gas phase of small and large hydrocarbons, as well as PAHs prior to the formation of soot.
To measure the small hydrocarbon species, the exit portion of the MFR was connected to a gas sampler. The sampling gas volume was 250 μL, with the sampling line temperature,
Ts, maintain at 393 K via electric heaters to prevent condensation. The sampler gas was used to ensure that the volume of the sampling is constant prior to it flowing to GC-TCD. The GC (GC-2014; Shimadzu Corp.) is a model equipped with a thermal conductivity detector and TCD, with helium acting as its carrier gas. Two types of columns were used: SHINCARBON ST, measuring 2.0 m in length with a 3.0 mm inner diameter for the sampler gas; and Shimalite Q, measuring 0.5 m in length and an inner diameter of 3.0 mm as its reference. The column temperature was set to 150 °C, while the injection temperature and TCD temperature were both set to 210 °C. Six species were identified, which are ethylene (C2H4), acetylene (C2H2), ethane (C2H6), methane (CH4), carbon monoxide (CO), and carbon dioxide (CO2).
The second experiment measures large hydrocarbons and PAHs species measurement using GC/MS (Agilent 7890/5975) instead of GC. The temperature for the sampling line, Ts, connected to the sampler gas and GC/MS was kept at 393 K to prevent condensation. Agilent DB-5 ms Ultra Inert column measured 60 m in length, 250 µm in its inner diameter, and a film 0.25 µm thick was used, with helium as its carrier gas. The temperature of the column was set to 325 K for 10 minutes, then increased to 473 K at 20 K/min for 2 minutes. Seven sampled gases, which were benzene (C6H6), phenol (C6H5OH), benzaldehyde (C7H6O), toluene (C7H8), styrene (C8H8), and napthalene (C10H8) were measured. The concentration of benzene were determined by standard calibration gas, while the concentrations of other species were calculated using the relative response factor.
Computational method
The computational method used in this work is identical to the one reported in Kamada et al. (2014), Kikui et al. (2015), and Dubey et al. (2016). The flow inside the reactor was modeled as a one-dimensional reactive steady flow with heat convection between the gas phase and the inner wall (Maruta et al., 2005), as shown below.
11
𝑀 − 𝜆𝐴 + ∑ 𝜌𝑌 𝑉 𝑐 + ∑ 𝜔 ℎ 𝑊 − 𝑇 − 𝑇 = 0
In this case, the PREMIX code was modified to include the energy equation. The wall temperature profile (see Fig. 2), pressure (1 atm), and mean inlet velocity (10 cm/s) in this simulation is the same as the ones used in the experiment. Several chemical kinetic mechanisms were used for comparisons with the experimental results. In the case of hp100, the following mechanisms were used: the CRECK mechanism developed by the Chemical Reaction Engineering and Chemical Kinetics (CRECK) modeling group (Frassoldati et al., 2010, 2012), the Wang mechanism by the Engine Research Center, University of Wisconsin, Madison (Wang et al., 2013), the reduced Livermore (Seiser et al., 2000), the KUCRS (Miyoshi, 2011), and the detailed Livermore mechanisms (Curran et al., 1998; Mehl et al., 2011) developed by Lawrence Livermore National Laboratory. In the case of hp50bt50, the computations for the measured species were performed using the CRECK mechanism and Wang mechanism, while in the case of bt100, the CRECK, the Wang, the Sarathy (Sarathy et al., 2012), and the Veloo mechanisms (Veloo et al., 2010) were used.
Results and discussion
Species measurement of small hydrocarbons, CO and CO2.
Figure 3 shows the dependence of the measured and computed small hydrocarbon species’ mole fractions. The performance of the reaction mechanisms were examined by comparing the species’ mole fraction between computational and experimental results. This section details the formation of six species (C2H4, C2H2, C2H6, CH4, CO, and CO2), which represents the overall primary reactions from the pyrolysis of hp100, hp50bt50, and bt100 at multiple equivalence ratios. The measurement results were divided into two behaviors; the first consists of species that are directly proportional to the equivalence ratios, which are C2H4,C2H2, C2H6, CH4, and CO, while the second consists of species that are not proportional to the equivalence ratios, which is CO2.
The behaviors of C2H4, C2H2, C2H6, CH4, and CO will be discussed in the context of the first group. For hp100, KUCRS and reduced Livermore mechanism under-predicted the measurement of C2H4,especially at equivalence ratios of 3.0, 4.0, and 5.0. However, Wang, CRECK, and detailed Livermore mechanisms reported fair agreement with the measurement results. The capability of Wang and CRECK mechanisms for hp50bt50 were tested, and they
12
reported adequate prediction. In the case of bt100, Sarathy, CRECK, and Veloo mechanisms reported similar trends, with the measurement results directly proportional to the equivalence ratios.
For C2H2, most of the mechanisms under-predicted the experimental concentrations, but for bt100, the Veloo mechanism over-predicted the measurement results relative to the experimental results. The computations reported a trend similar to that of the measurement results of C2H6, but most over-predicted the measurement results, especially at higher equivalence ratio for the reduced Livermore and Wang mechanisms at hp100. It is also readily apparent that at an equivalence ratio of 2.0 for bt100, C2H6 cannot be detected due to its signal being too weak.
For CH4’s mole fraction, the measurements show that it is directly proportional to the equivalence ratios, which is a trend evident in all of the mechanisms. The computation of CH4 mole fraction using the detailed Livermore mechanism reported better agreement in the case of hp100, while the CRECK mechanism reported better agreement for hp50bt50 and bt100 relative to the other mechanisms. The highest measurements among the species are shown in the CO mole fraction for bt100 at ϕ = 5.0, ~20%. However, the computational results failed to agree with the measurements, where the mechanisms under-predicted the experimental results. The mechanism reporting the values closest to measurement values is CO calculated using the Reduced Livermore mechanism in the case of hp100. Unfortunately, this mechanism does not include butanol reactions, and is unavailable for hp50bt50 and bt100. The CO mole fraction computed by the Wang mechanism reported a completely opposing trend with the experimental results, which is directly proportional to the equivalence ratio. Generally, the computation results reported by the CRECK mechanism have a trend similar to the measurement results in the case of all fuels.
13
Figure 3. Experimental and computational results of a) C2H4 b) C2H2 c) C2H6 d) CH4 e) CO and f) CO2 for hp100, hp50bt50 and bt100 at U0 = 10 cm/s, ϕ = 2.0 to 5.0, and Tw,max = 1100 K.
LCR】iCKmc
c
hzLrt・BrTt ▲W・..8meChzLrtL一m + RedLl∝dL,、- 0,emcchzLm一m +veLoomdlZLn・BrTt+K IJCLtSmEdzLm
B
r
T
t
◇sJ'al^ymcc
hmBrTtXD由 ■Lcd L IVm O'cmcChzLrt■8m XIxpmmcllt 6 ] 2 3 4 5 6 ] Eql】LYaLロlECratlOH 6 1 2 3 4 5 6 ) )quLVJlm∝ Tat】DH 7 r l T, ÷ せ せ t . ・・ . 什 -‖ ・ - ‖ -汁 -1 . r Ll ⋮ 仙 純。
豊 M M 川。
= ' -E 班 。E。
叫 川 和 は 芸 。 o 恥 " -a o N 。E 。E 。E。
U l l 1 6 C 2 I I E C 6 1 2 I.0 .p 宅 tO ユ ーMu
M L・ h L X芸 uO LTD Yg aLO与
-。
。2[・]
︼'
w u . q D占 。tOtu
.rt
. U S r・二 一Y D r・ LJD .T3 ・⋮岩
.rZ
D S [・) 盲 re LW 一73 t⋮ Otu O U e L・ニ ー 至 Y u . T P YD 3t OtuEO
U
14
The second behavior shows that the CO2 is inversely proportional to the equivalence ratios, with all of the mechanisms reporting a similar trend to that of the measurement results in the case of all fuels. For hp100, the KUCRS mechanism reported the best agreement with the experimental results. The Detailed Livermore and Reduced Livermore mechanisms under-predicted the concentration of CO2. However, for hp50bt50 and bt100, the CRECK mechanism reported better agreement with the measurements, especially at higher equivalence ratios. In these conditions, the Wang, Sarathy, and Veloo mechanisms under-predicted the measurements.
Overall, in the case of the small hydrocarbons species measurements, the CRECK mechanism reported fair agreements with all of the measurements. The next section details the application of the CRECK mechanism for the elucidation of the effect of the addition of butanol to n-heptane for the C1 and C2 species at equivalence ratios of 2.0 - 5.0.
Effect of butanol addition on C2H2 and C2H4 as well as CO and CO2.
As detailed previously, Westbrook et al. (2006) and Esarte et al. (2012) outlined that most of the oxygen atoms available along with the oxygenated fuels produce CO and CO2. Since both molecules are strongly bonded, they do not form soot, which means that the concentration of soot precursors such as C2H2 and C2H4 can actually be decreased. However, these studies did not detail the major reactions involving the targeted species. This work intends to elucidate the effects of the addition of butanol on C2H2, C2H4, CO, and CO2.
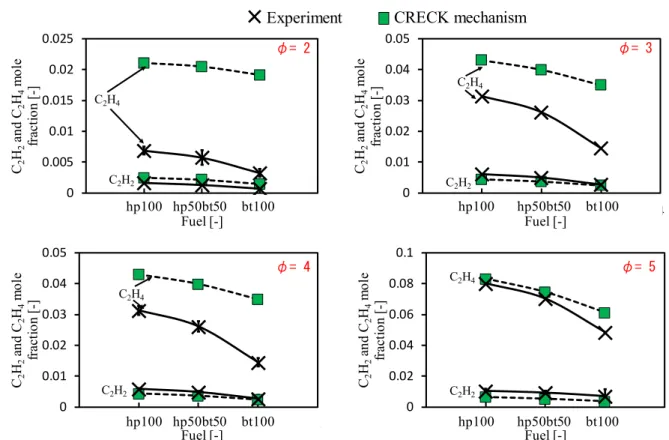
Figure 4 shows comparisons of the experimental and computational results of C2H2 and C2H4 mole fractions at ϕ = 2.0 - 5.0 and Tw,max = 1,100 K. It is apparent that the C2H4 mole fraction in the experiments are inversely related to the mole percentage of butanol. This trend was simulated using the CRECK mechanism, although there are quantitative differences between the measured C2H4 mole fractions and modelled predictions at ϕ = 2.0–4.0. A similar trend was observed for C2H2. The computation of C2H2 concentration shows excellent agreement with the measurement results in the case of all equivalence ratios. Here, the decreasing C2H4 and C2H2 concentrations confirm the capability of butanol in reducing soot formation.
The effect of the addition of butanol on CO and CO2 at ϕ = 2.0 to 5.0 and Tw,max = 1,100 K is shown in Fig. 5. A significant increasing trend is evident for CO and CO2 concentrations due to the addition of butanol at higher equivalence ratios (3.0, 4.0, and 5.0) relative to the equivalence ratio of 2.0. Overall, the CRECK mechanism reported excellent prediction for the
15
CO2 mole fraction. In the case of the CO mole fraction, the trend remained consistent with the measurement results, but require some modification to its mechanism.
Figure 4. Effects of the addition of butanol on C2H2 and C2H4 at U0 = 10 cm/s and Tw,max = 1,100 K. 0 0.005 0.01 0.015 0.02 0.025 0 1 2 3 4 C2 H2 and C2 H4 mo le fr act io n [-] Fuel [-] C2H4 C2H2 φ= 2 hp100 hp50bt50 bt100 C2H4 0 0.01 0.02 0.03 0.04 0.05 0 1 2 3 4 C2 H2 an d C2 H4 mo le fr act io n [-] Fuel [-] φ= 3 C2H2 C2H4 hp100 hp50bt50 bt100 0 0.01 0.02 0.03 0.04 0.05 0 1 2 3 4 C2 H2 and C2 H4 mo le fr act io n [-] Fuel [-] C2H4 C2H2 φ= 4 hp100 hp50bt50 bt100 0 0.02 0.04 0.06 0.08 0.1 0 1 2 3 4 C2 H2 and C2 H4 mo le fr act io n [-] Fuel [-] φ= 5 C2H2 C2H4 hp100 hp50bt50 bt100 Fuel [-] Fuel [-] Fuel [-] Fuel [-] CRECK mechanism Experiment 0 0.05 0.1 0.15 0.2 0.25 0 1 2 3 4 CO a nd CO 2 m ol e fr ac ti on [-] Fuel [-] 0 0.05 0.1 0.15 0.2 0.25 0 1 2 3 4 CO a nd CO 2 m ol e fr ac ti on [-] Fuel [-] CO CO2 φ= 2 hp100 hp50bt50 bt100 CO2 0 0.05 0.1 0.15 0.2 0.25 0 1 2 3 4 CO a nd CO 2 m ol e fr ac ti on [-] Fuel [-] φ= 3 CO CO2 hp100 hp50bt50 bt100 φ= 4 hp100 hp50bt50 bt100 CO CO2 0 0.05 0.1 0.15 0.2 0.25 0 1 2 3 4 CO a nd CO 2 m ol e fra ct io n [-] Fuel [-] hp100 hp50bt50 bt100 φ= 5 CO CO2 CRECK mechanism Experiment
16
Figure 5. Effects of the addition of butanol on CO and CO2 at U0 = 10 cm/s and Tw,max = 1,100 K.
The results shown in Figs. 4 and 5 confirm that increasing the mole percentage of butanol decreases the concentrations of C2H4 and C2H2 and increase the concentrations of CO and CO2. This can be due to the fact that carbon plays an important role in CO and CO2 formations as opposed to C2H2 and C2H4 formation.
To further understand the influence of butanol addition on soot precursor, the behavior of larger hydrocarbons and PAHs species were measured. The reaction path analysis between small and large hydrocarbons, as well as PAHs species were also conducted.
Larger hydrocarbons and PAHs species measurement.
The capability of the CRECK mechanism vis-à-vis small hydrocarbons species measurements reported best among the employed mechanisms, as per the previous section. Therefore, the CRECK mechanism will be used for larger hydrocarbons and PAHs species measurements. Since the overall trend in the computation of the CRECK mechanism is similar in the case of all equivalence ratios, hence for large hydrocarbons and PAHs species measurement, only equivalence ratios of 1.5, 2.0, and 2.5 were conducted. (Hafidzal et al., 2018) stated that the lowest critical equivalence ratio for heptane is 2.0, showing the soot is started to appear in the MFR. Therefore, the measurement and computation was focused at ϕ = 2.0.
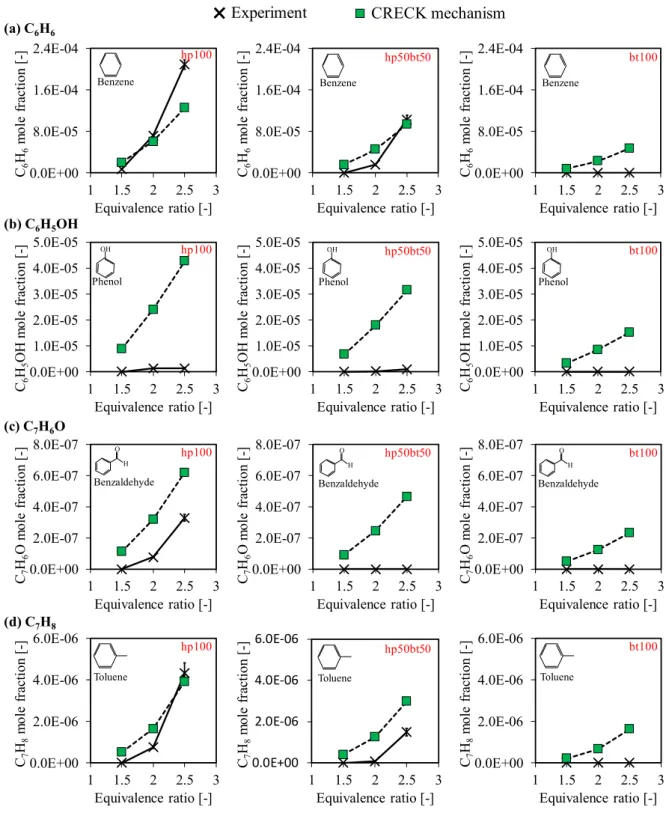
Figure 6 shows seven sampled gases measured in this study, which were C6H6, C6H5OH, C7H6O, C7H8, C8H10, C8H8, and C10H8. These measurements and computations were conducted at conditions similar to that of the measurements of small hydrocarbon species outlined in previous section. The conditions were set at U0 = 10 cm/s, P = 1 atm, and Tw,max = 1,100 K.
The mole fraction of all of the identified species were evident in hp100, while for hp50bt50, only C6H6, C6H5OH, and C7H8 were detected. However, in the case of bt100, none of the species were detected, since the signals were too weak. This indicates that the measured species’ concentration are inversely proportional to butanol’s mole percentages, which also confirms the capability of butanol as oxygenated fuel towards inhibiting the formation of PAHs. Furthermore, Hafidzal et al. (2018) reported no soot formation in the case of bt100 up to an equivalence ratio of 2.5, which coincide with the absence of the formation of aromatic hydrocarbons in this work.
17
Figure 6. Experimental and computational results of a) C6H6 b) C6H5OH c) C7H6O and d) C7H8 for hp100, hp50bt50, and bt100 at U0 = 10 cm/s, and Tw,max = 1,100 K by the CRECK mechanism. 0.0E+00 8.0E-05 1.6E-04 2.4E-04 1 1.5 2 2.5 3 C6 H6 mo le f ra ct io n [-] Equivalence ratio [-] 0.0E+00 8.0E-05 1.6E-04 2.4E-04 1 1.5 2 2.5 3 C6 H6 mo le f ra ct io n [-] Equivalence ratio [-] 0.0E+00 8.0E-05 1.6E-04 2.4E-04 1 1.5 2 2.5 3 C6 H6 mo le f ra ct io n [-] Equivalence ratio [-]
Benzene Benzene Benzene
0.0E+00 2.0E-06 4.0E-06 6.0E-06 1 1.5 2 2.5 3 C7 H8 mo le f ra ct io n [-] Equivalence ratio [-] 0.0E+00 2.0E-06 4.0E-06 6.0E-06 1 1.5 2 2.5 3 C7 H8 mo le f ra ct io n [-] Equivalence ratio [-] 0.0E+00 2.0E-06 4.0E-06 6.0E-06 1 1.5 2 2.5 3 C7 H8 mo le f ra ct io n [-] Equivalence ratio [-]
Toluene Toluene Toluene
0.0E+00 2.0E-07 4.0E-07 6.0E-07 8.0E-07 1 1.5 2 2.5 3 C7 H6 O m ole fr acti on [ -] Equivalence ratio [-] 0.0E+00 2.0E-07 4.0E-07 6.0E-07 8.0E-07 1 1.5 2 2.5 3 C7 H6 O m ole fr acti on [ -] Equivalence ratio [-] 0.0E+00 2.0E-07 4.0E-07 6.0E-07 8.0E-07 1 1.5 2 2.5 3 C7 H6 O m ole fr acti on [ -] Equivalence ratio [-] H O Benzaldehyde H O Benzaldehyde H O Benzaldehyde (a) C6H6 hp100 hp50bt50 bt100 0.0E+00 1.0E-05 2.0E-05 3.0E-05 4.0E-05 5.0E-05 1 1.5 2 2.5 3 C6 H5 OH m ol e fr ac ti on [ -] Equivalence ratio [-] 0.0E+00 1.0E-05 2.0E-05 3.0E-05 4.0E-05 5.0E-05 1 1.5 2 2.5 3 C6 H5 OH m ol e fr ac ti on [ -] Equivalence ratio [-] 0.0E+00 1.0E-05 2.0E-05 3.0E-05 4.0E-05 5.0E-05 1 1.5 2 2.5 3 C6 H5 OH m ol e fr ac ti on [ -] Equivalence ratio [-] OH Phenol OH Phenol OH Phenol hp100 hp50bt50 bt100 (b) C6H5OH (c) C7H6O hp100 hp50bt50 bt100 (d) C7H8 hp100 hp50bt50 bt100
18
(Continued from Figure 6) Experimental and computational results of e) C8H10 f) C8H8 and g)
C10H8 for hp100, hp50bt50, and bt100 at U0 = 10 cm/s and Tw,max = 1,100 K by the CRECK mechanism.
As can be seen from the measured species, C6H6 is the smallest PAHs group measured in this study. It reported the highest concentration relative to other species, which implies that C6H6 is a dominant species in the formation of PAHs. Golea et al. (2012) also pointed out that benzene is the first aromatic ring that is closely related to soot formation process. Here, C6H6 reported excellent prediction at ϕ = 1.5 and 2.0, however, at ϕ = 2.5, there were some discrepancies observed.
The large discrepancy between computational and measurement values were evident in the case of C6H5OH and C7H6O. However, fair agreements were reported in the case of C7H8, C8H10, C8H8, and C10H8, especially at ϕ = 1.5 and 2.0. It should also be pointed out that larger PAHs species, such as phenanthrene (C14H10) and pyrene (C16H10), which have three and four aromatic rings, respectively, were not observed in this work. The highest PAHs group measured
0.0E+00 2.0E-07 4.0E-07 6.0E-07 8.0E-07 1 1.5 2 2.5 3 C8 H10 mo le f ra ct io n [-] Equivalence ratio [-] 0.0E+00 2.0E-07 4.0E-07 6.0E-07 8.0E-07 1 1.5 2 2.5 3 C8 H10 mo le f ra ct io n [-] Equivalence ratio [-] 0.0E+00 2.0E-07 4.0E-07 6.0E-07 8.0E-07 1 1.5 2 2.5 3 C8 H10 mo le f ra ct io n [-] Equivalence ratio [-]
Ethylbenzene Ethylbenzene Ethylbenzene
0.0E+00 1.0E-06 2.0E-06 3.0E-06 4.0E-06 5.0E-06 1 1.5 2 2.5 3 C8 H8 m ole f ra ctio n [-] Equivalence ratio [-] 0.0E+00 1.0E-06 2.0E-06 3.0E-06 4.0E-06 5.0E-06 1 1.5 2 2.5 3 C8 H8 m ole f ra ctio n [-] Equivalence ratio [-] 0.0E+00 1.0E-06 2.0E-06 3.0E-06 4.0E-06 5.0E-06 1 1.5 2 2.5 3 C8 H8 m ole f ra ctio n [-] Equivalence ratio [-]
Styrene Styrene Styrene
0.0E+00 2.0E-07 4.0E-07 6.0E-07 8.0E-07 1.0E-06 1.2E-06 1 1.5 2 2.5 3 C10 H8 m ole f ra ctio n [-] Equivalence ratio [-] 0.0E+00 2.0E-07 4.0E-07 6.0E-07 8.0E-07 1.0E-06 1.2E-06 1 1.5 2 2.5 3 C10 H8 m ole f ra ctio n [-] Equivalence ratio [-] 0.0E+00 2.0E-07 4.0E-07 6.0E-07 8.0E-07 1.0E-06 1.2E-06 1 1.5 2 2.5 3 C10 H8 m ole f ra ctio n [-] Equivalence ratio [-]
Naphthalene Naphthalene Naphthalene
hp100 hp50bt50 bt100 (f) C8H8 hp100 hp50bt50 bt100 (g) C10H8 hp100 hp50bt50 bt100 (e) C8H10
19
in this work was napthalene, which is a well-known second ring aromatic. Overall, all of the computed species from the CRECK mechanism in the case of all fuels reported trends mirroring that of the measurement species’, where the mole fraction is directly proportional to the equivalence ratios.
Effect of butanol addition on PAHs species
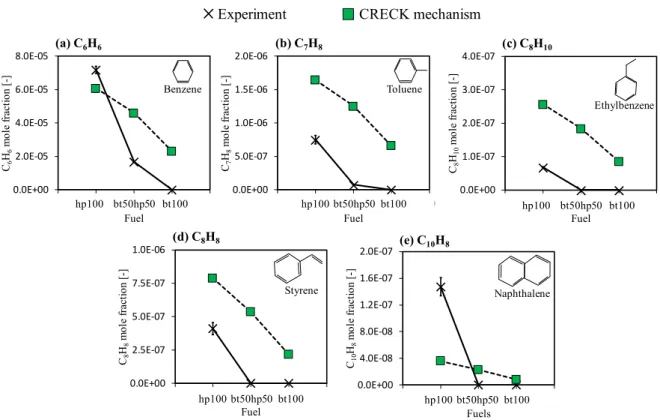
The results reported in the previous section confirms the necessity of determining the effects of the addition of butanol onto larger hydrocarbons and PAHs species (C6H6, C7H8, C8H10, C8H8, and C10H8). In order to do this, ϕ = 2.0 was selected, due to it reporting the lowest critical equivalence ratio for hp100 (Hafidzal et al., 2018). Species measurement of PAHs is highlighted in this work due to the fact that they are established soot particles precursors (Haynes and Wagner, 1981), and contribute towards increasing soot mass (Mckinnon and Howard, 1992). Figure 7 shows the computations using the CRECK mechanism and experiments in the fuel dependence of PAHs mole fractions species (C6H6, C7H8, C8H10, C8H8, and C10H8) to determine the effect of the addition of butanol.
Figure 7. Effects of butanol addition on (a) C6H6 (b) C7H8 (c) C8H10 (d) C8H8, and (e) C10H8) at U0 = 10 cm/s, and Tw,max = 1,100 K.
The computational results in the case of hp100 show that C6H6 has a higher mole fraction relative to other species in the case of all fuels, which is similar to that of the experimental results. The computational results of the measured PAHs species reported a poor
0.0E+00 2.0E-05 4.0E-05 6.0E-05 8.0E-05 0 10 20 30 40 C6 H6 m ol e fract io n [-] Fuel (a) C6H6 Benzene hp100 bt50hp50 bt100 0.0E+00 5.0E-07 1.0E-06 1.5E-06 2.0E-06 0 10 20 30 40 C7 H8 m ol e fract io n [-] Fuel (b) C7H8 hp100 bt50hp50 bt100 Toluene 0.0E+00 1.0E-07 2.0E-07 3.0E-07 4.0E-07 0 10 20 30 40 C8 H10 m ol e fract io n [-] Fuel (c) C8H10 Ethylbenzene hp100 bt50hp50 bt100
Experiment CRECK mechanism
0.0E+00 2.5E-07 5.0E-07 7.5E-07 1.0E-06 0 10 20 30 40 C8 H8 m ol e fract io n [-] Fuel (d) C8H8 hp100 bt50hp50 bt100 Styrene 0.0E+00 4.0E-08 8.0E-08 1.2E-07 1.6E-07 2.0E-07 0 10 20 30 40 C10 H8 m ol e fract io n [-] Fuels (e) C10H8 Naphthalene hp100 bt50hp50 bt100
20
prediction, however, the trend of all computed species is similar to that of the experimental results’ when butanol is added. The mole fraction of all of the species are inversely proportional to the mole percentage of butanol.
Comparison between measured species of hp50bt50 and hp50bt0.
To determine if the differences in the measured aromatic hydrocarbons of hp100, hp50bt50, and bt100 are caused by the addition of n-butanol or the reduction of n-heptane, an additional mixture condition, hp50bt0, was considered at ϕ = 2.0. The mole fraction of n-heptane in hp50bt0 was similar to that of hp50bt0, with the mole fraction of n-butanol in hp50bt0 replaced with that of nitrogen. Figure 8 shows the comparison of the measured species’ (C6H6, C6H5OH, C7H6O, C7H8, C8H10, and C8H8) concentrations in the case of hp50bt50 and hp50bt0. If the reduction of aromatic hydrocarbons is controlled by the reduction of n-heptane in mixtures, both conditions must report identical mole fractions of aromatic hydrocarbons. However, overall, it is evident that all PAHs species concentrations by n-heptane diluted with N2 exceeded that of hp50bt50, especially for C8H10 and C8H8. No concentration was reported for C8H10 and C8H8, since their respective signals were too weak.
Figure 8. Comparison between hp50bt50 and hp50bt0 for larger hydrocarbons and PAHs species for all fuels (U0 = 10 cm/s, ϕ = 2.0 and Tw,max = 1,100 K).
21
hp50bt50 and hp50bt0. Therefore, figure of C10H8 is not shown here. The comparison show the effect of chemical reaction due to the addition of butanol, which is not caused by the decrease of the mole fraction of n-heptane. In order to further understand the chemical reaction of the addition of butanol, the reaction path analysis and rate of production/consumption of the measured species were conducted.
Reaction path analysis
The reaction path analysis by the CRECK mechanism was performed for hp100 and hp50bt50 to identify the main reaction of the reduction of the measured species. The reaction path for bt100 is not presented here, since the reaction is similar to that of hp50bt50.
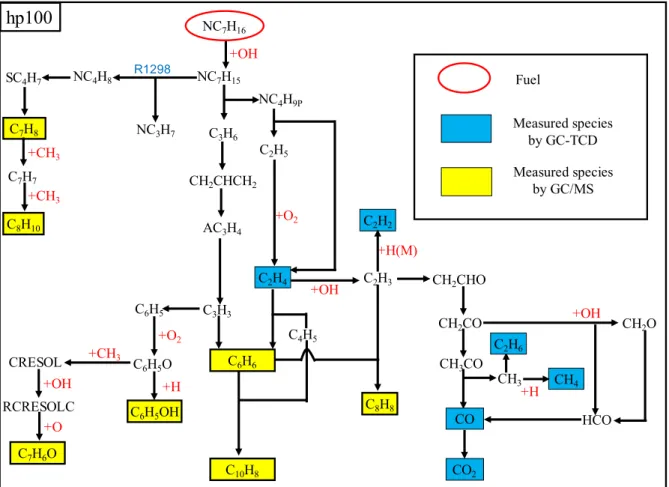
Figs. 9 and 10 show a reaction path diagram for hp100 and hp50bt50 at ϕ = 2.0, U0 = 10 cm/s, and Tw,max = 1,100 K by the CRECK mechanism. The fuels (NC7H16 and N1C4H9OH) are represented by a red ellipse, while the small hydrocarbons (C2H4, C2H2, C2H6, CH4, CO, and CO2) are represented by blue boxes, and the large hydrocarbons and PAHs species (C6H6, C6H5OH, C7H6O, C7H8, C8H10, C8H8, and C10H8)are shown in yellow boxes. The reaction number in the CRECK mechanism are represented by the R numbers. The summary of this reaction path analysis is as follows: starting from the decomposition of the NC7H16 by H abstraction via OH, which results in NC7H15. After the decomposition of fuel and NC7H15, the formations of C3H6 and NC4H9p take place, where C3H6 is one of the stabilized small hydrocarbons species leading to the production of small aromatic and PAHs species (Westbrook et al., 2006).
In this reaction path, three main pathways for the measured species can be seen. The first is the formation of C7H8 and C8H10 via NC4H8. The formation of NC4H8 is important, since it affects the concentration of C7H8 and C8H10. Next is the formations of C6H6, C10H8, C8H8, and C2H2 via C2H4 and C3H3, which imply that the formation of PAHs is linked to C2H4 and C3H3. It is also known that C2H4 is a soot precursor (Ruiz et al., 2007), while C3H3 is important towards the formation of C6H6 (Richter and Howard, 2000). The formation of C2H4 is derived from the formation of NC4H9p via C2H5. This means that the formation of C2H5 is crucial towards the formation of higher PAHs species. Third is the formation of C7H6O and C6H5OH via C3H3. The formation of C3H3 is divided into the formation of larger hydrocarbons (C7H6O and C6H5OH) and PAHs species (C6H6, C10H8 and C8H8).
22
Figure 9. Main reaction pathway analysis for hp100 at U0 = 10 cm/s, ϕ = 2.0, and Tw,max = 1,100 K.
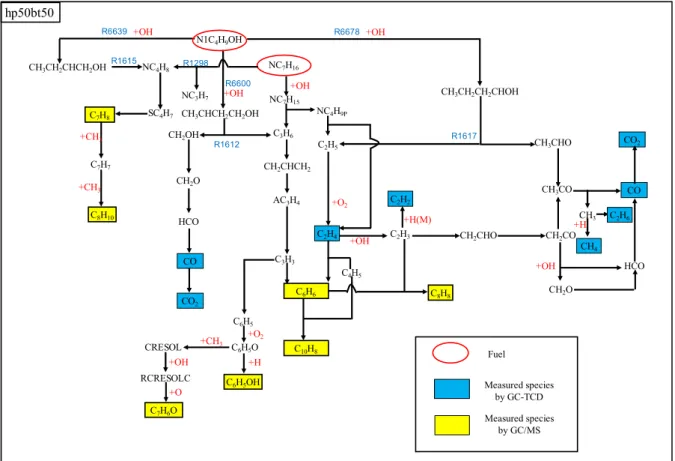
The reaction pathway for the addition of butanol is shown in Fig. 10. It shows a significant difference in the reaction pathway compared to hp100. However, in the case of hp50bt50, NC7H16 still produces NC7H15, similar to hp100. This implies that reactions occurring in hp100 also occurs in hp50bt50, as per Fig. 9. The addition of butanol changes the reaction pathway in R6600, R6639, and R6678 to form CH3CHCH2CH2OH, CH3CH2CHCH2OH, and CH3CH2CH2CHOH, with H abstraction via OH. These hydroxybutyl radicals contributed to the reduction of the measured species.
For example, the formation of CH3CHCH2CH2OH in R6600 is followed by R1612, showing the formation of C3H6 and CH2OH. The formation of C3H6 is also influenced by R1297 from NC7H15, while the formation of CH2OH led to the formation of CO2, which has a strong carbon atom bond, preventing them from taking part in the formation of soot. On the other hand, C3H6 formation leads to the formation of C3H3, which control the concentrations of C6H6, C10H8, C8H8, C7H6O, and C6H5OH. C6H6 C3H3 C4H5 C2H4 C2H3 C2H2 AC3H4 C3H6 NC7H15 NC7H16 NC4H9P C2H5 C10H8 CO2 CH2CHCH2 hp100 C7H8 SC4H7 NC4H8 R1298 NC3H7 C6H5OH C6H5O C7H6O C8H10 C7H7 C6H5 C8H8 +H +O2 +CH3 +CH3 +O2 +OH +H(M) +OH CH2CHO CH2CO CH3CO CO CH2O HCO +OH +H CH3 CH4 Fuel Measured species by GC-TCD Measured species by GC/MS RCRESOLC CRESOL +O +OH +CH3 C2H6
23
Figure 10. Main reaction pathway analysis for hp50bt50 at U0 = 10 cm/s, ϕ = 2.0, and Tw,max =
1100 K.
Another formation of hydroxybutyl radicals, such as CH3CH2CHCH2OH in R6639, promotes R1615 for the formation of NC4H8, which is possible from NC7H15 in R1298. The formation of NC4H8 via both reactions reduced the concentrations of C7H8 and C8H10. The product of R6678, which is CH3CH2CH2CHOH, is among the prominent reaction that reduces the concentration of the PAHs species. It is evident that CH3CHO and C2H5 are produced from CH3CH2CH2CHOH in R1617. This reaction is important, because it takes place when butanol is added to the mixture, and determines whether PAHs or CO2 will be formed. CH3CHO reported a similar final direction to that of CH2OH. Both CH3CHO and CH2OH resulted in the production of CO2, which is consistent with the increase of CO2 due to the addition of butanol. On the other hand, C2H5 leads to the formation of C2H4, and finally reductions of C6H6, C10H8, and C8H8.
Rates of production/consumption
In order to interpret the experimental results in the context of reduction of the concentration of hydrocarbon and PAHs, the total rates of production/consumption and the three major production/consumption reactions for hp100, hp50bt50, and bt100 at ϕ = 2.0,and
Tw,max = 1,100 K were analyzed using the CRECK mechanism. The three main species
CH3CH2CHCH2OH C6H6 C3H3 C4H5 C2H4 C2H3 C2H2 AC3H4 CH2CHCH2 C3H6 NC7H15 NC7H16 NC4H9P C2H5 CH3CHCH2CH2OH R1612 CH2OH CH3CH2CH2CHOH R1617 C10H8 CH3CHO N1C4H9OH hp50bt50 C7H8 SC4H7 NC4H8 R1615 R1298 NC3H7 R6639 R6600 R6678 C8H10 C7H7 C8H8 +CH3 +CH3 +OH +O2 +OH +H(M) C6H5OH C6H5O C6H5 +H +O2 +OH +OH +OH CH2O HCO CO CO2 CO2 CH2CHO CH2CO CH3CO CO CH2O +HCH3 CH4 HCO +OH Fuel Measured species by GC-TCD Measured species by GC/MS C7H6O RCRESOLC CRESOL +O +OH +CH3 C2H6
24
encompassing soot precursor formation are primary hydrocarbon, intermediate, and largest PAHs species selected were C2H4, C6H6, and C10H8, as shown in the main reaction pathway in Figs. 9 and 10. These species are the continuity formation from C2H4 to C6H6, leading to the formation of C10H8.
Figs. 11(a), 12(a), and 13(a) indicate the total rate of production/consumption (positive values imply production, while negative values imply consumption) of C2H4, C6H6, and C10H8.
Figure 11. (a) Total rate of C2H4 production/consumption (b) Major reactions of C2H4 production/consumption for all fuels at U0 = 10 cm/s, ϕ = 2.0 and Tw,max = 1,100 K.
25
while the major reactions contributing to the net of production/consumption are shown in Figs. 11(b), 12(b), and 13(b). Overall, the trend of C2H4, C6H6, and C10H8 species for total production and consumption are similar. It can be seen that the production and consumption of the computed species are inversely proportional to the mole percentage(s) of butanol. These trends are also reported by the experimental results shown in Figs. 4 and 8.
As per Fig. 11, in the case of the formation of C2H4 in hp100, it can be seen that from all of the fuels, most of the production rate comes from R223: O2+C2H5=>HO2+C2H4, while the second main reaction is R757: NC4H9P<=>C2H5+C2H4, followed by R95: NC3H7<=>CH3+C2H4. However, when butanol was added, the reaction of R757 decreases.
The position of the second dominance was replaced by R95. This means that the addition of butanol improves the formation of NC3H7. In the case of bt100, R757 is absent, due
to the fact that no NC4H9p is included in the fuel. Also, R1610
CH2CH2CH2CH2OH<=>C2H4+C2H4OH of production took place in the top three of the C2H4 production rate. On the other hand, in the case of consumption reactions, R391: OH+C2H4<=>H2O+C2H3 is dominant in the case of all of the fuels. A large discrepancy was reported between R391 and other consumption reactions (R304 and R185), confirming that R391 plays an important role in the concentration of C2H4 when mixed with butanol.
Figure 12 shows that the total rate of C6H6 production is due to R473: 2C3H3(+M)<=>C6H6(+M), R494: C4H5+C2H4=>C6H6+H+H2, and R488: CH2CHCH2+PC3H4=>C6H6+H2+H. It can also be seen that the self-reaction of C3H3 and soot precursor of C2H4 reaction strongly contribute to the formation of C6H6.
From the previous results shown in Fig. 6, the experimental and computational results for all of the fuels confirmed that the mole fraction of C6H6 exceeds that of other PAHs species. The higher concentration of C6H6 could be due to the domination pathway of R473, since it has larger peak area relative to R494 and R488. This supposition is supported by Richter and Howard, (2000), where C3H3 is reported to play an important role in the formation of benzene. According to the reaction path analysis shown in Figs. 10 and 11, the formation of C6H6 from C2H4 and C3H3 is the continuation product of NC7H15. The decomposition of NC7H15 contributes to the formation of C3H6 and NC4H9p, therefore, the formation of C2H4 from R494 and C3H3 from R473 are important vis-à-vis the formation of C6H6.
26
Figure 12. (a) Total rate of C6H6 production/consumption (b) Major reactions of C6H6 production/consumption for all fuels at U0 = 10 cm/s, ϕ = 2.0, and Tw,max = 1,100 K.
The largest PAHs in this study, which is C10H8, is mostly formed by the smallest PAHs species, which is C6H6. This is shown by R500: C4H5+C6H6=>C10H8+H2+H, and continued by R986: H+C10H7OH=>C10H8+OH and R1034: C3H3+C7H7=>C10H8+2H. The trend of these reactions is similar in the case of all of the fuels (hp100, hp50bt50, and bt100). However, it is inversely proportional to butanol’s mole percentage.
27
Figure 13. (a) Total rate of C10H8 production/consumption (b) Major reactions of C10H8
production/consumption for all fuels at U0 = 10 cm/s, ϕ = 2.0, and Tw,max = 1,100 K. Conclusions
Studies of n-heptane and n-butanol blends on small and large hydrocarbons, as well as PAHs species were performed in a micro flow reactor with a controlled temperature profile. Small hydrocarbons species were measured using a GC, and the prediction of some mechanisms at higher equivalence ratios (2.0 - 5.0), U0 = 10 cm/s, and Tw,max = 1,100 K were made. Six species (C2H4, C2H2, C2H6, CH4, CO, and CO2) were identified at the exit of the tube in the case of all of the fuels. The trends were divided into two groups, where the first consists of species that increases alongside increasing equivalence ratio, which are C2H4, C2H2, C2H6,
28
CH4, and CO, while the second group is made up of species that decreases alongside the equivalence ratio, which is CO2. The computational results derived from the CRECK mechanism reported satisfactory agreement with that of the measurement species.
The effects of the addition of butanol on C2H2 and C2H4, as well as CO and CO2 at ϕ = 2.0, 3.0, 4.0, and 5.0 were investigated by comparing the CRECK mechanism results with that of the measurements. The comparison confirmed excellent agreement in the case of all species, especially in the case of C2H2 and CO2. In the case of the computation of C2H4, the prediction by the CRECK mechanism gradually improves alongside increasing equivalence ratio. Although CO displayed some discrepancies, its trends were observed to be similar to that of the measurements, especially at higher equivalence ratios. Overall, the computation and experimental results show that the C2H2 and C2H4 mole fractions decreased, while CO and CO2 increased due to the addition of butanol.
Measurements of larger hydrocarbons and PAHs species (C6H6,C6H5OH, C7H6O, C7H8, C8H10, C8H8, and C10H8) were conducted using GC/MS at similar conditions to that of the small hydrocarbons’ measurement. The effect of the addition of n-butanol on the formation of PAHs was also elucidated. Both the computation and measurement results confirmed that the concentration of PAHs species are inversely proportional to the mole percentage(s) of butanol.
The effect of the addition of butanol was also validated after comparison with the measured species’ concentration of hp50bt50 and hp50bt0. The mole fraction of n-heptane in hp50bt0 was similar to that of hp50bt0, with the mole fraction of n-butanol in hp50bt0 replaced with that of nitrogen. The results confirmed that the measured species’ concentration of hp50bt50 is lower than that of hp50bt0.
The reaction path analysis was analyzed using the CRECK mechanism. During the addition of butanol, the results confirmed the occurrence of three hydroxybutyl radicals reactions, which are crucial towards the reduction of the PAHs species. These reactions are R1612: CH3CHCH2CH2OH<=>C3H6+CH2OH, R1615: CH3CH2CHCH2OH<=>NC4H8+OH, and R1617: CH3CH2CH2CHOH<=>CH3CHO+C2H5.
The effect of the addition of butanol to the rate of production/consumption for the three main species encompassing soot precursor formation are the primary (C2H4) and intermediate (C6H6) hydrocarbons, and the largest PAHs species (C10H8) were investigated. The reduction of C2H4 is attributed to the production reaction from R95: NC3H7<=>CH3+C2H4 and the consumption reaction from R391: OH+C2H4<=>H2O+C2H3. In the case of the smallest PAHs species, which is C6H6, self-reaction by R473: 2C3H3(+M)<=>C6H6(+M) was identified as the
29
dominant reaction relative to other reactions. The formation of C6H6 affected the formation of C10H8 via the reaction R500: C4H5+C6H6=>C10H8+H2+H.
Acknowledgements
This study was partly supported by JSPS KAKENHI Grant number JP16H06068. The author MHBMH would like to express his gratitude and acknowledgement to the Faculty of Mechanical Engineering, Universiti Teknikal Malaysia Melaka, Malaysia (UTeM).
References
Akih-kumgeh, B. and Bergthorson, J.M., 2010. Comparative study of methyl butanoate and n-heptane high temperature autoignition. Energy & Fuels, 24, 2439–2448.
Alexandrino, K., Salvo, P., Millera, Á., Bilbao, R., and Alzueta, M.U., 2016. Influence of the temperature and 2, 5-dimethylfuran concentration on its sooting tendency. Combust. Sci.
Technol., 188 (4-5), 651–666.
Andreae, M.O. 2001. The dark side of aerosols. Nature, 409, 671–672.
Barfknecht, T.R., 1983. Toxicology of soot. Prog. Energy Combust. Sci, 9, 199–237.
Black, G., Curran, H.J., Pichon, S., Simmie, J.M., and Zhukov, V., 2010. Bio-butanol: Combustion properties and detailed chemical kinetic model. Combust. Flame., 157 (2), 363–373.
Bond, T.C., Doherty, S.J., Fahey, D.W., Forster, P.M., Berntsen, T., Deangelo, B.J., Flanner, M.G., Ghan, S., Kärcher, B., Koch, D., Kinne, S., Kondo, Y., Quinn, P.K., Sarofim, M.C., Schultz, M.G., Schulz, M., Venkataraman, C., Zhang, H., Zhang, S., Bellouin, N., Guttikunda, S.K., Hopke, P.K., Jacobson, M.Z., Kaiser, J.W., Klimont, Z., Lohmann, U., Schwarz, J.P., Shindell, D., Storelvmo, T., Warren, S.G., and Zender, C.S., 2013. Bounding the role of black carbon in the climate system: A scientific assessment. J
Geophys Res Atmos, 118 (11), 5380–5552.
Braun-unkhoff, M., Hansen, N., Methling, T., Moshammer, K., and Yang, B., 2017. The influence of i -butanol addition to the chemistry of premixed 1, 3-butadiene flames. Proc.
Combust. Inst., 36 (1), 1311–1319.
Cai, J., Zhang, L., Zhang, F., Wang, Z., Cheng, Z., Yuan, W., and Qi, F., 2012. Experimental and kinetic modeling study of n-butanol pyrolysis and combustion. Energy & Fuels, 26, 5550–5568.
30
Chen, B., Liu, X., Liu, H., Wang, H., Kyritsis, D.C., and Yao, M., 2017. Soot reduction effects of the addition of four butanol isomers on partially premixed flames of diesel surrogates.
Combust. Flame., 177, 123–136.
Curran, H.J., Gaffuri, P., Pitz, W.J., and Westbrook, C.K., 1998. A comprehensive modeling study of n-heptane oxidation. Combust. Flame., 114 (1), 147–177.
Dagaut, P., Sarathy, S.M., and Thomson, M.J., 2009. A chemical kinetic study of n-butanol oxidation at elevated pressure in a jet stirred reactor. Proc. Combust. Inst., 32 (1), 229– 237.
Davidson, D.F., Hong, Z., Pilla, G.L., Farooq, A., Cook, R.D., and Hanson, R.K., 2010. Multi-species time-history measurements during n-heptane oxidation behind reflected shock waves. Combust. Flame., 157 (10), 1899–1905.
Davidson, D.F., Oehlschlaeger, M.A., and Hanson, R.K., 2007. Methyl concentration time-histories during iso-octane and n-heptane oxidation and pyrolysis. Proc. Combust. Inst., 31, 321–328.
Dubey, A.K., Tezuka, T., Hasegawa, S., Nakamura, H., and Maruta, K., 2016. Study on sooting behavior of premixed C1–C4 n-alkanes/air flames using a micro flow reactor with a controlled temperature profile. Combust. Flame., 174, 100–110.
Esarte, C., Abián, M., Millera, Á., Bilbao, R., and Alzueta, M.U., 2012. Gas and soot products formed in the pyrolysis of acetylene mixed with methanol, ethanol, isopropanol or n-butanol. Energy, 43, 37–46.
Frassoldati, A., Cuoci, A., Faravelli, T., and Ranzi, E., 2010. Kinetic modeling of the oxidation of ethanol and gasoline surrogate mixtures. Combust. Sci. Technol., 182 (4-6), 653–667. Frassoldati, A., Grana, R., Faravelli, T., Ranzi, E., Oßwald, P., and Kohse-Höinghaus, K., 2012.
Detailed kinetic modeling of the combustion of the four butanol isomers in premixed low-pressure flames. Combust. Flame., 159 (7), 2295–2311.
Ghiassi, H., Toth, P., and Lighty, J.S., 2014. Sooting behaviors of n-butanol and n-dodecane blends. Combust. Flame., 161 (3), 671–679.
Glassman, I., 1988. Soot formation in combustion processes. Symp Combust, 22 (1), 295–311. Golea, D., Rezgui, Y., Guemini, M., and Hamdane, S., 2012. Reduction of PAH and soot
precursors in benzene flames by addition of ethanol. J Phys Chem A, 116, 3625–3642. Grana, R., Frassoldati, A., Faravelli, T., Niemann, U., Ranzi, E., Seiser, R., Cattolica, R., and
Seshadri, K., 2010. An experimental and kinetic modeling study of combustion of isomers of butanol. Combust. Flame., 157 (11), 2137–2154.
31
Green, D.A. and Lewis, R., 2007. Effect of soot on oil properties and wear of engine components. J Phys D Appl Phys, 40, 5488–5501.
Hafidzal, M., Nakamura, H., Hasegawa, S., Tezuka, T., and Maruta, K., 2018. Effects of n-butanol addition on sooting tendency and formation of C1-C2 primary intermediates of n-heptane/air mixture in a micro flow reactor with a controlled temperature profile. Combust.
Sci. Technol., 1–16.
Hakka, H.M., Cracknell, R.F., Pekalski, A., Glaude, P., and Battin-leclerc, F., 2015. Experimental and modeling study of ultra-rich oxidation of n-heptane. Fuel, 144, 358– 368.
Hansen, N., Merchant, S.S., Harper, M.R., and Green, W.H., 2013. The predictive capability of an automatically generated combustion chemistry mechanism: Chemical structures of premixed iso-butanol flames. Combust. Flame.,160 (11), 2343–2351.
Haynes, B.S. and Wagner, H.G., 1981. Soot formation. Prog Energy Combust Sci, 7, 229–273. He, B.-Q., Liu, M.-B., Yuan, J., and Zhao, H., 2013. Combustion and emission characteristics
of a HCCI engine fuelled with n-butanol–gasoline blends. Fuel, 108, 668–674.
Herbinet, O., Husson, B., Serinyel, Z., Cord, M., Warth, V., Fournet, R., Glaude, P., Sirjean, B., and Battin-leclerc, F., 2012. Experimental and modeling investigation of the low-temperature oxidation of n-heptane. Combust. Flame., 159 (12), 3455–3471.
Hori, M., Yamamoto, A., Nakamura, H., Tezuka, T., Hasegawa, S., and Maruta, K. 2012. Study on octane number dependence of PRF/air weak flames at 1-5 atm in a micro flow reactor with a controlled temperature profile. Combust. Flame., 159, 959–967.
Hori, M., Nakamura, H., Tezuka, T., Hasegawa, S., and Maruta, K., 2013. Characteristics of n-heptane and toluene weak flames in a micro flow reactor with a controlled temperature profile. Proc. Combust. Inst., 34 (2), 3419–3426.
Ingemarsson, T., Pedersen, R., and Olsson, J.O., 1999. Oxidation of n-heptane in a premixed laminar flame. J Phys Chem A, 103, 8222–8230.
Jin, C., Yao, M., Liu, H., Lee, C.F., and Ji, J., 2011. Progress in the production and application of n-butanol as a biofuel. Renew Sustain Energy Rev, 15 (8), 4080–4106.
Kamada, T., Nakamura, H., Tezuka, T., Hasegawa, S., and Maruta, K., 2014. Study on combustion and ignition characteristics of natural gas components in a micro flow reactor with a controlled temperature profile. Combust. Flame.,161, 37–48.
Kikui, S., Kamada, T., Nakamura, H., Tezuka, T., Hasegawa, S., and Maruta, K., 2015. Characteristics of n-butane weak flames at elevated pressures in a micro flow reactor with a controlled temperature profile. Proc. Combust. Inst., 35 (3), 3405–3412.
32
Kizaki, Y., Nakamura, H., Tezuka, T., Hasegawa, S., and Maruta, K., 2015. Effect of radical quenching on CH4/air flames in a micro flow reactor with a controlled temperature profile.
Proc. Combust. Inst., 35 (3), 3389–3396.
Lefkowitz, J.K., Heyne, J.K., Won, S.H., Dooley, S., Kim, H.H., Haas, F.M, Jahangirian, S., Dryer, F.L., Ju, Y., 2012. A chemical kinetic study of tertiary-butanol in a flow reactor and a counterflow diffusion flame, Combust. Flame., 159, 968–978.
Li, Y., Yuan, W., Li, T., Li, W., Yang, J., and Qi, F., 2018. Experimental and kinetic modeling investigation of rich premixed toluene flames doped with n-butanol. Phys Chem Chem
Phys, 28, 10628–10636.
Liu, H., Huo, M., Liu, Y., Wang, X., Wang, H., Li, Z., Yao, M., and Lee, C.F., 2014. Time-resolved spray, flame, soot quantitative measurement fueling n-butanol and soybean biodiesel in a constant volume chamber under various ambient temperatures, Fuel., 133, 317–325.
Liu, H., Zhang, P., Liu, X., Chen, B., Geng, C., Li, B., Wang, H., Li, Z., and Yao, M., 2018. Laser diagnostics and chemical kinetic analysis of PAHs and soot in co-flow partially premixed flames using diesel surrogate and oxygenated additives of n -butanol and DMF,
Combust. Flame., 188, 129–141.
Loparo, Z.E., Lopez, J.G., Neupane, S., Partridge, W.P., Vodopyanov, K., and Vasu, S.S., 2017. Fuel-rich n-heptane oxidation: A shock tube and laser absorption study, Combust. Flame., 185, 220–233.
Mahmood, W.M.F.W., 2011. Computational studies of soot paths to cylinder wall layers of a direct injection diesel engine.
Maruta, K., Kataoka, T., Kim, N. Il, Minaev, S., and Fursenko, R., 2005. Characteristics of combustion in a narrow channel with a temperature gradient. Proc. Combust. Inst., 30 (2), 2429–2436.
Mckinnon, J.T. and Howard, J.B., 1992. The roles of PAH and acetylene in soot nucleation and growth. Symp Combust, 24 (1), 965–971.
Mehl, M., Pitz, W.J., Westbrook, C.K., and Curran, H.J., 2011. Kinetic modeling of gasoline surrogate components and mixtures under engine conditions. Proc. Combust. Inst., 33 (1), 193–200.
Merola, S., Tornatore, C., Marchitto, L., Valentino, G., and Corcione, F.E., 2012. Experimental investigations of butanol-gasoline blends effects on the combustion process in a SI engine.
33
Miyoshi, A. 2011. Systematic computational study on the unimolecular reactions of alkylperoxy (RO2), hydroperoxyalkyl (QOOH), and hydroperoxyalkylperoxy (O2QOOH) radicals. J. Phys. Chem A., 115, 3301–3325.
Nakamura, H., Suzuki, S., Tezuka, T., Hasegawa, S., and Maruta, K., 2015. Sooting limits and PAH formation of n-hexadecane and 2,2,4,4,6,8,8-heptamethylnonane in a micro flow reactor with a controlled temperature profile. Proc. Combust. Inst., 35 (3), 3397–3404. Nakamura, H., Takahashi, H., Tezuka, T., Hasegawa, S., Maruta, K., and Abe, K., 2016. Effects
of CO-to-H2 ratio and diluents on ignition properties of syngas examined by weak flames in a micro flow reactor with a controlled temperature profile. Combust. Flame., 172, 94– 104.
Nakamura, H., Tanimoto, R., Tezuka, T., Hasegawa, S., and Maruta, K., 2014. Soot formation characteristics and PAH formation process in a micro flow reactor with a controlled temperature profile. Combust. Flame., 161 (2), 582–591.
Nielsen, T., Jsrgensen, H.E., Larsenb, J.C., and Poulsenb, M., 1996. City air pollution of polycyclic aromatic hydrocarbons and other mutagens: occurrence, sources and health effects. Sci Total Environ, 189/190, 41–49.
Oshibe, H., Nakamura, H., Tezuka, T., Hasegawa, S., and Maruta, K., 2010. Stabilized three-stage oxidation of DME/air mixture in a micro flow reactor with a controlled temperature profile. Combust. Flame., 157 (8), 1572–1580.
Oßwald, P., Güldenberg, H., Kohse-höinghaus, K., Yang, B., Yuan, T., and Qi, F., 2011. Combustion of butanol isomers–A detailed molecular beam mass spectrometry investigation of their flame chemistry. Combust. Flame., 158, 2–15.
Rakopoulos, D.C., Rakopoulos, C.D., Giakoumis, E.G., Dimaratos, A.M., and Kyritsis, D.C., 2010. Effects of butanol–diesel fuel blends on the performance and emissions of a high-speed DI diesel engine. Energy Convers. Manag., 51 (10), 1989–1997.
Randall, L.V.W., Kirk, A.J., and Mun, Y.C., 1997. Simultaneous laser-induced emission of soot and polycyclic aromatic hydrocarbons within a gas-jet diffusion flame. Combust.
Flame., 109 (3), 399–414.
Richter, H. and Howard, J.B., 2000. Formation of polycyclic aromatic hydrocarbons and their growth to soot–a review of chemical reaction pathways. Prog Energy Combust Sci, 26 (4-6), 565–608.
Ruiz, M.P., Callejas, A., Millera, A., Alzueta, M.U., and Bilbao, R., 2007. Soot formation from C2H2 and C2H4 pyrolysis at different temperatures. J. Anal. Appl. Pyrolysis., 79 (1-2), 244–251.
34
Russo, C., D'Anna, A., Ciajolo, A., and Sirignano, M., 2019. The effect of butanol isomers on the formation of carbon particulate matter in fuel-rich premixed ethylene flames. Combust.
Flame., 199, 122–130.
Saiki, Y., and Suzuki, Y. 2013. Effect of wall surface reaction on a methane-air premixed flame in narrow channels with different wall materials. Proc. Combust. Inst., 34, 3395–3402. Sarathy, S.M., Thomson, M.J., Togbé, C., Dagaut, P., Halter, F., and Mounaim-Rousselle, C.,
2009. An experimental and kinetic modeling study of n-butanol combustion. Combust.
Flame., 156 (4), 852–864.
Sarathy, S.M., Vranckx, S., Yasunaga, K., Mehl, M., Oßwald, P., Metcalfe, W.K., Westbrook, C.K., Pitz, W.J., Kohse-Höinghaus, K., Fernandes, R.X., and Curran, H.J., 2012. A comprehensive chemical kinetic combustion model for the four butanol isomers. Combust.
Flame., 159 (6), 2028–2055.
Savard, B., Wang, H., Teodorczyk, A., and Hawkes, E.R., 2018. Low-temperature chemistry in n-heptane/air premixed turbulent flames. Combust. Flame., 196, 71–84.
Seidel, L., Moshammer, K., Wang, X., Zeuch, T., Kohse-höinghaus, K., and Mauss, F., 2015. Comprehensive kinetic modeling and experimental study of a fuel-rich, premixed n-heptane flame. Combust. Flame., 162 (5), 2045–2058.
Seiser, R., Pitsch, H., Seshadri, K., Pitz, W.J., and Curran, H.J., 2000. Extinction and autoignition of n-heptane in counterflow configuration. Proc. Combust. Inst., 28, 2029– 2037.
Sileghem, L., Alekseev, V.A., Vancoillie, J., Geem, K.M. Van, Nilsson, E.J.K., Verhelst, S., and Konnov, A.A., 2013. Laminar burning velocity of gasoline and the gasoline surrogate components iso-octane, n-heptane and toluene. Fuel, 112, 355–365.
Smallbone, A.J., Liu, W., Law, C.K., You, X.Q., and Wang, H., 2009. Experimental and modeling study of laminar flame speed and nopremixed counterflow ignition of n-heptane. Proc. Combust. Inst., 32 (1), 1245–1252.
Suzuki, S., Hori, M., Nakamura, H., Tezuka, T., Hasegawa, S., and Maruta, K., 2013. Study on cetane number dependence of diesel surrogates/air weak flames in a micro flow reactor with a controlled temperature profile. Proc. Combust. Inst., 34 (2), 3411–3417.
Tekawade, A., Kosiba, G., and Oehlschlaeger, M.A., 2016. Time-resolved carbon monoxide measurements during the low- to intermediate-temperature oxidation of heptane, n-decane, and n-dodecane. Combust. Flame., 173, 402–410.
35
Togbé, C., Ahmed, A.M., and Dagaut, P., 2010. Kinetics of oxidation of 2-butanol and isobutanol in a jet-stirred reactor: Experimental study and modeling investigation. Energy
& Fuels, 24, 5244–5256.
Tran, L., Pieper, J., Zeng, M., Li, Y., Zhang, X., Li, W., Graf, I., Qi, F., and Kohse-höinghaus, K., 2017. Influence of the biofuel isomers diethyl ether and n-butanol on flame structure and pollutant formation in premixed n-butane flames. Combust. Flame., 175, 47–59. Veloo, P.S., Wang, Y.L., Egolfopoulos, F.N., and Westbrook, C.K., 2010. A comparative
experimental and computational study of methanol, ethanol, and n-butanol flames.
Combust. Flame., 157 (10), 1989–2004.
Wang, H., Deneys Reitz, R., Yao, M., Yang, B., Jiao, Q., and Qiu, L., 2013. Development of an n-heptane-n-butanol-PAH mechanism and its application for combustion and soot prediction. Combust. Flame., 160 (3), 504–519.
Westbrook, C.K., Pitz, W.J., and Curran, H.J., 2006. Chemical kinetic modeling study of the effects of oxygenated hydrocarbons on soot emissions from diesel engines. J. Phys. Chem.
A., 110, 6912–6922.
Yamamoto, A., Oshibe, H., Nakamura, H., Tezuka, T., Hasegawa, S., and Maruta, K., 2011. Stabilized three-stage oxidation of gaseous n-heptane/air mixture in a micro flow reactor with a controlled temperature profile. Proc. Combust. Inst., 33 (2), 3259–3266.
Yang, Z., Wang, Y., Yang, X., Qian, Y., Lu, X., and Huang, Z., 2014. Autoignition of butanol isomers/n-heptane blend fuels on a rapid compression machine in N2/O2/Ar mixtures. Sci
China Technol Sci, 57 (3), 461–470.
Yao, C., Cheng, C., Liu, S., Tian, Z., and Wang, J., 2009. Identification of intermediates in an n-heptane/oxygen/argon low-pressure premixed laminar flame using synchrotron radiation. Fuel, 88 (9), 1752–1757.
Zhang, J., Niu, S., Zhang, Y., Tang, C., Jiang, X., Hu, E., and Huang, Z., 2013. Experimental and modeling study of the auto-ignition of n-heptane/n-butanol mixtures. Combust.
Flame., 160 (1), 31–39.
Zhang, J., Wei, L., Man, X., Jiang, X., Zhang, Y., Hu, E., and Huang, Z., 2012. Experimental and modeling study of n-butanol oxidation at high temperature. Energy & Fuels, 26, 3368–3380.
Zhang, K., Banyon, C., Bugler, J., Curran, H.J., Rodriguez, A., Herbinet, O., Battin-leclerc, F., Chir, C.B., and Alexander, K., 2016. An updated experimental and kinetic modeling study of n-heptane oxidation. Combust. Flame., 172, 116–135.