Study on Mechanical Properties of Weak Soil
Reinforced with Natural Fiber and Cement
著者
Tran Quang Khiem
学位授与機関
Tohoku University
学位授与番号
11301甲第18958号
THESIS
STUDY ON MECHANICAL PROPERTIES OF
WEAK SOIL REINFORCED WITH NATURAL
FIBER AND CEMENT
JULY 2019
TOHOKU UNIVERSITY
GRADUATE SCHOOL OF ENVIRONMENTAL STUDIES
TAKAHASHI LABORATORY
BY
i ABSTRACT
Nowadays, waste soil or sludge produced from construction sites because of the development in infrastructures in studied area or disaster areas such as landslide as a result of heavy rain is the big problem that we are facing right now in Vietnam. The common method to deal with this problem is discharging the waste soil or sludge directly to disposal area leading to the environmental problems. In addition, to recover the landslide area, people usually use new materials from other sites. This way costs a lot of money for disposal activities and buying new material for fixing those destroyed banks. Thus, a good method to replace the original method is required to recycle the waste soil or sludge for using as a construction material. The waste soil must be treated before using the recycled soil or sludge as a construction material. Currently, there are many methods to stabilize soil but this research focuses on the soil stabilization with cement and cornsilk fiber. The reason why natural fiber as cornsilk is used in this study because cornsilk fiber is considered as a by-product from corn and local fiber material. Cornsilk fiber is abundant and easy to obtain to be used in recycling soil.
At first, this research focuses on recycling the sludge with high water content to use for ground material by using the fiber-cement stabilized sludge method. This part was carried out to investigate the strength behavior of cemented sludge reinforced withcornsilk fiber. Hence, a series of unconfined compression and splitting tension test was conductedat different levels of water, cement, and fiber content. Water contents considered in this study were 40% to60%; cement content used for sludge stabilization was changed from 5 kg/m3 to 40 kg/m3; meanwhile, fiber content wasused at different levels from 5 kg/m3 to 30 kg/m3. The experiment results showed that there was animprovement in failure strength, failure strain, ductility, and stiffness with fiber inclusion. Besides, stiffnessimprovement was based on the amount of cement used. The relationships between failure strength with and without fiber inclusion and water, fiber, and cement content were described as following power or exponential functionwith a strong correlation coefficient.
This research also investigates the effect of cornsilk fiber with different fiber contents (0.5%, 1%, 1.5%, and 2%), fiber lengths (10 mm, 30 mm, and 50 mm) on strength properties of soil with low water content. The compaction, compression, and splitting tension test are used in the present work. The experimental results reveal that the splitting tensile strength, compressive strength. toughness, ductility, and stiffness are improved with fiber inclusion. The most enhancement in compressive strength and tensile strength are 38% and 210%, respectively. Fiber content of 1% and fiber length of 10 mm or 30 mm are recommended to be used.
ii
After that, the effect of cornsilk fiber and cement on mechanical properties of soil with low water content is also studied. Four kinds of test including compression, splitting tension, direct tension, and compaction tests are used to understand the mechanical characteristics of treated soil. A wide range of curing time (7 days, 14 days, and 28 days), cement content (4%, 8%, and 12% by weight of dry soil), and fiber content (0%, 0.25%, 0.5%, and 1% by weight of dry soil) are considered in this research. The multiple nonlinear regressionmodels following the basic parameters including curing time, fiber content, and cement content for evaluating strength characteristics were established. The effective degree of each parameteron compressive and tensile strength was also evaluated.
The experimental results indicate that the addition of fiber results in the improvement of compressive strength and tensile strength in general. The optimum fiber content for improving compressive strength and splitting tensile strength is between 0.25% to 0.5%. Splitting tensile strength equals to 0.148 times compressive strength. Direct tensile strength equals to 0.071 and 0.483 times of compressive strength and splitting tensile strength, respectively. Regression models with high accuracy based on basic parameters are developed to predict compressive strength and tensile strength. According to sensitive analysis, the ascending orders of effective parameters on direct tensile strength were fiber content, curing time, and cement content. Finally, this study aims to propose a process to simplify the regression models which are used to predict some properties of stabilized soil such as compressive strength, tensile strength, etc. 8 data sources with 613 data points were collected from previous studies to examine the models developed from proposed process. The results reveal that although the accuracy of modified models is almost the same as that of multiple nonlinear regression model, the modified models are simpler than the multiple nonlinear regression models. Besides, they are much more reliable than the linear regression models. Thus, the proposed procedure is acceptable to use.
In conclusion, cornsilk fiber shows good performance in soil stabilization As a result, it seems to be a good fiber material to modify soil and should be concerned in future. Furthermore, the utilization of waste material to modify soft soil or sludge will bringabout many benefits not only for the engineering but also for the environment and social economy.
iii
Contents
CHAPTER 1. INTRODUCTION ... 1 1.1.Statement problem ... 1 1.2.Literature reviews ... 1 1.3.Objectives ... 6 1.4.Outline of thesis ... 6CHAPTER 2. STUDY ON STRENGTH BEHAVIOR OF CEMENT STABILIZED SLUDGE REINFORCED WITH WASTE CORNSILK FIBER ... 8
2.1.Introduction ... 8 2.2.Material ... 9 2.2.1.Sludge ... 9 2.2.2.Cement ... 10 2.2.3.Fiber ... 11 2.3.Sample Preparation ... 11 2.4.Testing Program ... 13
2.5.Results and Discussion ... 14
2.5.1. Compressive Strength ... 14
2.5.2.Splitting Tensile Strength ... 21
2.5.3.The Relationship Between Failure Strength And Parameters Affecting On Strength Characteristics ... 27
2.6.Conclusions ... 31
CHAPTER 3. EFFECT OF WASTE CORNSILK FIBER REINFORCEMENT ON MECHANICAL PROPERTIES OF SOFT SOIL ... 32
3.1.Introduction ... 32
3.2.Materials ... 33
3.2.1.Soil ... 33
iv
3.3.Specimen Preparation ... 36
3.4.Testing program ... 37
3.5.Results and Discussion ... 38
3.5.1.Compaction behavior ... 38
3.5.2.Compressive strength behavior ... 39
3.5.3.Splitting tensile strength behavior ... 43
3.5.4.Stiffness ... 45
3.5.5.Toughness ... 46
3.5.6.Application feasibility in geotechnical engineering ... 47
3.6.Conclusions ... 48
CHAPTER 4. IMPROVEMENT OF MECHANICAL BEHAVIOR OF CEMENTED SOIL REINFORCED WITH WASTE CORNSILK FIBERS... 49
4.1.Introduction ... 49
4.2.Materials and methods ... 50
4.2.1.Materials ... 50
4.2.2.Sample preparation ... 50
4.2.3.Testing apparatus and procedure ... 51
4.3.Regression models and sensitive analysis ... 52
4.4.Results and discussion ... 53
4.4.1.Compaction behavior ... 53
4.4.2.Compressive strength ... 55
4.4.3.Splitting tensile strength ... 56
4.4.4.Correlation between compressive strength and splitting tensile strength ... 57
4.4.5.The regression models for predicting compressive and splitting tensile strength and the sensitivity of parameters. ... 58
4.5.Conclusion ... 61
CHAPTER 5. TENSILE BEHAVIORS OF NATURAL FIBER AND CEMENT REINFORCED SOIL SUBJECTED TO DIRECT TENSILE TEST ... 62
v
5.1.Introduction ... 62
5.2.Materials and methods ... 63
5.2.1.Materials ... 63
5.2.2.Specimen preparation ... 63
5.2.3.Testing equipment and procedure ... 65
5.3.Experimental results and discussion ... 66
5.3.1.Stress-strain curve ... 66
5.3.2.Influence of cement content on maximum tensile strength ... 70
5.3.3.Influence of fiber content on tensile strength of cemented soil with different curing time ... 71
5.3.4.Energy absorption ... 73
5.3.5.Crack patterns ... 74
5.3.6.Correlation of direct tensile strength versus splitting tensile strength and direct tensile strength versus compressive strength. ... 75
5.3.7.Regression model for predicting direct tensile strength based on basic parameters ……….. ... 77
5.3.8.Sensitive analysis ... 78
5.4.Conclusions ... 79
CHAPTER 6. SIMPLIFICATION OF REGRESSION MODELS FOR PREDICTING MECHANICAL AND PHYSICAL PROPERTIES OF STABILIZED SOIL ... 80
6.1.Introduction ... 80
6.2.The collected database ... 81
6.3.A process for determining multiple regression models by using regression analysis method ... 82
6.4.Results and discussion ... 84
6.4.1.A typical result of the proposed process ... 84
6.4.2.Comparison between modified model and MLR and MNLR models ... 87
vi
CHAPTER 7. CONCLUSIONS ... 92
REFERENCES ... 94
LIST OF PUBLICATIONS ... 103
vii
List of Figures
Fig. 1. 1 Vietnam location and soil produced from landslide area ... 1
Fig. 2. 1 Grain size distribution curve... 10
Fig. 2. 2 Cornsilk fiber used in this study ... 11
Fig. 2. 3 Mixing machine and tools for making specimen... 12
Fig. 2. 4 Stress-strain curves at water content of 40% ... 16
Fig. 2. 5 Stress-strain curves at water content of 50% ... 17
Fig. 2. 6 Stress-strain curves at water content of 60% ... 18
Fig. 2. 7 Relationship between secant modulus and fiber content at strain of 2% and water of 40% ... 19
Fig. 2. 8 Relationship between secant modulus and fiber content at strain of 2% and water of 50% and 60% ... 19
Fig. 2. 9 Relationship between failure strength and strain and additive amount of cornsilk with different additive amount of water and cement ... 20
Fig. 2. 10 Stress-strain curves at water content of 60% with variations of fiber and cement content ... 22
Fig. 2. 11 Stress-strain curves at water content of 50% with variations of fiber and cement content ... 23
Fig. 2. 12 Stress-strain curves at water content of 40% with variations of fiber and cement content ... 24
Fig. 2. 13 The effect of fiber content on failure tensile strength at water content of 60% with variations of fiber and cement content ... 26
Fig. 2. 14 The effect of fiber content on failure tensile strength at water content of 50% with variations of fiber and cement content ... 26
Fig. 2. 15 The effect of fiber content on failure tensile strength at water content of 40% with variations of fiber and cement content ... 27
Fig. 2. 16 Correlation of 𝜎𝑓, 𝑐/𝜎𝑐 and C/F ... 28
Fig. 2. 17 Correlation of σf, c/σc and W(C/F)0.5 ... 28
Fig. 2. 18 Correlation of 𝜎𝑓, 𝑐 and F ... 28
Fig. 2. 19 Correlation of 𝜎𝑓, 𝑐 and C ... 29
Fig. 2. 20 Correlation of 𝜎f, c and C/W ... 29
viii
Fig. 3. 1 Cornsilk fibers used in this investigation: (a) 10 mm long; (b) 30 mm long; (c) 50
mm long; (d) micrograph of cornsilk with 200X... 34
Fig. 3. 2 The frequency of fiber length after cutting: a) 10 mm; b) 30 mm; c) 50 mm. ... 35
Fig. 3. 3 The average lengths corresponding to chopped lengths. ... 36
Fig. 3. 4 Modified UCT machine using for splitting tension test. a) before testing; b) after testing ... 38
Fig. 3. 5 The effect of fiber content on OWC ... 39
Fig. 3. 6 The effect of fiber content on γd ... 39
Fig. 3. 7 Stress-strain curve with variations of fiber content (F) and fiber length (L). a) 10 mm; b) 30 mm; c) 50 mm. ... 41
Fig. 3. 8 The interaction between fibers and soil matrix. a) network of fibers in soil matrix; b) soil particles attached on fiber. ... 42
Fig. 3. 9 The effect of fiber contents on maximum compressive strength... 43
Fig. 3. 10 Fibers twisted in form lumps of fiber-soil matrix... 43
Fig. 3. 11 Stress-strain curve with variations of fiber content and fiber length. a) 10 mm; b) 30 mm; c) 50 mm. ... 44
Fig. 3. 12 The effect of fiber contents on failure splitting tensile strength. ... 45
Fig. 3. 13 The effect of fiber inclusion on tensile failure characteristics... 45
Fig. 3. 14 The effect of fiber contents on secant modulus with different fiber lengths. ... 46
Fig. 3. 15 The effect of fiber contents on energy absorption capacity at different fiber lengths. ... 47
Fig. 4. 1 Photograph of cornsilk fibers ... 50
Fig. 4. 2 Shimazu machine using for tests. a) Compression test and b) Splitting tension test 52 Fig. 4. 3 Compaction properties of soil reinforced with variations of fiber and cement content; a) C4%, b) C8%, and c) C12%. ... 54
Fig. 4. 4 Effect of fiber content (F) on compressive strength at variations of cement content (C) and curing age (D) ... 56
Fig. 4. 5 Effect of fiber content (F) on splitting tensile strength at variations of cement content (C) and curing time (D); a) 7 days, b) 14days, and c) 28 days. ... 57
Fig. 4. 6 Correlation between compressive strength and tensile strength ... 58
Fig. 4. 7 Estimated data versus experimental data; a) Compressive strength b) Tensile strength ... 60
Fig. 5. 1 Fiber photograph... 63
ix
Fig. 5. 3 Testing apparatus; a) tensile mold, b) tensile machine ... 65
Fig. 5. 4 Typical stress-strain curves of cemented soil reinforced with fiber at 7 days; a) C4%, b) C8%, and c) C12% ... 67
Fig. 5. 5 Typical stress-strain curves of cemented soil reinforced with fiber at 14 days; a) C4%, b) C8%, and c) C12% ... 68
Fig. 5. 6 Typical stress-strain curves of cemented soil reinforced with fiber at 28 days; a) C4%, b) C8%, and c) C12% ... 69
Fig. 5. 7 Bridging effect of fiber reinforced cemented soil at failure plane ... 70
Fig. 5. 8 Influence of cement content on direct tensile strength with various curing times .... 70
Fig. 5. 9 Maximum direct tensile strength; a) 7 days, b) 14 days, and c) 28 days. ... 72
Fig. 5. 10 Energy absorption capacity of cemented soil reinforced with fiber. a) 7 days, b) 14 days, and c)28 days. ... 73
Fig. 5. 11 Failure pattern of specimens with curing time 28 days and 12% cement; a) 0% fiber, b) 0.25% fiber, c) 0.5% fiber, and 1% fiber... 75
Fig. 5. 12 The relationship between DTS and STS... 76
Fig. 5. 13 The relationship between DTS and UCS ... 76
Fig. 5. 14 Predicted data versus experimental data ... 78
Fig. 6. 1 The correlation of experimental and predicted data of selected and modified model ... 86
Fig. 6. 2 The root mean square errors. a) Source No. 1, b) Source No. 2, c) Source No. 3, d) Source No. 4, e) Source No. 5, f) Source No. 6, g) Source No. 7, h) Source No. 8 .. 90
x
List of Table
Table 2. 1 Chemical properties of clay and silt ... 9
Table 2. 2 Physical properties of soil ... 10
Table 2. 3 Chemical and physical properties of GEOSET 200 ... 11
Table 2. 4 Mixing conditions ... 13
Table 3. 1 Mixing conditions for the tests ... 37
Table 4. 1 Mixing conditions ... 51
Table 4. 2 The P-values of coefficients associated with variables in regression models ... 59
Table 4. 3 Effective degree of input parameters ... 61
Table 5. 1 Mixture designation ... 64
Table 5. 2 The sensitivity of input parameters ... 79
Table 6. 1 The collected database used in the investigation ... 82
Table 6. 2 The P-value and adjusted determination coefficient (R2a) of selected and modified models ... 86
Table 6. 3 The form of modified, MLR, and MNLR models corresponding to each data collection ... 88
CHAPTER 1
INTRODUCTION
1
Chapter 1. Introduction
1.1. Statement problem
Vietnam is a small and developing country located in Southwest Asia bordering with China, Laos, and Cambodia. Currently, to adapt to the development of economy in Vietnam, the improvement in infrastructure is required. Therefore, many infrastructure projects like metro, sky building, highway, etc. have been conducted in recent years. These activities produce a large amount of soft soil or sludge which is considered as waste material and usually is discharged into natural environment leading to environmental issues. In addition, heavy rainfalls often occur in Vietnam where has tropical monsoon climate causing landslide. This is also the reason for producing waste soil or sludge. Thus, the waste soil or sludge produced in construction sites or disaster area is a big problem to natural environment that Vietnam has faced in recent years. Therefore, recycling these waste materials is necessary and should be concerned in these days.
Fig. 1. 1 Vietnam location and soil produced from landslide area [93]
Besides, Vietnam is also agricultural country so the by-product yield every year in Vietnam is very large. In order to treat the by-product from agricultural crops, a traditional way used currently is burning. However, the gas from burning activity will cause the global warming issue. Hence, the by-product from agricultural crops should be utilized in order to increase the recycling rate.
1.2. Literature reviews
Estabragh et al. (2012) [1] conducted unconfined compression test in order to investigate the behavior of cemented soil reinforced by nylon fiber with different cement content (0.5%, 0.75%, 1%, and 1.25%) and fiber content (5%, 8%, and 10%). The specimens with various
2
curing times (3 days, 7 days, 14 days, and 28 days) were also considered in the study. The results of this study revealed that the compressive strain and strength of stabilized specimen increased and the fiber inclusions changed the behavior of cemented soil to ductile behavior. The optimum fiber content was about 1%. This study pointed out that the addition of fibers and cement to soil can be considered as efficient because the reinforced specimen has both fiber-reinforced soil properties and cement-stabilized soil properties.
Soganci et al. (2015) [2] investigated the effect of polypropylene fiber on swelling characteristics of expansive soil by conducting the unconfined compressive test, compaction test, and swelling test. The results showed that the compressive strength was increased with increasing fiber content. The fiber reinforced soil was more ductile than unreinforced soil. For swelling property, the inclusion of fiber decreased the swell percent of expansive soil. The study pronounced that soil reinforced with polypropylene is a useful method for ground improvement and it is easier to apply than other methods.
Dafalla et al. (2017) [3] investigated the tensile strength behavior of fiber reinforced soil treated with chemical admixture by conducting the splitting tensile test. The experimental results indicated that there is almost no effect on tensile strength of clay reinforced with polypropylene fiber only. Meanwhile, the polypropylene can enhance the tensile strength of clay treated with 6% lime from 13% to 28% depending on the fiber content. It means that there was no bond between fibers and clays when cementing agent was not used.
Ghavani et al. (1999) [4] performed a study about utilizing natural fiber reinforcing soil to deal with the housing shortage problem. This study focused on the physical and mechanical properties of fiber reinforced soil by conducting compaction test, compressive test, drying process. In this study, two kinds of fibers including sisal and coconut fibers were used to improve mechanical and physical properties of three kinds of soil. The results indicated that the soil with fiber inclusion is more ductile than unreinforced soil and the compressive strength slightly improved with the addition of fibers. In addition, fiber inclusion prevented shrinkage cracks due to the drying process.
Yixian et al. (2016) [5] studied the effects of jute fiber on strength properties of soil. In this study, the different fiber content, fiber length, water content, and dry density were considered. Direct shear tests and CU triaxial compression tests were used to investigate the strength behavior of reinforced and unreinforced specimen. Experimental results presented that the optimum fiber content and fiber length were 0.6% and 6 mm, respectively. With the addition
3
of fiber from 0% 0.6%, the cohesion of reinforced samples increased. Further increasing fiber content, the cohesion of reinforced specimens decreased. For specimens with higher water content, the fiber reinforcement effects decreased due to water playing a role as a lubricant in the interface of soils particles and fibers. On the other hand, for specimens with higher dry density, the effect of fiber reinforcement enhanced due to the improvement in the effective contact area between soil and fiber.
Prabakar et al. (2012) [6] conducted compaction tests and triaxial compression tests in order to understand the influence of sisal fiber in soil reinforcement in term of strength properties. In the present work, variations of fiber content (0.25%, 0.5%, 0.75%, and 1%) and fiber length (10 mm, 15 mm, 20 mm, and 25 mm) were considered. The experimental results displayed that the cohesion and friction angle significantly improved. The optimum fiber content and fiber length were 0.75% and 20 mm, respectively. The study concluded that sisal fiber can be considered as a good fiber reinforcement material.
Consoli et al. (2013) [7] conducted compressive tests and splitting tensile tests for fiber-reinforced and non-fiber-reinforced cemented sand. Based on the experimental results, the effects of cement volumetric content, porosity, and porosity/cement ratio on evaluating the compressive strength and tensile strength were studied. The compressive strength and splitting tensile strength for different conditions could be assessed by using the porosity/ volumetric cement ratio with the exponent value of 0.28 for volumetric cement. Tensile strength/compressive strength ratio equal to 0.14 for fiber reinforced cemented soil and 0.1 for unreinforced cemented soil.
Takahashi et al. (2010) [8] utilized crushed board paper for use in a new recycling system for high water content mud. Crushed board paper was used as a fiber material to replace paper debris due to increasing in the price of old new newspaper. The research focused on the strength behavior of fiber-cement stabilized sludge. The results revealed that compressive strength and strain of specimens reinforced with crushed board paper was almost same as that of specimens reinforced with paper debris. It means that the crushed board paper can be used to substitute for paper debris.
Satomi et al. (2014) [9] investigated the strength properties and permeability of fiber-cement-stabilized soil. The soil used in this research were made of tsunami sludge. Paper debris was used as fiber material. The addition of fiber caused an increase in failure strength and
4
compressive strength. However, the fiber inclusion did not affect the hydraulic conductivity. The hydraulic conductivity reduced with the increasing cement content.
Consoli et al. (1998) [10] performed triaxial compression test in order to understand the influence of fiber and cement on soil. Cement contents were 0% and 1% by weight of dry soil. Chopped fiberglass was used with the length of 12.8mm and contents of 0% and 3% by weight of dry soil. The experimental results showed that there is an improvement in peak and residual strength. With fiber reinforcement, the specimens are more ductile than the unreinforced specimens. Stiffness increased with cement inclusion and decreased with fiber addition. Hooresfand et al. (2011) [11] evaluated the influences of polypropylene fiber on the strength properties of cemented sand by conducting a triaxial compression tests. Cement content of 3% by weight of dry soil and fiber contents of 0.5% and 1% by weight of dry soil were used in this study. The reinforced specimens were cured for 7 days before subjected to compression tests. The experimental results revealed that the fiber inclusion into cemented soil improved the peak and residual strength. In addition, the cemented soil changed from brittle to ductile behavior with fiber addition.
Ahmad et al. (2010) [12] performed the triaxial compression test in order to study the effect of discrete fiber on strength behavior of silty sand. The natural fiber named oil palm empty fruit bunch fibers was used in this research. The specimens were prepared at different fiber content consisted of 0.25% and 0.5% and fiber length including 10 mm, 30 mm, and 45 mm. These specimens were both tested under drained and undrained conditions. The result revealed that the specimens with fiber inclusion had better shear strength compared to that without fiber addition. Additionally, this study also compared the different between specimens reinforced with fiber coated with acrylic butadiene styrene thermoplastic and uncoated fiber in term of shear strength. The shear strength of specimens with coated fiber was higher than that of specimens with uncoated fiber. This happened due to the increasing surface area leading to the improvement of interface friction between fiber and soil when using coated fiber.
Anggraini et al. (2015) [13] conducted the splitting tension test and unconfined compression test to investigate the compressive strength as well as tensile strength of soil stabilized by lime and coir fiber. The results show that the compressive and tensile strength improved with the fiber and lime inclusion. The relationship between compressive strength and splitting tensile strength was also proposed. Coir fiber could be considered as a good fiber material for soil reinforcement.
5
Cai et al. (2006) [14] conducted the study on polypropylene reinforcement in lime stabilized soil in order to reduce the brittleness. This research considered wide range of lime content (2%, 5%, and 8%) and fiber content (0.05%, 0.15%, and 0.25%) to investigate the engineering properties of lime stabilized soil reinforced with polypropylene fiber. The modified specimens were tested by direct shear test, unconfined compression test, swelling test, and shrinkage test. The mechanical properties of treated soil were significantly affected by lime content, fiber content, and curing time. With the increasing fiber content, the strength end shrinkage of specimens with fiber inclusion enhanced, but the swelling of that reduced. In addition, through scanning electron microscopy analysis, there is a physical interaction between soil and fiber in the treated specimen.
Chauhan et al. (2008) [15] investigated the effect of coir fiber and synthetic fiber in soil stabilization. Some experiments including compaction test, unconfined compression test, and static triaxial test were used to investigate the mechanical properties of stabilized soil. the experimental results indicated that the permanent and resilient strain of modified soil increase with the number of load cycles and decrease with confining pressure. In term of resilient, the modified soil reinforced with coir fiber was better than that reinforced with synthetic fiber. Danso et al. (2015) [16] investigated the effect of different kinds of natural fiber including coconut, bagasse, and oil palm fibers on engineering properties of soil blocks. The compressive strength and tensile strength of reinforced blocks were studied. For specimens with oil palm fiber and coconut fiber, the strength properties improved with the increasing aspect ratio. In term of specimens with bagasse fiber, strength initially increased and then decreased with higher aspect ratio.
Danso et al. (2015) [17] used agricultural waste to stabilize soil blocks. Different fiber contents from 0.25% to 1% were used to reinforce soil block. The samples were tested in term of compressive strength, tensile strength, water absorption, density, etc. The experimental results revealed that the mechanical and durability properties of modified block improved in general. Kumar et al. (2007) [18] conducted an experimental program to investigate the geotechnical characteristics of sly ash-soil and lime-soil reinforced with polyester fiber. This research considered a wide range of fly ash content (1%-10%) and lime content (1%-10%). Three kinds of experiment were used including compaction, compression, and splitting tension tests. The specimens were cured at different curing time (7 days, 14 days, and 28 days) before subjecting
6
to the tests. The results indicated that the soil reinforced with fiber, lime, and fly ash could be used in geotechnical engineering.
Li et al. (2014) [19] investigated the tensile behavior of soil reinforced with discrete fiber by conducting direct tension test. This research studied the effect of water content, dry density, and fiber content on tensile strength of reinforced soil. With fiber inclusion, the tensile strength and tensile ductility were significantly improved. In addition, the tensile strength also increased with increasing fiber content. The tensile strength increased with increasing dry density or reducing water content.
1.3. Objectives
To solve the problems that Vietnam has been currently faced, this research aims to recycle the waste soil and by-products from agricultural crops. These waste materials will be utilized to make new construction and building materials. The modified soil could be used for ground material to recover landslide area or building material such as earth block to build house, retaining wall, etc. The fiber-cement stabilized soil method is the most suitable method to apply in this study. The stabilized material will be examined in term of mechanical properties including stress-strain curve, unconfined compressive strength, splitting tensile strength, direct tensile strength, crack patterns, stiffness, energy absorption capacity (toughness), optimum water content, and maximum dry unit weight.
In addition, the experimental results especially from modified soil using for building material would be used to make some relationships of compressive strength versus splitting tensile strength, compressive strength versus direct tensile strength, splitting tensile strength versus direct tensile strength. Some empirical models to predict compressive, splitting tensile, and direct tensile strength according to three basic parameters including cement content, fiber content, and curing time were proposed based on regression analysis.
1.4. Outline of thesis
This thesis includes 7 chapters. The content of each chapter is as follows:
Chapter 1 presents the problems relating to waste soil or sludge and agriculture waste happening in Vietnam. The literature reviews from previous studies and objectives of this research are also introduced in this chapter.
7
cornsilk fiber on mechanical properties of cemented soil by using compression and splitting tension test. The soil with high water content is considered in this chapter.
Chapter 3 studies the effect of different fiber contents and fiber lengths on mechanical characteristics of soil by using three different tests consisted of compaction, compression, and splitting tension tests.
Chapter 4 investigates the mechanical properties of soil with low water content stabilized with cement and cornsilk fiber. The modified mixture including soil, fiber, and cement are prepared at optimum water content. The maximum dry unit weight, optimum water content, compressive strength, splitting tensile strength of reinforced soil are investigated. In addition, some models for predicting strength properties are also proposed based on regression analysis.
Chapter 5 investigates the direct tensile strength behavior. The specimens are prepared at different fiber contents, cement contents, and curing times. The stress-strain curves, direct tensile strength, total energy absorption capacity, crack pattern are studied.
Chapter 6 aims to propose a simplification procedure to simply the multiple nonlinear repression models to evaluate some problems such as compressive strength, tensile strength, etc.
CHAPTER 2
STUDY ON STRENGTH
BEHAVIOR OF CEMENT
STABILIZED SLUDGE
REINFORCED WITH WASTE
CORNSILK FIBER
8
Chapter 2. Study on Strength Behavior of Cement Stabilized
Sludge Reinforced with Waste Cornsilk Fiber
2.1. Introduction
Soft soil or sludge produced from construction sites or disaster areas is generally discarded to the natural environment. It causes many environmental issues and increases the project cost because of discharge fee inclusion. In addition, the use of borrowed soil material from another site is uneconomical for the overall cost of the construction project. Hence, it is necessary to modify or recycle local soil. Nowadays, an attractive method to deal with these problems is fiber-cement stabilized soil method, which is belonged to chemical and mechanical stabilized soil categories [1].
There are two fiber categories consisted of synthetic and natural fibers, which are classified based on their nature. Synthetic fibers are more concerning by many researchers compared with natural fibers due to high performance in structural concrete as well as soil reinforcement
[2,3,20]. Nevertheless, from sustainable and economical points of view, natural fibers are better than synthetic fibers because of their renewable, available, and cheap resources. Furthermore, some researchers have been already confirmed the workability of natural fiber in ordinary concrete, mortar composites and soil stabilization [4–6,21–23].
Currently, cornsilk is a by-product from corn, which is the third most cultivation in the world
[24], so the yield of cornsilk every year is redundant and it is easily obtained from the cultivated field. The use of cornsilk fiber in cemented sludge results in lower construction cost and environmental issue improvement. In addition, there is no research work on the utilization of cornsilk in fiber reinforcing cemented sludge. Therefore, the cornsilk fiber was focused on fibers to improve the sludge in this study.
Consoli et al. [7,25] reported that the effect of parameters such as the amount of cement, the porosity, etc. to the unconfined compressive strength and the splitting tensile strength of fiber reinforced cement-soil (FRCS) mixture could be described following a power function. The porosity-to-cement ratio is a proper parameter to evaluate the tensile and compressive strength of FRCS mixture. Since the kind of fiber in previous studies was synthetic fiber, there are some differences with natural fiber such as bonding surface. Therefore, it is necessary to check the parameters affecting strength behavior when using natural fibers.
9
The aim of this study is to understand the mechanical properties (i.e. failure strength, ductility, stiffness) of fiber-cement stabilized sludge with a different amount of cornsilk fiber at the different water and cement contents. Besides, the relationship between failure strength of cement stabilized sludge with and without fiber and the water-cement-fiber ratios is also considered in this study.
2.2. Material
2.2.1. Sludge
In order to carry out the systematic experiments, a large amount of sludge is necessary. However, it is difficult to obtain a large amount of actual sludge. Hence, artificial sludge was used in this study. The imitation sludge sample is composed of Kasaoka clay, silt, and water. The ratio of clay and silt in the sludge mixture is 40:60 in dry mass. This ratio was decided according to the previous research [8]. The water content in sludge was used at different levels of 40%, 50%, and 60% by weight of soil in dry mass. Chemical properties of Kasaoka clay and silt are shown in Table 2. 1. Physical properties of soil composed of clay and silt are shown in
Table 2. 2. The grain particle size of soil is also shown in Fig. 2. 1. Table 2. 1 Chemical properties of clay and silt
Compound Clay (%) Silt (%) SiO2 77.9 69.1 Al2O3 12.9 20.2 Fe2O3 2.08 5.46 CaO 1.88 0.91 MgO 0.28 0.807 MnO 0.072 0.027 Na2O 1.97 1.48 K2O 2.42 2.75
10
Table 2. 2 Physical properties of soil
Properties Values
Grain size analysis
Gravel (%) 0 Sand (%) 8.10 Silt (%) 83.5 Clay (%) 8.50 Specific gravity 2.47 Atterberg limits Liquid limit (%) 46.1 Plastic limit (%) 29.4 Plasticity index (%) 16.7 Soil classification USCS OL AASHTO A-7-6 Compaction parameters
Optimum water content (%) 30.8
Maximum dry unit weight (kN/m3) 12.9 Unconfined compression strength (kN/m2) 72.9 2.2.2. Cement
The kind of cement used in this study was GEOSET 200, which was provided by Taiheiyo Cement Corporation. It is consistent with a wide variety of purposes, including both shallow and deep stabilization of soft ground, as well as the solidification of sludge and bottom-layer soil. Chemical and physical properties of GEOSET 200 are shown in Table 2. 3.
Fig. 2. 1 Grain size distribution curve 0 20 40 60 80 100 0.1 1 10 100 1000 P assi ng we ig ht (% ) Grain size (µm) Imitation Soil
11
Table 2. 3 Chemical and physical properties of GEOSET 200
Properties Values Chemical compound SiO2 (%) 23.6 Al2O3 (%) 7.76 Fe2O3 (%) 1.83 CaO (%) 53.9 MgO (%) 3.35 SO3 (%) 6.53 Physical properties Specific surface (cm2/g) 3.68 Specific gravity 3.01 2.2.3. Fiber
The fiber used in this study was cornsilk as shown in Fig. 2. 2, which is classified as a single fiber. They were provided by Thanh Binh Company, Vietnam. The length, diameter, and water absorption of cornsilk fibers were approximately 10 mm, 0.3 mm, and 4 cc/g, respectively. The procedure for determining water absorption is shown as following. 1) Mixing 10 g fiber and 100 ml (100 g) distilled water in 1 min. 2) Filter paper and glass funnel are wetted by distilled water. 3) Puting filter paper on glass funel which is put on glass tube. 4) After 1 min, pouring mixture of distilled water and fiber on funnel. 5) Waiting for 30 mins and measuring water volume on glass tube. Finally, water absorption of fiber is calculated by Eq. (2. 1)
Wa = (100-V)*100/m (2. 1)
where Wa is water absorption capacity of fiber, V is mass of water in glass tube, m is 10 g fiber.
Fig. 2. 2 Cornsilk fiber used in this study 2.3. Sample Preparation
The sludge was modified by adding cement and fibers. The water content of sludge (W) and the additive amount of cement (C) and fibers (F) are shown in Table 2. 4. The procedure to
12 make specimens for testing is as follows.
(1) Adding fibers and cement into the sludge and mixing until obtaining homogenous mixture by mixing machine as Fig. 2. 3.
(2) Curing the mixtures in the oven at 20±3 degree Celsius for 3 days to get modified sludge. (3) Making specimens by compacting the modified sludge in a standard steel mold of 50 mm in diameter and 100 mm in height as Fig. 2. 3.
(4) Curing the specimens having the diameter of 50 mm and the height of 100 mm for 7 days
[9].
13
Table 2. 4 Mixing conditions
Test Series W (%) C (kg/m3) F (kg/m3) Series W (%) C (kg/m3) F (kg/m3) STS 1 40 30 0 16 50 40 0 2 40 30 10 17 50 40 10 3 40 30 20 18 50 40 20 4 40 35 0 19 50 50 0 5 40 35 10 20 50 50 10 6 40 35 20 21 50 50 20 7 40 40 0 22 60 35 0 8 40 40 10 23 60 35 10 9 40 40 20 24 60 35 20 10 40 50 0 25 60 40 0 11 40 50 10 26 60 40 10 12 40 50 20 27 60 40 20 13 50 35 0 28 60 50 0 14 50 35 10 29 60 50 10 15 50 35 20 30 60 50 20 UCT 1 40 5 0 21 50 30 10 2 40 5 10 22 50 30 15 3 40 5 20 23 50 30 20 4 40 5 30 24 50 30 25 5 40 10 0 25 50 35 0 6 40 10 10 26 50 35 5 7 40 10 20 27 50 35 10 8 40 10 30 28 50 35 15 9 40 15 0 29 50 40 0 10 40 15 10 30 50 40 10 11 40 15 20 31 60 40 20 12 40 20 0 32 60 30 0 13 40 20 10 33 60 30 10 14 40 20 20 34 60 30 20 15 40 20 30 35 60 35 0 16 40 5 0 36 60 35 10 17 40 25 10 37 60 35 20 18 40 25 20 38 60 40 0 19 50 30 0 39 60 40 10 20 50 30 5 40 60 40 20
W: water content C: cement content F: Fiber content
STS: Splitting tensile test UCS: Unconfined compressive test
2.4. Testing Program
Unconfined compression tests with a load controlled 2 kN maximum load and an axial displacement rate of 1 mm/min were carried out according to ASTM D1633 [26] on the specimens of 50 mm in diameter and 100 mm in height. The curing time of samples used in
14
this test was 7 days. According to ASTM D2166 [27], the maximum strain is limited to 15%, so the test would be performed until the displacement reaching 15 mm approximately.
Splitting tension test was conducted according to Ref. [28] by using unconfined compression machine and a supplemental piece. The additional part was a pair of loading strips with 5 mm thick, 120 mm long and 10 mm wide. Specimens with the diameter of 50 mm and the height of 100 mm were compressed under a maximum load machine of 2 kN and an axial displacement rate of 1 mm/min. The splitting tensile strength values of specimens in the same mixing condition differ by less than 14% of their average. The tensile strength t is determined by Eq.
(2. 2). t 2 π P D L (2. 2) Where: P is the compressive force, D is the specimen diameter, and L is the specimen length. 2.5. Results and Discussion
2.5.1. Compressive Strength
Fig. 2. 4, Fig. 2. 5,and Fig. 2. 6 show the stress-strain curves of all mixtures. Name of each mixing condition is abbreviated following W, C, and F. For example, W40C5CS0 indicates that the amount of water, cement, and fiber used in the admixture is 40%, 5 kg/m3, and 0 kg/m3, respectively. From these figures, it is clear that there was an improvement of stress as well as strain with fiber inclusion comparing with sludge stabilized by cement only.
The trend of stress-strain curve for mixtures with and without fiber inclusion after obtaining peak stress point was different. For sludge reinforced with cement only, the stress decreased significantly after peak stress causing suddenly structural failure. On the other hand, the stress gradually decreased for cemented sludge reinforced with fibers. Especially, the stress-strain curve tendency still increased after the strain reached 15% in some cases such as W40C10CS30, W50C30CS20, etc.
Ductility behavior of soil can be defined as the maximum axial strain of stress-strain curve [1]. Many previous studies had already confirmed that the behavior of cemented soil with fiber inclusion is changed from brittle to ductile [10,11]. As can be seen in Fig. 2. 4, Fig. 2. 5,and
Fig. 2. 6, the addition of cornsilk fiber considerably improved the ductility behavior of soil. It is consistent with previous studies mentioned above. In other words, the effect of cornsilk fiber on ductility is not different compared with other natural or synthetic fibers.
15
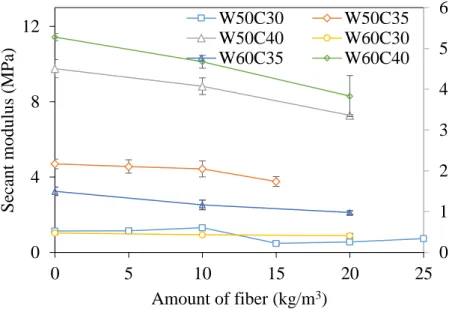
Secant modulus is also an important parameter to evaluate the stiffness behavior of the materials and can be determined from the unconfined compression test. It is defined as the ratio of stress and strain at any point on the stress-strain curve. This study considers secant modulus at the strain of 2% for all mixtures. The results from Fig. 2. 7 and Fig. 2. 8 show that there were two trends of secant modulus. The first one was for using a small amount of cement (5 kg/m3, 10 kg/m3, and 20 kg/m3). The effect of cement on soil behavior was not much, so modulus values at the strain of 2% increased with increasing fiber content. It can be concluded that the effect of fiber was not only making specimen more ductile but also improving the stiffness of sample. The second tendency is that the secant modulus decreased with increasing fiber content. It is in agreement with the results of previous studies [29,30]. A reasonable explanation for the second trend is the use of a large amount of cement (30 kg/m3, 35 kg/m3, and 40 kg/m3). In a word, the increase or decrease of secant modulus of cemented sludge with fiber inclusion is based on the amount of cement used.
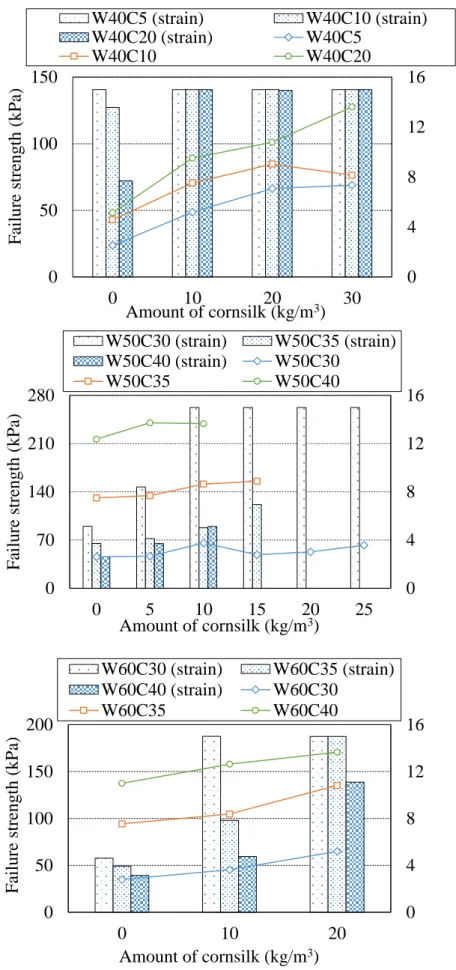
The effect of fiber content on failure strength and strain with variations of cement and water content was also considered. Failure strength was a peak stress point in the stress-strain curve of each mixture. In general, both failure strength and strain increased with increasing amount of fibers, it can be readily observed in Fig. 2. 9. The influence of fiber inclusion with variations of fiber content in increasing failure strength is as follows. 1) For W40 with C5, C10, and C20; from 64.2% to 190.6%. 2) For W50 with C30, C35, and C40; from 1.9% to 43.8%. 3) For W60 with C30, C35, and C40; from 14.8% to 85.9%. These results indicate that the addition of cornsilk fiber caused a significant improvement in the failure strength of cemented sludge.
16
Fig. 2. 4 Stress-strain curves at water content of 40% 0 20 40 60 80 100 120 140 0 5 10 15 C ompre ssi ve stre ss (kP a) Strain (%) W40C5CS0 W40C5CS10 W40C5CS20 W40C5CS30 0 20 40 60 80 100 120 140 0 5 10 15 C ompre ssi ve stre ss (kP a) Strain (%) W40C10CS0 W40C10CS10 W40C10CS20 W40C10CS30 0 20 40 60 80 100 120 140 0 5 10 15 C ompre ssi ve stre ss (kP a) Strain (%) W40C20CS0 W40C20CS10 W40C20CS20 W40C20CS30
17
Fig. 2. 5 Stress-strain curves at water content of 50% 0 50 100 150 200 250 0 5 10 15 C ompre ssi ve stre ss (kP a) Strain (%) W50C30CS0 W50C30CS5 W50C30CS10 W50C30CS15 W50C30CS20 W50C30CS25 0 50 100 150 200 250 0 5 10 15 C ompre ssi ve stre ss (kP a) Strain (%) W50C35CS0 W50C35CS5 W50C35CS10 W50C35CS15 0 50 100 150 200 250 0 5 10 15 C ompre ssi ve stre ss (kP a) Strain (%) W50C40CS0 W50C40CS10 W50C40CS20
18
Fig. 2. 6 Stress-strain curves at water content of 60% 0 50 100 150 200 0 5 10 15 C ompre ssi ve stre ss (kP a) Strain (%) W60C30CS0 W60C30CS10 W60C30CS20 0 50 100 150 200 0 5 10 15 C ompre ssi ve stre ss (kP a) Strain (%) W60C35CS0 W60C35CS10 W60C35CS20 0 50 100 150 200 0 5 10 15 C ompre ssi ve stre ss (kP a) Strain (%) W60C40CS0 W60C40CS10 W60C40CS20
19
Fig. 2. 7 Relationship between secant modulus and fiber content at strain of 2% and water of 40%
Fig. 2. 8 Relationship between secant modulus and fiber content at strain of 2% and water of 50% and 60% 0 1 2 3 0 10 20 30 S ec ant modul us (MPa) Amount of fiber (kg/m3) W40C5 W40C10 W40C20 0 1 2 3 4 5 6 0 4 8 12 0 5 10 15 20 25 S ec ant modul us (MPa) Amount of fiber (kg/m3) W50C30 W50C35 W50C40 W60C30 W60C35 W60C40
20
Fig. 2. 9 Relationship between failure strength and strain and additive amount of cornsilk with different additive amount of water and cement
0 4 8 12 16 0 50 100 150 0 10 20 30 F ailure stre ng th (kPa) Amount of cornsilk (kg/m3) W40C5 (strain) W40C10 (strain) W40C20 (strain) W40C5 W40C10 W40C20 0 4 8 12 16 0 70 140 210 280 0 5 10 15 20 25 F ail ure stre ng th (kPa) Amount of cornsilk (kg/m3) W50C30 (strain) W50C35 (strain) W50C40 (strain) W50C30 W50C35 W50C40 0 4 8 12 16 0 50 100 150 200 0 10 20 F ail ure stre ng th (kPa) Amount of cornsilk (kg/m3) W60C30 (strain) W60C35 (strain) W60C40 (strain) W60C30 W60C35 W60C40
21 2.5.2. Splitting Tensile Strength
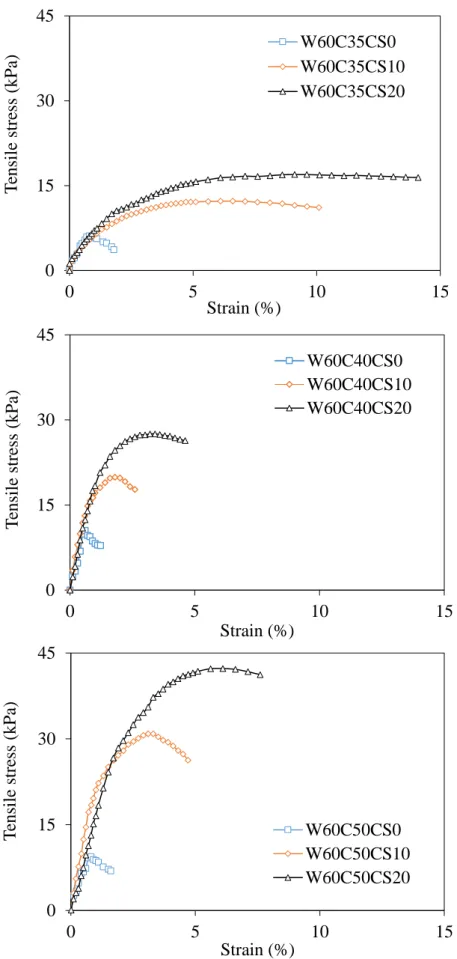
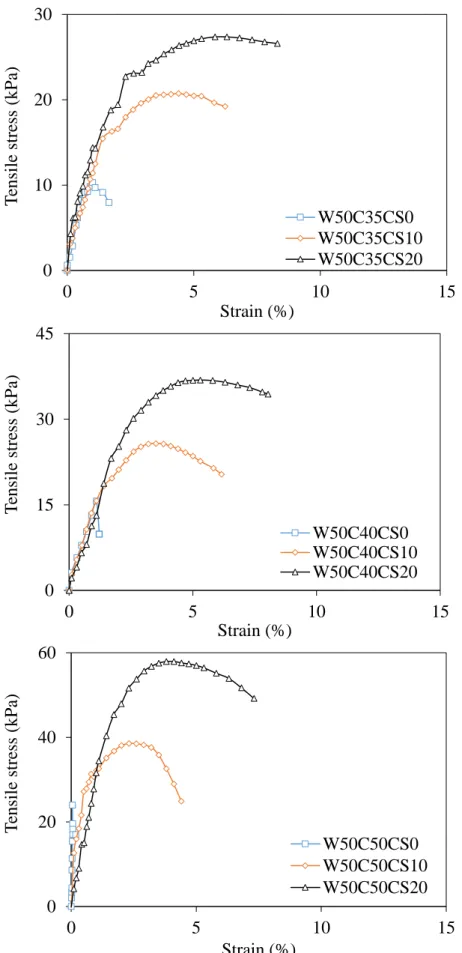
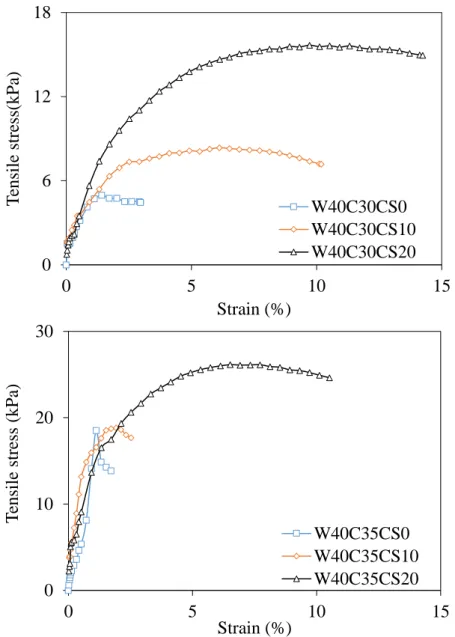
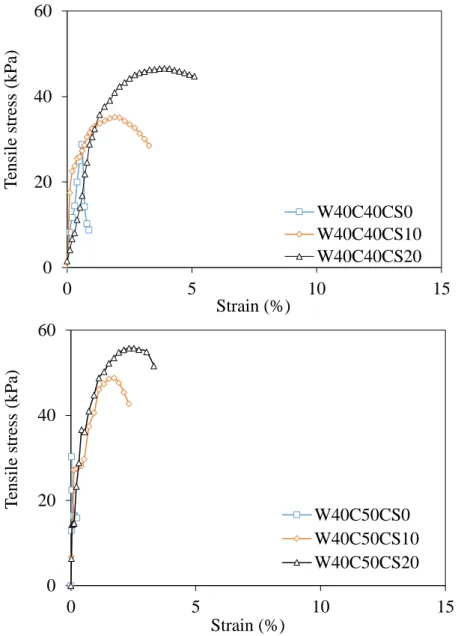
The typical stress-strain curves of each mixture obtained from splitting tension test are shown in Fig. 2. 10 to Fig. 2. 12. As can be clearly seen in these figures, the effect of cornsilk fiber addition in cemented sludge could be described as follows. (1) Splitting tensile strength of reinforced specimens improved when fibers were included. (2) Specimens reinforced with cornsilk fibers had a higher tensile strain in comparison to unreinforced specimens. Ref. [1]
mentioned that ductility property can be defined by tensile strain parameter. It meant that the reinforced specimens were more ductile than unreinforced specimens. (3) The loss of post-peak strength decreased with increasing fiber content, which led to the limit of suddenly structural failure. (4) Initial tangent modulus (initial slope of stress-strain curve) representing for stiffness property can be easily observed, the results indicated that the effect of fiber on initial tangent modulus in fiber-cement sludge was insignificant. In other words, the addition of cornsilk fibers did not influent on improving the stiffness property of cemented sludge. These results are consistent with Ref. [31].
In addition, to quantify the effect of fiber content in increasing the splitting tensile strength of cemented sludge, the failure tensile strength, which could be defined as peak strength point of stress-strain curves, was determined. Fig. 2. 13 to Fig. 2. 15 plot the failure tensile strength versus fiber content at different levels of cement content and water content. As can be seen, the failure tensile strength considerably increased when the fiber content raised. The highest improvement of tensile strength was 327.8% with respect to specimen of W60C50F20. The increase of tensile strength is due to the increase of bonding strength in the fiber- cemented soil
22
Fig. 2. 10 Stress-strain curves at water content of 60% with variations of fiber and cement content 0 15 30 45 0 5 10 15 T ensil e stre ss (kPa) Strain (%) W60C35CS0 W60C35CS10 W60C35CS20 0 15 30 45 0 5 10 15 T ensil e stre ss (kPa) Strain (%) W60C40CS0 W60C40CS10 W60C40CS20 0 15 30 45 0 5 10 15 T ensil e stre ss (kPa) Strain (%) W60C50CS0 W60C50CS10 W60C50CS20
23
Fig. 2. 11 Stress-strain curves at water content of 50% with variations of fiber and cement content 0 10 20 30 0 5 10 15 T ensil e stre ss (kPa) Strain (%) W50C35CS0 W50C35CS10 W50C35CS20 0 15 30 45 0 5 10 15 T ensil e stre ss (kPa) Strain (%) W50C40CS0 W50C40CS10 W50C40CS20 0 20 40 60 0 5 10 15 T ensil e stre ss (kPa) Strain (%) W50C50CS0 W50C50CS10 W50C50CS20
24
Fig. 2. 12 Stress-strain curves at water content of 40% with variations of fiber and cement content 0 6 12 18 0 5 10 15 T ensil e stre ss(kP a) Strain (%) W40C30CS0 W40C30CS10 W40C30CS20 0 10 20 30 0 5 10 15 T ensil e stre ss (kPa) Strain (%) W40C35CS0 W40C35CS10 W40C35CS20
25
Fig. 2. 12 (cont.) Stress-strain curves at water content of 40% with variations of fiber and cement content 0 20 40 60 0 5 10 15 T ensil e stre ss (kPa) Strain (%) W40C40CS0 W40C40CS10 W40C40CS20 0 20 40 60 0 5 10 15 T ensil e stre ss (kPa) Strain (%) W40C50CS0 W40C50CS10 W40C50CS20
26
Fig. 2. 13 The effect of fiber content on failure tensile strength at water content of 60% with variations of fiber and cement content
Fig. 2. 14 The effect of fiber content on failure tensile strength at water content of 50% with variations of fiber and cement content
0 20 40 60 0 5 10 15 20 F ail ure tensil e stre ng th (kPa) Fiber content (kg/m3) W60C35 W60C40 W60C50 0 20 40 60 0 5 10 15 20 F ail ure tensil e stre ng th (kPa) Fiber content (kg/m3) W50C35 W50C40 W50C50
27
Fig. 2. 15 The effect of fiber content on failure tensile strength at water content of 40% with variations of fiber and cement content
2.5.3. The Relationship Between Failure Strength And Parameters Affecting On Strength Characteristics
In this part, the relationship between the failure strength ratio ( σf,c/σc) and terms of three parameters (the water content (W%), the cement content (C%), and the fiber content (F%)) is considered. Where, σf,c and σc are the failure strength with fiber inclusion and without fiber inclusion at the same mixing conditions, respectively.
Fig. 2. 16 shows the relationship between (σf,c/σc) and C/F and the fitted curve for σf,c/σc ratio as a function of C/F ratio. It can be observed that C/F ratio had a significant effect on σf,c/σc ratio. A quite good correlation as “Eq. (2. 3)” with a correlation coefficient of 0.74 can be seen in Fig. 2. 16. f,c c 0.3 1.7 C F (2. 3) 0.4 c 5 c 9 0. f, 11.11 W C F (2. 4) 0 25 50 75 0 5 10 15 20 F ail ure tensil e stre ng th (kPa) Fiber content (kg/m3) W40C30 W40C35 W40C40 W40C50
28
Fig. 2. 16 Correlation of 𝜎𝑓,𝑐/𝜎𝑐 and C/F
Fig. 2. 17 Correlation of σf,c/σc and W(C/F)0.5
Fig. 2. 18 Correlation of 𝜎𝑓,𝑐 and F 0.5 1.5 2.5 3.5 0 2 4 6 8 σf,c /σc C/F 0.5 1.5 2.5 3.5 0 50 100 150 σf,c /σc W(C/F)0.5(%) 0 100 200 300 0 0.6 1.2 1.8 σf,c (kPa) F (%)
29
Fig. 2. 19 Correlation of 𝜎𝑓,𝑐 and C
Fig. 2. 20 Correlation of 𝜎f,c and C/W
Fig. 2. 17 shows the experimental data and fitted curve for σf,c/σc ratio as a function of W(C/F) 0.5 ratio. As a result, a better function as “Eq. (2.4)” following the term of W(C/F) 0.5 for describing failure strength ratio was found with a correlation coefficient of 0.78.
Consoli et al. [33] found some parameters such as cement content, porosity, etc. affecting noticeably on failure strength of cemented soil reinforced with synthetic fiber. However, the amount of fiber content was fixed at 3%. Therefore, it is quite difficult to determine the effect of fiber inclusion. In addition, there is no research on the parameters as water, cement, and fiber content controlling the failure strength of cemented soil reinforced with natural fibers. Therefore, this section also evaluates the relationship between failure strength and parameters such as water, cement, and fiber content with different levels of water, cement, and fiber content.
0 100 200 300 0 0.5 1 1.5 2 2.5 3 σf,c (kPa) C (%) 0 100 200 300 0 0.01 0.02 0.03 0.04 0.05 0.06 σf,c (kPa) C/W
30 2 f,c .9 0.1e C 69.9 (2. 5) 155.0 f,c 0.1e 68.0 C W (2. 6) 0.02 155.7 f,c 0.1e 67.0 C F W (2. 7)
The present work considers the correlation of failure strength with fiber inclusion (σf,c) and parameters as W, C, F, C/W, C/F, and F/W. It was confirmed through analysis that there was no correlation between σf,c ratio and parameters of 𝑊, 𝐹, C/F, and F/W. A presentative case for no correlation was between σf,c and 𝐹 as shown in Fig. 2. 18. Meanwhile, Fig. 2. 19 and Fig. 2. 20
show the experimental data and fitted curve for σf,c as a function of C and C/W, respectively. It is clearly observed that there was a weak relationship of σf,c and C following “Eq. (2. 5)” with
correlation coefficient of 0.59. A strong association with a coefficient value of 0.762 is σf,c and C/W as “Eq. (2.6)”.
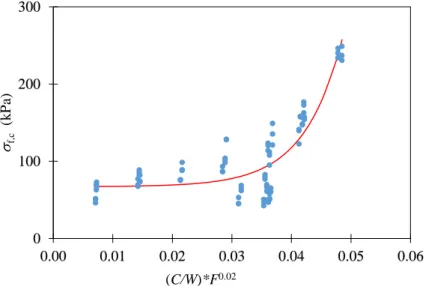
Besides, an equation following three variables including W, C, and F for using in the pre-feasibility study of real construction works such as predicting the failure strength of modified soil should be proposed. As can be seen in Fig. 2. 21, a quite good equation “Eq. (2. 7)” with a correlation
coefficient of 0.764 is proposed for predicting failure strength of cemented sludge reinforced with cornsilk fiber.
Fig. 2. 21 Relationship of 𝜎f,c and (C/W)F0.02 0 100 200 300 0.00 0.01 0.02 0.03 0.04 0.05 0.06 f,c (k P a) (C/W)*F0.02
31 2.6. Conclusions
A series of experiments was carried out to investigate the effect of cornsilk fiber on cemented sludge stabilization. The effect of fiber addition with variations of water, cement, and water content on unconfined compressive strength, splitting tensile strength, stiffness, and ductility was evaluated. In addition, the effect of parameters such as W, C, F, C/W, C/F, and F/W, etc. on (σf,c) and σf,c/σc ratio was examined. According to experimental results in the present work, it can be concluded as follows.
The addition of fiber in cemented sludge caused the increase of failure strength in general. The most efficient increases in failure strength for W40 with C5-C20, W50 with C30-C40, and W60 with C30-C40 were 190.6%, 43.8%, and 85.9%, respectively. For tensile strength, the most effective influence of fiber inclusion in increasing tensile strength is 327.8% respected to W60C50F20. Fiber inclusion caused the change of cemented sludge behavior from brittle to ductile. The failure strength and ductile behavior increased with increasing the amount of fiber. The effect of fiber addition on stiffness property was based on the amount of cement. When a large amount of cement used, fiber inclusion caused a decrease of stiffness. Meanwhile, stiffness increased by using a small amount of cement.
The failure strength of cement stabilized sludge reinforced with cornsilk fiber had a weak and strong correlation with the term of C and C/W, respectively. The failure strength ratio with and without fiber inclusion could be significantly described as functions following C/F ratio and the term of W(C/F)0.5. In addition, the equation described as a function of the term of (C/W)*F 0.02 can be used for predicting failure strength of modified sludge.
These conclusions mean that it is possible for using cornsilk fiber in cemented sludge reinforcement to improve mechanical properties. It is significant for points of view on engineering, economic, and environment. Furthermore, the number of research works studied on natural fiber is limited. Therefore, cornsilk fiber should be considered to study and use for modifying soft soil or sludge in future.
CHAPTER 3
EFFECT OF WASTE CORNSILK
FIBER REINFORCEMENT ON
MECHANICAL PROPERTIES OF
32
Chapter 3. Effect of Waste Cornsilk Fiber Reinforcement on
Mechanical Properties of Soft Soil
3.1. Introduction
Nowadays, good land resources are not enough to adapt to the growth rate in infrastructure, so many construction works have to build in soft soil areas. To conduct a construction project on weak soil area, a common solution to improve that area is the removal and replacement of soft soil, but the construction cost of this solution is very high. Currently, a good solution to deal with these problems is soil stabilization. There are three groups in soil stabilization, that is chemical stabilization [34–36], mechanical stabilization [12,37,38], and chemical-mechanical stabilization
[7,10,14,15,18,30,33,39,40]. In these three groups, soil reinforced with synthetic or natural fibers is classified as mechanical stabilization group, this is a developed technique for enhancing strength behavior of soil [6,23,32,41–43]. This technique has four main advantages composed of simply mixing, limiting potential planes of weakness, only changing physical properties, and no impact on the environment compared with conventional geosynthetics [19].
In fiber reinforced soil, the kind of fiber plays a significant role in soil stabilization properties because the different fiber types lead to the differences in physical properties of fibers (e.g. length, diameter, surface, water absorption) which affect mechanical properties of fiber reinforced soil. According to original properties, fibers are divided into two groups including synthetic fibers and natural fibers. Many researchers have recently studied the synthetic fibers in soil reinforcement such as polypropylene, cotton, nylon, etc. [1,3,44,45] due to its uniformity and reproducibility. Nevertheless, from the viewpoint of the environment, waste natural fibers should be widely utilized due to its renewal and sustainability. In addition, the surface of the synthetic fibers is smooth; it results in weak bonding surface in soil stabilization. In contrast, natural fibers have the rough surface, which produces better bonding strength of fiber and soil particles in the fiber-soil matrix. Some kinds of natural fibers have been demonstrated that they showed good performance in soil stabilization such as jute, coir, straw, etc. [5,46,47]. Recently, Tran et al.,[48] proposed to use new waste natural fiber in cemented sludge stabilization. Their research focused on the effect of cornsilk fiber on compressive strength, stiffness, and ductility of cemented sludge. The results showed that the addition of cornsilk fiber in cemented sludge resulted in the increase in compressive strength and ductility. Besides, the results also indicated that the increase or decrease of stiffness is based on the amount of cement used. However, there is no report on the effect of cornsilk fiber only in soil for improving mechanical properties such as compressive strength,
33
tensile strength, tensile toughness, etc. For this reason, the effect of cornsilk fibers in soil stabilization should be concerned.
The aims of this study are to examine the effect of cornsilk fibers with variations of fiber length and fiber content on mechanical properties of reinforced soil including the optimum water content, the maximum dry unit weight, the unconfined compressive strength, the splitting tensile strength, the ductility, the stiffness, and the toughness.
3.2. Materials
3.2.1. Soil
A large amount of soil is necessary to conduct systematic experiments, so the imitation soil is used in this study. The soil used in this chapter is same as chapter 2.
3.2.2. Fiber
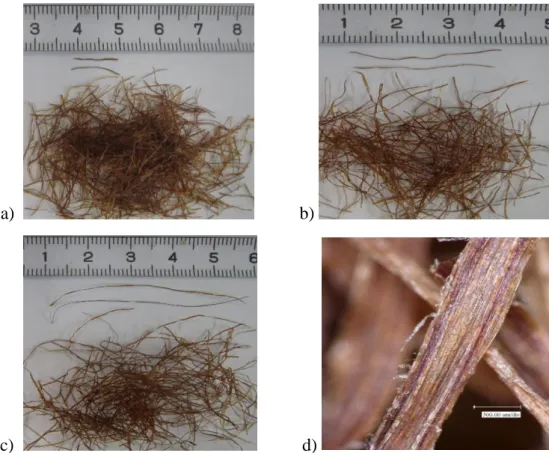
Raw cornsilk fibers were provided by Thanh Binh Company Vietnam. To prepare fiber material for making specimens, at first, raw cornsilk fibers were washed with tap water. After that, cornsilk fibers in bundle form were cut into three different lengths at 10 mm, 30 mm, and 50 mm, approximately. Finally, cornsilk fibers were dried in oven machine at 40 degrees Celsius for 24 hours. The diameter, water absorption, and tensile strength of cornsilk fibers are approximately 0.3 mm, 4 cc/g, and 8.3 MPa, respectively. Fig. 3. 1 shows fiber material used in this study after drying.
34
a) b)
c) d)
Fig. 3. 1 Cornsilk fibers used in this investigation: (a) 10 mm long; (b) 30 mm long; (c) 50 mm long; (d) micrograph of cornsilk with 200X.
Although the bundles of fibers were cut into three different fiber lengths, it is very difficult to control the length of every single fiber after cutting. Therefore, 500 fiber samples of each chopped length (10 mm, 30 mm, and 50 mm) were randomly selected to measure the fiber length. The frequency of fiber length and average lengths with respect to the chopped lengths are shown in
35
Fig. 3. 2 The frequency of fiber length after cutting: a) 10 mm; b) 30 mm; c) 50 mm. 0 50 100 150 200 2.5 5 7.5 10 12.5 15 17.5 20 No. of sa mpl e Lenght (mm) 0 50 100 150 200 10 15 20 25 30 35 40 45 50 No. of sa mpl e Lenght (mm) b) 0 50 100 150 200 0 10 20 30 40 50 60 70 80 90 100 No. of sa mpl e Length (mm) c) a)
36
Fig. 3. 3 The average lengths corresponding to chopped lengths. 3.3. Specimen Preparation
26 mixtures were prepared according to the mixing conditions as shown in Table 3. 1. Mixing conditions for the tests for both compression test and splitting tension test. The specimens were made at optimum water content and maximum dry density with respect to each mixing condition. The procedure to make specimens for testing was as follows. At first, the soil was mixed with fibers by hand to get the homogeneous mixtures. Then, water was added and mixed again by the mixing machine to get the uniform mixtures. Finally, specimens were made by compacting the fiber-soil mixtures at four layers in the mold of 100 mm in height and 50 mm in inner diameter. These specimens will be immediately subjected to the compression and tension tests. For each mixture, three specimens were made to make sure of the accuracy of results achieved from the tests. 0 15 30 45 60 10 30 50 A ve ra g e leng th of 50 0 sa mpl es (mm) Chopped length (mm)
37
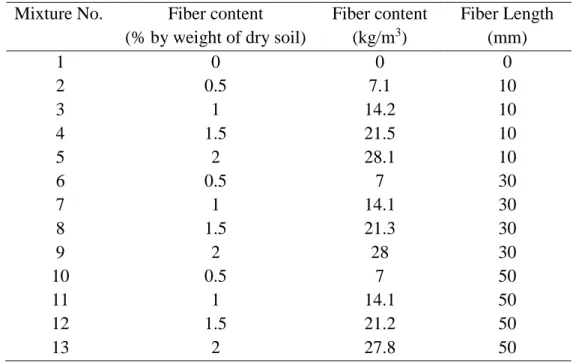
Table 3. 1 Mixing conditions for the tests Mixture No. Fiber content
(% by weight of dry soil)
Fiber content (kg/m3) Fiber Length (mm) 1 0 0 0 2 0.5 7.1 10 3 1 14.2 10 4 1.5 21.5 10 5 2 28.1 10 6 0.5 7 30 7 1 14.1 30 8 1.5 21.3 30 9 2 28 30 10 0.5 7 50 11 1 14.1 50 12 1.5 21.2 50 13 2 27.8 50 3.4. Testing program
Compaction test was conducted according to ASTM D 698 [49] with the mold and the rammer. The mold has 127 mm in height and 100 mm in inside diameter and the rammer has the weight of 2.5 kg and the falling height of 300 mm. Distilled water was used in this test.
Unconfined compression test (UCT) was carried out according to ASTM D 2166 [27]. The compression machine with a maximum load of 2 kN and an axial displacement rate of 1 mm/min was used for this test. the maximum strain value was limited to 15% following ASTM D 2166
[27].
Splitting tension test was conducted by using the compression machine and an additional part. The additional part is a pair of loading strips. The loading strips are 5 mm thick, 120 mm long and 10 mm wide. The specimen installed in the modified test machine is shown in Fig. 3. 4. The tensile strength is determined by Eq. ( 3. 1).
t 2P/ ( DL)
( 3. 1)
Where: t is the tensile strength, P is the compressive force, D is the specimen diameter, and L is the specimen length.
38
a) b)
Fig. 3. 4 Modified UCT machine using for splitting tension test. a) before testing; b) after testing 3.5. Results and Discussion
3.5.1. Compaction behavior
The mechanical properties including optimum water content (OWC) and maximum dry unit weight (γd) were investigated based on the compaction test. The optimum water content is the water content at which soil mixture can be compacted to maximum dry density.The influence of fiber content with different fiber lengths on OWC and γd were shown in Fig. 3. 5 and Fig. 3. 6. It can be observed that the addition of fibers with the fiber content increasing from 0.5 to 1.5% resulted in the increase of γd and the decrease of OWC. This may happen due to the reduction of the voids in the fiber-soil matrix. Further increasing the fiber content (2%), OWC and γd increased and decreased, respectively. A reasonable explanation for the decrease of γd was that fibers presenting in the matrix stuck together to the form lumps which caused pockets of low density in the matrix [6]. Besides, the presence of water in the form lumps and the effect of water absorption of fibers make a contribution to increase OWC. In addition, the effect of fiber length on γd and OWC can be also seen in Fig. 3. 5 and Fig. 3. 6, as fiber length increased, γd and OWC declined and increased, respectively. It was attributed that the longer fibers were, the easier fibers stuck together to form lumps which led to the decrease in γd and the increase in OWC as explained above.
39
Fig. 3. 5 The effect of fiber content on OWC
Fig. 3. 6 The effect of fiber content on γd 3.5.2. Compressive strength behavior
Fig. 3. 7 showed the representative stress-strain curves of all mixtures from compression test. It can be clearly observed that the stress-strain curves of specimens without fiber inclusion showed the peak stress point before limited strain value of 15%. On the other hand, for specimens with fiber inclusion, the stress-strain curves were still increasing after obtaining the limited strain and the stress value at limited strain was higher the peak stress of unreinforced specimens. It meant that the addition of fibers enhanced compressive stress as well as strain. This result was consistent with the pronouncement in previous studies using different kinds of fiber [16,17,19,32,50]. From the stress-strain curve results, It can be pronounced that specimens with fiber inclusion were more ductile than that without fiber inclusion because Estabragh et al., (2012) mentioned that ductility is defined as the strain value at the peak stress point of the stress-strain curve. The improvement
29.0 30.0 31.0 32.0 0.0 0.5 1.0 1.5 2.0 OW C (% ) Fiber Content (%) Fiber Length = 10mm Fiber Length = 30mm Fiber Length = 50mm 12.8 12.9 13.0 13.1 13.2 13.3 0.0 0.5 1.0 1.5 2.0 γd (kN /m 3) Fiber Content (%) Fiber Length = 10mm Fiber Length = 30mm Fiber Length = 50mm