Crystal Growth and Anisotropic Thermoelectric
Properties of Layer-Structured Yttrium
Borosilicide and Related Materials
(層状ホウケイ化イットリウム及び関連物質の単結晶
育成と異方的熱電特性)
PhD Dissertation
Special Doctoral Programfor Green Energy Conversion Science and Technology Interdisciplinary Graduate School of Medicine and Engineering
University of Yamanashi
March, 2016
MD. ANWAR HOSSAIN
Bismillahir Rahmanir Rahim
Dedicated to my beloved Daughter
Nafisa Anjum Luba
I
CONTENTS
CONTENTS ICHAPTER 1
Introduction
1.1 Introduction 11.1.1 Background of the research 1
1.1.2 Purpose of the research 13
1.2 Plan of the Thesis 13
References 14
CHAPTER 2
Anisotropy of High Temperature Thermoelectric Properties of
Yttrium Borosilicide Single Crystals Grown by Floating zone
Method
2.1 Introduction 18
2.2 Experimental details 20
2.3 Results and discussion 22
2.3.1 Crystal growth and characterizations 22
2.3.2 Thermoelectric properties 32
2.4 Conclusion 39
II
CHAPTER 3
Crystal Growth and Thermoelectric Properties of YB48, Metal
Rich Boundary of YB66
3.1 Introduction 42
3.2 Experimental details 43
3.3 Results and discussion 45
3.3.1 Crystal growth of YB48 45
3.3.2 Chemical analysis and XRD 47
3.3.3 Thermoelectric measurements 54
3.3.4 Hall measurement of YB48 61
3.4 Conclusion 67
References 68
CHAPTER 4
Anisotropy of High Temperature Thermoelectric Properties of
Brownmillerite M2Fe2O5 (M=Ca, Sr) Single Crystals
4.1 Introduction 73
4.2 Experimental details 80
4.3 Results and discussion 81
4.3.1 Crystal growth and characterization 81
4.3.2 Thermoelectric properties 86
4.4 Conclusion 92
III
CHAPTER 5
Summary and Impact of the Current Research
5.1 Summary 96
5.2 Impact of the current research 101
APPENDIX
List of Publications Related to This Study 104
1
CHAPTER 1
Introduction
1.1 Introduction
1.1.1 Background of the research
Energy growth is directly related to well being and prosperity of the whole human civilization. Over the worldwide, researchers are trying to meet the growing demand of energy in a safe and environment friendly manner. Enhancement to the existing energy supply must come from a variety of renewable energy sources including solar, wind, biomass, and others. From the energy and environment point of view, new power generation systems such as photovoltaic cells, solar power generation, wind power generation, geothermal generation, and tidal power generation are developing with great expectations [1]. The spread of such new power generation did not progress distinctly due to not only technical issues but also initial cost, running cost, investment recovery, etc. The various technologies of heat storage and transport have been developing. However, since most sources of waste heat are widely and thinly dispersed, it is difficult to use such heat energy efficiently. Electricity is a convenient form of energy in points of view of transportation, storage and conversion. Thus, the direct conversion of waste heat to electricity has placed high expectations. The waste heat is widely dispersed and can be found in the temperature region from 323 K to higher than 1273 K. Thermoelectric generation is one of the strongest candidates for recovering the
2
waste heat from industry and transportation. In the last decade, a lot of research has been carried out to find out new highly efficient thermoelectric materials for electronic cooling and power generation [2-7]. Direct conversion of heat into electricity through thermoelectric materials could be one of the most attractive solutions to energy issues in near future. Fig.1 shows the schematic presentation of direct conversion of waste heat to electricity by thermoelectric conversion.
Fig.1 Schematic presentation of thermal management of waste heat rejected from power plant, automobiles, factories, incinators, etc. [collected from T. Mori].
3
Thermoelectric modules are solid state devices in which both n- and p-type materials are required to convert heat into electricity based on the Seebeck effect, which is the appearance of an electrical voltage caused by a temperature gradient between two points in a material. Fig. 2 shows schematic diagrams of Seebeck effect and thermoelectric devices. The inverse of Seebeck effect is called Peltier effect in which temperature gradient can be obtained by the application of voltage between two points in a material. Fig. 3 shows the schematic diagram of thermoelectric module for power generation in which thermoelectric elements are connected by metal interconnections. The top substrate absorbs heat and bottom substrate used as heat sink and the converted heat to electricity can be collected by the external electrical connections as shown in Fig. 3. Thermoelectric device performance directly depends on the temperature gradient (ΔT) and intrinsic material parameter called dimensionless figure of merit (ZT). The thermoelectric efficiency is defined by combining the Carnot efficiency
(ΔT /TH)= ቀ்ౄ்ି்
ಹ ቁ and the figure of merit ZTm as presented in equation (1),
η = (߂ܶ /ܶୌ) ቈඥଵା்ିଵ
ඥଵା்ାౄౙ (1)
where TH and TC are the hot- and cold-side temperatures, respectively, Tm is the
mean temperature, and ZTm is mean value of the figure of merit between the hot
and cold side temperature of the materials. Therefore, considering TC as room
temperature (300 K), the higher the hot-side temperature (TH), the greater the
thermoelectric conversion efficiency, over and above the ZT values of the materials. Fig. 4 represents the variation of conversion efficiency with hot side temperature for power generation. ZT = 1 corresponds to 5% conversion
4
efficiency at TH = 400 K and almost 15% conversion efficiency at TH = 900 K
considering TC = 300 K.
(a) Seebeck effect
(b) Thermoelectric devices
Fig. 2 Schematic diagrams of Seebeck effect and thermoelectric devices for power generation and cooling applications.
Heat Source
Heat Sink
Power Generation
Heat Absorbed
Heat Emitted
Heating or Cooling
Thermo couple S = ΔV/ΔT Seebeck coefficient5
Fig. 3 Schematic diagrams of thermoelectric module for power generation.
Fig. 4 The variation of conversion efficiency with hot side temperatures of TE materials.
Hot side temperature (K)
200 400 600 800 1000 1200 1400 1600 C o n v er si o n e ff ic ie n cy ( % ) 0 10 20 30 40 50 60 0.5 1.0 2.0 3.0 4.0 10 ZTm=0.5
6
This clearly indicates that stability at high operation temperature is equally important as high ZT values of the thermoelectric materials to achieve greater heat to electrical energy conversion efficiency. Ideal thermoelectric materials are indispensable to thermoelectric power generation. However, these materials should have not only a high figure of merit but also high chemical stability and should not contain harmful elements. Recently the oxides-based thermoelectric materials have been attracted wide-spread due to their thermal and chemical stability at high temperature and thus can be used in a large temperature gradient in air. The range of operating temperature for some thermoelectric material systems are presented in Table 1. Oxides could operate at much higher temperature than the traditional thermoelectric materials. They are also environmentally friendly and cost-effective.
Table 1: Range of operating temperature of some thermoelectric materials (collected from Thermoelectric Society of Japan)
Research ongoing in Japan
Layered Oxides
7
The dimensionless thermoelectric figure of merit, ZT is composed of three physical properties of the materials: the Seebeck coefficient S, electrical conductivity σ, and thermal conductivity ߢ.
ܼܶ = ௌమఙ் (2)
where T is the absolute temperature. These three parameters are determined by the details of electronic structure and scattering of charge carriers (electrons and holes), and thus are not independently controllable. The quantity ܵଶߪ is called the power factor and is the key to achieving high performance. It is obvious from equation (2) that high ZT can be achieved by improving the Seebeck coefficient and electrical conductivity while reducing thermal conductivity as much as possible. Electrical conductivity of thermoelectric materials can be expressed as ߪ = ݊݁ߤ, where n is the density of charge carriers, e is the electronic charge of unit carrier, and µ is the mobility of charge carriers. The electrical conductivity can be significantly improved through chemical doping. Each dopant atom can have more or less valence electrons than its host atoms and hence can increase the density of charge carriers. At the same time the dopant can also reduce the mobility of the charge carriers due to the enhanced scattering between dopants and carriers. The Seebeck coefficient depends on electron density of states and by doping impurities it can be improved [8].
S =଼మಳమ
ଷమ ݉∗ܶ ቀଷቁ
ଶ/ଷ
8
According to equation (3), Seebeck coefficient is mainly controlled by the carrier concentration and effective mass of the charge carriers (݉∗), which usually decreases with increasing carrier mobility.
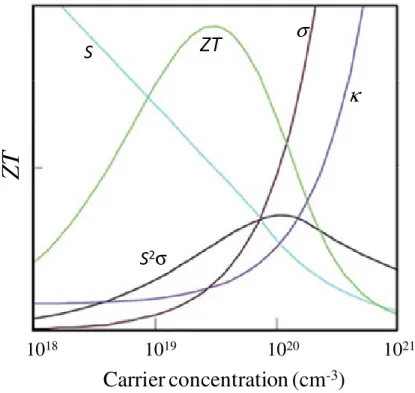
Fig. 5 shows the dependence of ZT and the other thermoelectric parameters on carrier concentration for single parabolic band and acoustic phonon scattering. As the carrier concentration is lowered, say in the case of an insulator, the Seebeck coefficient becomes quite high, but the electrical conductivity is lowered significantly, resulting in poor ZT. For high carrier concentration (as in a metal), the electrical conductivity is high, but the Seebeck is lower. For this reason, ZT and power factor (ܵଶߪ) are usually optimized in the 1019-1020 cm-3 range (usually described as a heavily doped semiconductor).
Fig. 5 Carrier concentration dependence of ZT and other thermoelectric properties.
1018 1019 1020 1021
ZT
S2σ σ κ SCarrier concentration (cm
-3)
Z
T
9
In a crystalline solid, heat can be carried by charge carriers, represented as the electronic contribution ߢ and by lattice vibrations, denoted at the lattice component ߢ. The total thermal conductivity (ߢ) is the overall contribution of the electronic and lattice components and can be written as ߢ = ߢ + ߢ . The electronic contribution depends on the charge carriers concentration and is related with to the electrical conductivity (σ) through the Wiedemann-Franz law:
ߢ = ܮߪܶ, where L is the Lorenz number. Typically, the Lorenz number is taken to be 2.45×10⁻⁸ WΩK-2 for metals and degenerate semiconductors, however it can vary depending on temperature and materials [9].The lattice thermal conductivity corresponds to transfer of vibrational energy from one atom to next, considered as the propagation of a wave. The quantization of vibrational waves is called a phonon. Phonons are regarded to be the energy carriers responsible for heat conduction in a lattice. The lattice vibration is independent of the carrier concentration and is observed in all crystalline solids, regardless of whether they are metals, semiconductors, or insulators. Thermal conductivity can be reduced by enhancing phonon scattering (i.e., phonon-boundary scattering, phonon-defect scattering, and phonon-phonon scattering). The idea of a crystal with a glass-like thermal conductivity was first introduced by Slack [10]. It is well known that a glass or an amorphous substance has the lowest range of thermal conductivity of any type of materials. It is, perhaps, strange to refer to a lattice conductivity in a material that does not have a crystal structure but it is convenient to use this term for the non-electronic contribution. If we attempt to use ߢ = ܥݒ݈௧/3 to describe this lattice thermal conductivity, inserting measured values for the specific heat and speed of sound, we find that the free path length for the phonons is equal to
10
the diameter of each atom. There will be vibrations in the thermal conductivity from one glass to another due to variation in ݒ and ܥ but the range is very small around an average value of about 0.25 W/m.K [11]. This contrasts with the lattice conductivity in crystals, which can vary over several orders of magnitude. Amorphous semiconductors are unlikely to be good thermoelectric materials because they invariably have very small values for the electrical conductivity, stemming low carrier mobilities. It is just possible that an amorphous material might prove useful if the low mobility is compensated by a high density of states effective mass. Despite the linear dependence of the power factor on electrical conductivity it is not always better to have a very high conductivity because this increases the electronic contribution of thermal conductivity according to Wiedemann-Franz law. An effective way to maximize the figure of merit (ZT) is to manipulate the lattice thermal conductivity, which is the only parameter not determined by the electronic structure. All other parameters, such as electrical conductivity and thermoelectric power, are correlated with the electronic structure of the material and thus, in most cases, cannot be optimized independently. According to the above description, Seebeck coefficient, electrical conductivity and thermal conductivity are strongly dependent on each other, and it is very challenging to improve them simultaneously in bulk thermoelectric materials.
Boron cluster compounds are attractive candidates as high temperature thermoelectric materials for their stability and generally large Seebeck coefficients [12,13]. Furthermore, they typically exhibit low thermal conductivity [14-17], which is an inherent advantage for thermoelectrics, despite being strongly covalently bonded solids with high sound velocity. Several mechanisms have
11
been proposed to be the origin of this intrinsic low thermal conductivity [13,17,18]. Many of the boron cluster compounds take the variable range hopping transport (VRH) mechanism in which both electrical conductivity and Seebeck coefficient increase with temperature, which is an advantage for thermoelectric [13,19,20]. Another attractive feature of boron cluster compounds in general is that the network structures and physical properties have been found to be able to be controlled to some degree through incorporation of metal atoms in the voids of clusters, and also addition of third elements like C, N, Si which can act as bridging sites of the cluster framework [21,22].
Although many borides are being developed as thermoelectric materials [19,23-33], to our knowledge there has been no report regarding the anisotropy of thermoelectric properties of borides. The thermoelectric anisotropy of a rare earth borosilicide single crystal was investigated for the first time. As described in this work, while growing floating zone crystals of yttrium borosilicide I have made the accidental discovery of a strikingly metal-rich phase of YB66; YB47. Later, I
synthesized purposely YB48 and studied thermoelectric and transport properties. It
was reported that the homogeneity region of YB66 was YB56 to YB68 [34,35]. YB66
had been reported to be a poor thermoelectric material [36,37] but through thermoelectric measurements of this unexpectedly metal-rich phase (YB48) of
YB66 showed a 30 times higher ZT than conventional YB66, and takes a value of
approximately 0.1 at 990 K which is a promising start as a new high temperature material.
12
Although the oxide thermoelectric materials have some advantages over conventional TE materials such as Bi2Te3, they have lower ZT due to their
relatively higher thermal conductivity. Research interest in oxide-based TE materials was ignited when p-type NaCo2O4 with a ZT around one was discovered
[38]. Since then, some layered oxide materials have been predicted to show a reasonably high ZT if different kinds of layers (unit nanoblocks) with different compositions, and symmetries are integrated into hybrid crystals or superlattices, in which each layer can play its own role in realizing independent control of electrons and phonons. From the above discussion it is obvious that oxide materials with layered structured are promising for high temperature thermoelectric applications. Layered oxide structures could be used to achieve minimal thermal conductivity through increased phonon scattering introduced by the interfacial regions between layers. In brownmillerite type A2B2O5 structure the
layers of corner sharing BO6 octahedra alternating with layers of BO4 tetrahedra
averaged in parallel chains. Both Ca2Fe2O5 and Sr2Fe2O5 exhibit brownmillerite
structure and the oxygen vacancies ordering along [101] direction and the alternating layers of tetrahedral and octahedral stack in [010] direction of the unit cell. The brownmillerite structures exhibit p-type conductivity as they accommodate oxygen interstitials, where in iron-containing compounds the holes may be associated with Fe3+ cations, forming small polarons, to essentially produce a fraction of Fe4+ cations with a resulting stoichiometry described as Ca2Fe2O5+δ [39,40]. Due to the layered nature of brownmillerite structures, the
potential of the octahedral–tetrahedral interfaces to reduce thermal conductivity through phonon scattering exists. Kobayashi et al.[41]found transport within the
13
layers of Ca2-yLayCo2-xAlxO5 was 100 times higher than perpendicular to the
layers, thus pointing to the potential of the layers to scatter phonons. There is no report on anisotropy of high temperature thermoelectric properties of brownmillerite M2Fe2O5 (M=Ca,Sr). In this study besides yttrium borosilicide, I
also studied anisotropy of high temperature thermoelectric properties of M2Fe2O5
(M=Ca,Sr) single crystals grown by floating zone method.
1.1.2 Purpose of the research
The purpose of this study is to investigate the anisotropic thermoelectric properties of layer-structured materials such as yttrium borosilicide and brownmillerite M2Fe2O5 (M=Ca, Sr) single crystals. To study anisotropic
properties, good quality single crystals are needed. Firstly, the yttrium borosilicide and brownmillerite M2Fe2O5 (M=Ca, Sr) single crystalswere grown
by floating zone method. The growth directions of the grown crystals were determined by pole figure measurement and then anisotropic thermoelectric properties were measured and analyzed.
1.2 Plan of the thesis
The plan of this dissertation is as follows:
In the first chapter (CHAPTER 1) I have written a general introduction to the present work which provides the background and purpose of the current work.
I will discuss crystal growth, characterization and study of anisotropic thermoelectric properties of yttrium borosilicide (YB41Si1.3) single crystals in
14
CHAPTER 2. In the initial section I will provide some introduction about boron cluster compounds as high temperature thermoelectric materials.
In CHAPTER 3, I will describe the sudden discovery of YB48 single crystal
during crystal growth of yttrium borosilicide by floating zone method. I will also describe the thermoelectric properties of this metal rich YB66 single crystal.
In the beginning of CHAPTER 4, I will describe the importance of layered oxide materials in thermoelectric application. Then I will present anisotropic thermoelectric properties of brownmillerite M2Fe2O5 (M=Ca, Sr) single crystals
grown by floating zone method.
Finally, in CHAPTER 5 I will summarize all the results of this research. I will also write a short discussion on the impact of the current research.
References
[1] Funahashi, R.; Barber, T. and Combe, E., J. Mater. Res. 2014, 30(17), 2544. [2] Kim M. Y. and Oh T. S., J. Electron Mater. 2013, 42(9), 2752.
[3] Zhao, D. and Tan, G. Appl. Therm. Eng. 2014, 66(1–2), 15.
[4] Sharma, S.; Dwivedi, V. K. and Pandit, S. N., Int. J. Energy Res. 2014, 38(2), 213.
[5] Yoon, C. K.; Chitnis, G. and Ziaie, B., J. Micromech.Microeng.2013, 23(11), 114004.
[6] Jo S-E, Kim, M. S.; Kim, M. K and Kim, Y. J, Smart Mater. Struct. 2013, 22(11), 115008.
15
[8] Heremans, J. P.; Jovovic, V.; Toberer, E.S. et al, Science, 2008, 321, 554. [9] Kumar, G. S.; Prasad, G.; and Pohl, R. O., J. Mater. Sci. 1993, 28, 4261. [10] Slack, G. A., in CRC Handbook of Thermoelectrics, ed. By D. M. Rowe
(CRC Press, Boca Raton 1994), p. 407.
[11] Goldsmid, H. J., Introduction to Thermoelectricity, Springer series in materials science 121, p.76.
[12] Wood, C.; Emin, D. Phys. Rev. B 1984, 29, 4582.
[13] Mori, T. in: Modules, Systems, and Applications in Thermoelectrics, ed. Rowe, D. M, CRC Press Taylor and Francis, London 2012, 14.
[14] Slack, G. A.; Oliver, D. W.; Horn, F. H. Phys. Rev. B 1971, 4, 1714.
[15] Cahill, D. G.; Fischer, H. E.; Watson, S. K.; Pohl, R. O.; Slack, G. A. Phys. Rev. B 1989, 40, 3254.
[16] Mori, T. Physica B 2006, 383, 120.
[17] Mori,T.; Martin,J.; Nolas,G. J. Appl. Phys.2007,102, 073510. [18] Wang,X. J.; Mori,T.; Kuzmych-Ianchuk,I.; Michiue,Y.; Yubuta,K.;
Shishido,T.; Grin,Y.; Okada,S.; Cahill,D. G. APL Mater. 2014, 2, 046113. [19] Mori, T.; Berthebaud, D.; Nishimura, T.; Nomura, A.; Shishido, T.;
Nakajima, K. Dalton Trans.2010, 39, 1027. [20] Mott, N. F., J. Non-Cryst. Solids1968,1, 1.
[21] Mori, T., “Higher Borides” in Handbook on the Physics and Chemistry of Rare Earths, ed. K. A. Gschneidner Jr., J. -C. Bunzli, and V. Pecharsky (North-Holland, Amsterdam)2008, vol 38 p. 105.
[22] Mori, T., J. Phys. Conf. Ser. 2009, 176, 012036.
16
[24] Balaz, S.; Dimov, D. I.; Boag, N. M.; Nelson, K.; Montag, B.; Brand, J. I. and Dowben, P. A., Appl. Phys. A 2006, 84, 149.
[25] Gong, Y.,Zhang, Y.,Dudley, M.,Zhang, Y.; Edgar,J. H.; Heard, P. J.; Kuball,M., J. Appl. Phys. 2010, 108, 084906.
[26] Maruyama, S.; Miyazaki, Y.; Hayashi, K.; Kajitani, T.; Mori, T. Appl. Phys. Lett. 2012, 101, 152101.
[27] Sologub, O.; Matsushita, Y. and Mori, T. Scr. Mater. 2013, 68, 289.
[28] Frye, C.D.; Edgar, J.H.; Ohkubo, I.and Mori, T. J. Phys. Soc. Jpn. 2013, 82, 095001.
[29] Wan, L. F.; Beckman, S. P. Phys. B Condens. Matter 2014, 438, 9. [30] Miura, S.; Sasaki, H.; Takagi, K.;Fujima, T. J. Phys. Chem. Solids,2014,
75, 951.
[31] Mori, T.; Nishimura,T.; Schnelle, W.; Burkhardt, U.; Grin, Y. Dalton Trans.,2014, 43, 15048.
[32] Slack, G. A.; Morgan, K. E. J. Phys. Chem. Solids 2014, 75, 1054.
[33] Gürsoy, M,; Takeda, M,; Albert, B. J. Solid State Chem., 2015, 221, 191. [34] Tanaka, T.; Rek, Z. U.; Wong, J. and Rowen, M., J. Cryst. Growth, 1998,
192, 141.
[35] Slack, G. A.; Oliver, D. W.; Brower, G. D. and Young, J. D., J. Phys. Chem. Solids,1977, 38, 45.
[36] Golikova, O. A.; Amandzhanov, N.; Kazanin, M. M.; Klimashin, G. M. and Kutasov, V.V., Phys. Status Solidi A,1990, 121, 579.
17
[38] Terasaki, I.; Sasago, Y. and Uchinokura, K., Phys. Rev. B, 1997, 56, R12 685.
[39] Shaula, A.L.; Pivak, Y.V.; Waerenborgh, J.C.; Gaczynski, P.;
Yaremchenko, A.A.; Kharton, V.V., Solid State Ionics, 2006, 177(33–34), 2923.
[40] Zhou, H. D. and Goodenough, J. B., J. Solid State Chem., 2005, 178(12), 3679.
[41] Kobayashi, W.; Satake, A. and Terasaki, I., Jpn. J. Appl. Phys., 2002, 41 (1), 3025.
18
CHAPTER 2
Anisotropy of High Temperature Thermoelectric Properties of
Yttrium Borosilicide Single Crystals Grown by Floating Zone
Method
2.1 Introduction
The direct conversion of waste heat to electricity is a large incentive to find viable thermoelectric (TE) materials [1]. Many efforts are being made to find routes to enhance thermoelectric properties. One very recent interesting development was reported in Nature on crystals of tin selenide which showed the best thermoelectric properties ever reported, in one direction of the crystal [2]. The high temperature stability, high seebeck coefficients, and low thermal conductivity are essential for high temperature thermoelectric materials and boron cluster compounds exhibit these properties [3-7].
It has previously been reported that two new phases exist between the previously known phases of YB12 and YB66 [8] with composition of about
[B]/[Y]=25 and 50, respectively. Tanaka et al. has reported that crystal growth of the YB50 phase become possible by adding Si in the floating zone method and
19
orthorhombic system (space group Pbam) and is composed of B12 icosahedra and
B12Si3 polyhedral units. After the successful growth of YB41Si1.2 crystals, a lot of
research has been carried out on rare earth borosilicides, REB44Si2,to study
physical properties [6,7,10-21]. The REB44Si2 (RE = Tb, Er, Yb) compounds are
p-type like boron carbide and have been found to exhibit Seebeck coefficients in excess of 200 µVK-1 at high temperatures above 1000 K and also possess a low thermal conductivity of ~0.02 Wcm-1K-1[6,13]. A beneficial zinc doping effect was discovered for arc-melted yttrium borosilicides, YB44Si2 [10]. Tanaka et al.
investigated electrical resistivity and Seebeck coefficient of YB41Si1.2crystal from
77 K to room temperature and they also estimated the figure of merit using thermal conductivity of YB66 at room temperature and obtained very poor values
[12]. There is no literature available on high temperature thermoelectric properties of YB44Si2 single crystals. Regarding anisotropy, T. Mori has found magnetic
anisotropy to be indicated in Tb11B44Si2 and YbB45.6Si1.0 single crystals but with
no information obtainable on crystal orientations [16,20]. In this work, the high temperature thermoelectric properties of YB41Si1.3 single crystals grown by
floating zone method was investigated. For the first time, the crystallographic orientations of a borosilicide crystal were determined and the relatively large anisotropy in electrical properties were discovered along the determined directions.
20
2.2 Experimental details
Floating zone (FZ) crystal growth was employed to grow yttrium borosilicide YB41Si1.3 single crystals using a four-mirror-type infrared image furnace (Crystal
System Inc., FZ-T-10000-H-III-VPR) equipped with four 2.5 kW xenon lamps as heat source. The preparation process of the polycrystalline feed rods for FZ crystal growth is as follows; we mixed YB4 (New Metals Co. 99%), B (SB Boron
99.9%),and Si(Wako 99.9%) powders to obtain a desired final composition, then, pressed it into a rod at a hydrostatic pressure of 300 MPa. Rods having nominal composition YB44Si2 were prepared for both the feed rod and the seed rod to grow
crystals by the FZ method. The pressed rod was reacted in a boron nitride (BN) crucible fixed inside a graphite susceptor that was further covered with graphite wool for induction heating. The synthesis was carried out in an RF inductive furnace at 1400 °C for 8 h in vacuum. To obtain high density feed rods, the synthesized rods were grinded and formed again into rods and sintered at the same condition. FZ crystal growth was carried out by driving downward both feed and seed rods at 10 and 8mm/h, respectively, with counter-rotating at 16 rpm under Ar atmosphere (2.5 L/min).
The grown crystals were characterized by high-resolution powder X-ray diffraction (XRD) and electron probe microanalysis (EPMA).Powder XRD measurements with CuKα radiations (Rigaku Ultima-3) were performed to
confirm the required phase formation in the grown crystals, where parts of the crystals were crushed using a stainless steel mortar and then the obtained powder
21
was washed with HCl solution and rinsed with water to remove stainless steel contamination. Rietveld refinement was performed using FullProf Suite software (2.05).Peak shape was refined with the modified Lorentzian function and 6 coefficients polynomial function was used for background refinement. EPMA was carried out in wavelength-dispersive mode using JEOL JXA-8200 instrument. Standard sample used for Y and B were Y3Al15O12 and LaB6, respectively.
The crystallographic orientation of the YB41Si1.3 grown crystals were
characterized by pole figure measurements using an X-ray 2D-detector (Bruker Corp., model D8 DISCOVER VANTEC-500). Two cross-sections were taken, one was approximately perpendicular to growth direction and another one was parallel to growth direction of the grown crystal, for pole figure measurement. The crystal was cut using a diamond wire cutter and then polished the pieces with a diamond solution. The crystallographic orientations were determined from the obtained pole figure data by Multex 3 software.
For high temperature thermoelectric materials the stability at high temperature is essential. Therefore, to check the stability of the grown crystals at high temperature, we also carried out thermogravimetric analysis (TGA, Rigaku, model Thermo plus TG 8120) from 300 K to 1080 K in Ar flow as well as in air flow. Resistivity and Seebeck coefficient were measured with an ULVAC ZEM-2 in the temperature range of 330–1000 K in He atmosphere. To determine the thermal conductivity values, first of all, the room temperature specific heat was measured by using PPMS (Quantum Design, physical property measurement system). Then,
22
the relative specific heat and thermal diffusivity coefficient were measured by laser flash method (ULVAC TC-7000) from 300 K to 1080 K. The thermal conductivity is determined as the product of the density, specific heat, and thermal diffusivity coefficient.
2.3 Results and Discussions
2.3.1 Crystal growth and characterizations
The boron-rich boride compound YB50 which has an orthorhombic crystal
structure starts to decompose above 2100 K into phases like YB12 and YB66
without melting [22]. Tanaka et al. first demonstrated that the melt growth method is applicable to grow an yttrium borosilicide crystal, YB44Si1.0 that is iso-structural
to YB50 by adding a small amount of silicon [9,11]. Another interesting Si
addition effect was the enlargement of the lattice parameters which enabled synthesis of GdB44Si2, although GdB50 does not form due to the relatively large
size of Gd [23]. A view of the crystal structure of REB44Si2 is shown in Fig. 1.
The structure is orthorhombic with space group Pbam. Fig.2 shows the picture of a grown crystal. To grow high quality crystals, we used the zone pass technique. The first zone pass was made to obtain uniform composition and the second zone pass was made to grow the crystal.
Fig.3 shows powder X-ray diffraction pattern with Rietveld refinement of the grown crystal. Rietveld refinement for the YB41Si1.3 crystal data confirmed
23
YB6 phase was found (2nd row of black Bragg-position lines in Fig. 3).The lattice
parameters were obtained to be a = 16.6368 Å, b = 17.5846 Å, and c= 9.5079 Å, which are quite similar with YB44Si1.0 [9].
EPMA results revealed the atomic concentration of Y, B and Si to be 2.3±0.2 at%, 94.4±0.4 at% and 3.1±0.2 at%, respectively. The composition of the grown crystal was determined to be YB41Si1.3.
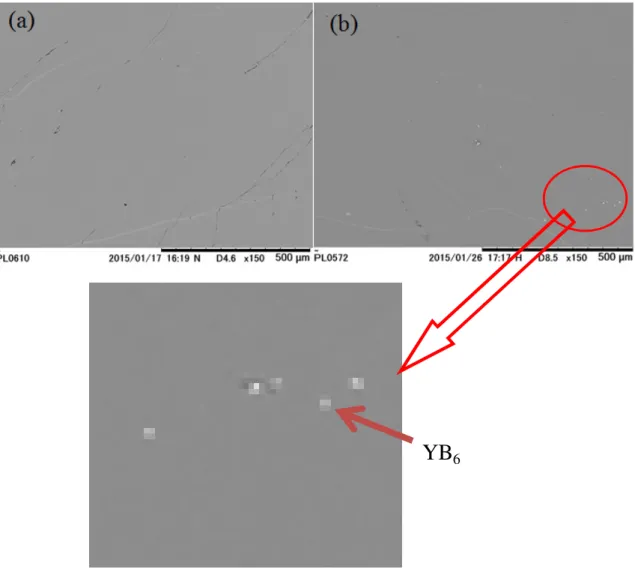
Fig. 4 (a, b) represents the SEM images ofYB41Si1.3 grown crystal for
cross-sections parallel to the growth direction and perpendicular to the growth direction and it was observed that in both cases there were no grain boundaries but some micro-cracks. Apparently, it is not possible to avoid microcracks in grown single crystals of this borosilicide phase. The grown crystals also contained a very small amount of inclusion (white spots) and we also confirmed by EDX that this inclusion is YB6. Amount of YB6 phase obtained from the Rietveld refinement
24
Fig. 1.View of the crystal structure of REB44Si2 from a direction slightly tilted
along [001] as indicated by the labels, two kinds of polyhedra are shown: B12
icosahedra and B12Si3 polyhedra. Only two of the five structurally independent B12
icosahedra are drawn for clarity. The circles indicate rare-earth (in this case, yttrium) atoms which are aligned along [001] in a ladder-like configuration.
B12 RE B12Si3
25
Fig. 2.YB41Si1.3 single crystal grown by the floating zone method
Fig. 3: Rietveld refinement of powder XRD pattern of YB41Si1.3 single crystal,
exhibiting good agreement between the observed and the calculated patterns. Rietveld refinement yielded 1.3(0.1) vol. % of YB6 phase.
26
In order to determine the growth direction of the YB41Si1.3 grown crystal, we also
took Laue XRD, however, due to the complicated structure and the weakness of the reflections, we were not able to determine the particular alignment of the crystals by Laue photography techniques. Figs. 5(a-d) represent the measured and simulated pole figures, from the measurements using an X-ray 2D-detector, of the cross sections perpendicular to growth direction (a, b) and parallel to the growth direction (c, d) for YB41Si1.3 grown crystal. As shown in Figs. 1(a) and (b), the
orientation of the cross-section perpendicular to growth direction is 11° tilted from [100] and toward [010]. By following the same procedure, the orientation of the cross section parallel to the growth direction was estimated to be 38° tilted from [010] toward [001]. The orientations of the cross-sections perpendicular to the growth direction and parallel to the growth direction were estimated by Q-Laue to be [510] and [052], respectively. The obtained directions [510] and [052] were not orthogonal and the angle between them was 81.4 degrees. This lack of orthogonality is likely due to cutting the cross-sections of YB41Si1.3 grown crystal
at a slightly tilted position with respect to the cross-section of the perpendicular to growth direction.
27
Fig. 4. SEM images for cross-sections of YB41Si1.3 single crystal along: (a)
parallel to growth direction and (b) perpendicular to growth direction
28
Fig.5. Measured and simulated pole figures of the cross sections perpendicular to growth direction (a, b) and parallel to the growth direction (c, d) for YB41Si1.3
crystal. The direction of rotation (Phi) was rotated 14°and 59°.
a
Psi=11° Phi=14°b
c
Psi=38° Phi=59°d
29
Determination of crystallographic orientation is the most important part prior to study directional physical properties of a crystal. Similar to yttrium, rare-earth metals from Gd to Lu can form REB41Si1.2-type borides. To my knowledge,
nobody has reported about the orientation of these borosilicide single crystals and I have determined the crystallographic orientation in YB41Si1.3 for the first time.
Obviously, the orientation in YB41Si1.3 would be greatly helpful to explore
directional properties of REB41Si1.2 borides. Figs. 6 (a) and (b) show views of the
crystal structure along [510] (the growth direction) and [052] of YB41Si1.3. The
growth direction shows an interesting structure feature in that an almost layered structure is revealed, with dense boron cluster layers separated by the rare earth atom layers.
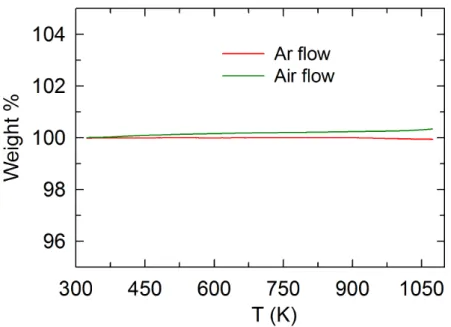
I also investigated the thermal stability of the borosilicide single crystal. Fig.7 shows TGA data of YB41Si1.3 crystal. Thermogravimetric analysis (TGA) was
performed in Ar flow as well as in air flow and in both cases, two different small pieces of the crystal were used. TGA data in Fig. 7 (a) reveals that there was no change in weight during heating in Ar flow. However, in the case of air flow, the crystal was oxidized slightly as shown in Fig. 7(b) and the weight increased by 0.3% up to 1073K. Therefore, TGA data implies that at higher temperature, the grown crystal was excellently stable in Ar flow and moderately stable in air flow.
30
Fig. 6. Views of the crystal structure along: (a) [510] (the growth direction) and (b) [052] of YB41Si1.3. Dark blue represents Y, green represent Si and red
indicates B atoms.
a
31
Fig.7 (a) Thermogravimetric analysis (TGA) of YB41Si1.3 single crystal in Ar and
air flow.
Fig. 7 (b) EDX mapping of the YB41Si1.3 single crystal used for TGA in air flow
32
2.3.2 Thermoelectric properties
The thermoelectric properties of the YB41Si1.3 single crystal were measured along
the two determined directions [510] (the growth direction) and [052], and compared them with the properties of arc-melted YB44Si2 [10]. The electrical
resistivity data are plotted in Fig. 8 as the logarithm of the resistivity against
ܶି.ଶହ. The electrical resistivity of many boron-rich borides exhibit Mott’s
variable range hopping mechanism for three dimensional systems where the resistivity ρ follows:
ߩ = ߩexp[Tൗ ]T ଵ/ସ, (1)
With T0 being the so-called characteristic temperature [24,25]. The resistivity for
YB41Si1.3 along [510] and [052] generally appear to have linear dependence with
T-0.25 (K-0.25).
By fitting equation (1), the values of T0 along [510] and [052] were obtained to be
7.4×10⁵K and 9.1×10⁵K, respectively. The smaller value of T0 along [510]
compared to [052] indicates that it is less localized or has higher density of states at the Fermi level along [510] [13]. In general the values for T0 for YB41Si1.3
crystal are comparable with 6×10⁵K, 1×10⁶K and 5×10⁶K for TbB44Si2, ErB44Si2,
and YbB44Si2, respectively [7,26]. At 330 K, the resistivity along [510] and [052]
directions were 1.6×10⁻²Ωm and 13.2×10⁻²Ωm respectively, i.e. the resistivity along the [510] direction was 8 times lower than that along [052] direction. These differences in resistivity signify that YB41Si1.3 crystal is strongly anisotropic with
33
the electrical conductivity larger along [510]. As noted above (Fig. 6(a)), an interesting layered structural feature is revealed along [510] with dense boron cluster layers and yttrium layers. It can speculate that the enhancement may be due to good conduction along the metal layers, which is quite interesting and an unusual structural feature for these higher borides. These resistivity values in general are lower than reported for the RB66 compounds [26], for example, and
indicate the suitability of YB41Si1.3 among the higher borides as thermoelectric
materials. The micro-cracks undoubtedly make the measured values of resistivity higher, and if crystal growth techniques to remove these up-to-now unavoidable cracks can be realized, the thermoelectric properties can assumedly be further improved, since such cracks (with no special design for selective phonon scattering) typically more strongly affect electrical conductivity compared to thermal conductivity.
34
Fig.8. Temperature dependence of electrical resistivity of YB41Si1.3 single crystals
along: (I) [510] and (II) [052] orientations. Red triangles represent the resistivity of arc-melted YB44Si2 [10].
The Seebeck coefficients α, of YB
41Si1.3 are plotted in Fig. 9. They exhibit
positive values and increase with increase in temperature. Throughout the whole range of measurement temperature, a large difference in Seebeck coefficient was observed between [510] and [052] directions. The Seebeck coefficient along [052] was higher than [510]. This agrees with the orientation dependence observed in the electrical resistivity. The values of Seebeck coefficients of the YB41Si1.3 single
crystal along both [510] and [052] were significantly higher than that of arc-melted YB44Si2 sample, and showed a larger plateau behavior (i.e. less
temperature dependence) over a wide range of temperature. This behavior is T-0.25 (K-0.25) 0.16 0.18 0.20 0.22 0.24 R es is ti v it y ρ ( Ω m ) 10-4 10-3 10-2 10-1 100 [I] [II] YB44Si2 [10]
35
beneficial for high temperature thermoelectric materials, since in applications, large temperature differences will be applied to the material and the average performance over a wide temperature range is important.
Fig.9. Temperature dependence of Seebeck coefficient of YB41Si1.3 single crystals
along: (I) [510] and (II) [052]. Red triangles represent Seebeck coefficient of arc-melted YB44Si2 sample.
Fig.10 demonstrates the temperature-dependent power factor of YB41Si1.3. The
power factors along [510] of FZ crystal are larger compared to that along [052] of FZ crystal and arc-melted sample, but the gap in performance widens towards higher temperatures. This is related to the plateau-like behavior noted for the Seebeck coefficient, and is especially apparent for the power factor along [510], which exhibits a good rise above 700 K. At 1000 K, the power factor of YB41Si1.3
T (K) 200 400 600 800 1000 1200 S ee b ec k c o ef fi ci en t α ( µ V /K ) 0 100 200 300 400 [I] [II] YB44Si2 [10]
36
single crystal along [510] was 13.8× 10ିହ Wm-1
K-2, which is 3.6 and 1.8 times higher than that along [052] and the arc-melted YB44Si2 sample, respectively.
To gauge the performance of thermoelectric application of compounds, it is necessary to determine the dimensionless figure of merit ZT=PT/k, where k is thermal conductivity. We measured the thermal conductivity of YB41Si1.3 single
crystal (Fig. 11) along [510] only due to considerably high power factor in this direction.
The thermal conductivity of YB41Si1.3 took values from 3.7 to 4.4 Wm-1K-1 in
the temperature range. The measured thermal conductivity of YB41Si1.3 crystal
was compared with those of YbB44Si2 and ErB44Si2 FZ crystals as shown in Fig.11.
The magnitude of thermal conductivity was highest for YB41Si1.3 because Y is
lighter than Er and Yb and hence there is reduced phonon scattering. Fig.12 shows the temperature dependence of ZT value of YB41Si1.3 single crystals along [510]
and the maximum value 0.033 was found at 990 K. Although, this value is not high compared to values such as ZT~0.8 for SiGe at 900K [27], the experimental results discussed in this article were obtained for an unmodified yttrium borosilicide.
37
Fig.10. Temperature dependence of power factor of YB41Si1.3 single crystals
along: (I) [510] and (II) [052]. Red triangles represent power factor of the arc-melted YB44Si2 sample.
Fig.11. Temperature dependence of thermal conductivity of YB41Si1.3 single
crystals along [510] (pink squares). Red diamond and green circles represent thermal conductivity for YbB44Si2 and ErB44Si2 crystals, respectively.
T (K) 200 400 600 800 1000 1200 P o w er f ac to r (1 0 -5 W m -1 K -2 ) 0 3 6 9 12 15 [I] [II] YB44Si2 [10] T (K) 200 400 600 800 1000 1200 T h er m al c o n d u ct iv it y ( W /m .K ) 1.0 1.5 2.0 2.5 3.0 3.5 4.0 4.5 [I] ErB44Si2 [4] YbB44Si2 [5]
38
Fig. 12. Temperature dependence of ZT value of YB41Si1.3 single crystals along
[510] direction.
As mentioned, the grown crystal contains micro-cracks and by optimizing the growth condition, the quality of the grown crystal could be improved and the thermoelectric performance assumedly enhanced. Doping with transition metals is another way to more dramatically modify the properties of REB44Si2 [14]. A
beneficial hybrid effect was previously obtained for yttrium borocarbonitride with a combination of transition metal doping and heat treatment. Seebeck coefficients, α, of YB22C2N, n-type counterpart to boron carbide, could be increased by up to 220% while resistivity was reduced by x100 [28,29]. In addition by applying such doping effects the clarification of the anisotropy effect in this work will be effective for further develop of the borosilicides, which could one of the few
39
thermoelectric materials which can be used at high temperatures such as 1000 oC and above.
2.4. Conclusions
YB41Si1.3 single crystals were grown by the floating zone method. There has
been no report on the determination of crystallographic orientation and electrical anisotropy in REB44Si2 crystals. For the first time, I have determined crystallographic orientation and also discovered large anisotropy in the thermoelectric properties of YB41Si1.3 single crystals. The electrical conductivity was significantly higher along [510] (growth direction), a maximum of more than 8 times compared to [052], where it was revealed that the crystal structure has a layered character, with dense boron cluster and metal layers. It can be speculated that conduction is enhanced in the metal layers. Further theoretical insight is needed to quantitatively evaluate this anisotropy discovered in the YB41Si1.3 single crystal.
The thermal conductivity of YB41Si1.3 single crystal was also measured along [510] and then estimated figure of merit to be 0.033, which is not high, but acceptable as a starting point in the development. Future efforts can be made to modify the borosilicides utilizing beneficial doping effects which have been found for other boride systems. Furthermore, this is the first report of existence of such a strong anisotropy in the thermoelectric properties of a boride, and such anisotropy should be investigated in other prospective boride systems also and this could be a
40
clue for the improvement of the suitability of this borosilicilde and other borides as possible high temperature thermoelectric materials, one of the few materials systems which can be used at 1000 ºC and higher temperatures.
References
[1] Thermoelectric Nanomaterials, ed. K. Koumoto and T. Mori, Springer Series in Materials Science (Springer, Heidelberg, 2013) pp. 1-373.).
[2] Li-Dong Zhao, Shih-Han Lo, Yongsheng Zhang, Hui Sun, Gangjian Tan, CtiradUher, C. Wolverton, Vinayak P. Dravid&Mercouri G. Kanatzidis, Nature, 2014, 508, 373.
[3] Wood, C.; Emin, D. Phys. Rev. B 1984, 29, 4582.
[4] Slack, G. A.; Oliver, D. W.; Horn,F. H. Phys. Rev. B, 1971, 4, 1714.
[5] Cahill, D. G.; Fischer, H. E.; Watson, S. K.; Pohl, R. O.; Slack, G. A. Phys. Rev. B, 1989, 40, 3254.
[6] Mori, T. Physica B, 2006, 383, 120.
[7] Mori,T.; Martin, J. and Nolas, G. J. Appl. Phys., 2007,102, 073510. [8] Tanaka,T.; Okada,S.; Ishizawa,Y.J. Alloys Comp. 1994, 205, 281. [9] Tanaka,T.; Okada,S.; Ishizawa,Y. J. Solid State Chem. 1997, 133, 55. [10] Mori, T.; Berthebaud, D.; Nishimura, T.; Nomura, A.; Shishido, T.;
Nakajima, K. Dalton Trans.2010, 39, 1027.
[11] Higashi,I.; Tanaka,T.; Kobayashi,K.; Ishizawa,Y.; Takami,M.J. Solid State Chem. 1997, 133, 11.
[12] Ishizawa,Y.; Tanaka,T. J. Solid State Chem. 2000, 154, 229. [13] Mori, T., J. Appl. Phys. 2005, 97, 093703.
41
[14] Berthebaud, D.; Sato, A.; Michiue, Y.; Mori, T.; Nomura, A.; Shishido, T.; Nakajima, K. J. Solid State Chem., 2011, 184, 1682.
[15] Mori, T.;Shishido, T.; Nakajima, K. J. Electron. Mater. 2009, 38, 1098. [16] Mori,T. Z. Kristallogr. 2006, 221, 464.
[17] Mori,T.; Tanaka,T. J. Solid State Chem. 2000, 154, 223. [18] Mori,T.; Tanaka, T.J. Alloys and Comp. 1999, 288, 32. [19] Mori, T.; Tanaka, T. IEEE Trans. Magn. 2001, 37, 2144. [20] Mori, T.; Tanaka, T. J. Alloys and Comp.2003, 348, 203.
[21] Yuan, J.; Zhang, H.; Tang, J.; Shinya, N.; Lin,Y.; Lu-Chang Qin, J. Mater Sci 2013, 48, 1555.
[22] Tanaka,T.; Okada,S.; Ishizawa,Y. J. Alloys Compd. 1994, 205, 281. [23] Mori, T.; Tanaka, T.; Mat. Res. Bull., 2001, 36 2463.
[24] Mott,N. F. J. Non-Cryst. Solids1968,1, 1.
[25] Electron-electron interactions in disordered systems,edited by A. L. EfrosandM. Pollak, (North-Holland, Amsterdam, 1985), P-409.
[26] Mori,T. “Higher Borides” in Handbook on the Physics and Chemistry of Rare Earths, ed. K. A. Gschneidner Jr., J. -C. Bunzli, and V. Pecharsky (North-Holland, Amsterdam)2008, vol 38 p. 105.
[27] CRC Handbook of Thermoelectrics, ed. D. M. Rowe (CRC, Boca Raton, 1995).
[28] Prytuliak, A.; Mori, T.; Journal of Electronic Materials, 2011, 40, 920. [29] Prytuliak, A.; Maruyama, S.; Mori, T. Materials Research Bulletin, 2013,
42
CHAPTER 3
Crystal Growth and Thermoelectric Properties of YB
48, Metal
Rich Boundary of YB66
3.1 Introduction
In the recent years, research on thermoelectric materials is being vigorously carried out throughout the world now, since it represents significant energy saving technology which has not been realized on a large scale yet [1]. It is necessary to develop high temperature thermoelectric materials which can utilize high temperature waste heat in thermal power plants, steelworks, factories, and incinerators, etc. and focused solar energy.
Up to now, the thermoelectric properties of boron cluster compounds such as boron carbide [2,3-6], RBC(N) compounds [7-9], β−boron based materials [10-13], B6S1-x [14], RB66 (R = rare earth) [15,16], RB44Si2 [17-20], MgAlB14 [21-23],
YxAlyB14 [24-26], CaB6 [27-32], B12As2 [33,34], have been investigated in detail.
Slack has reported recently a good thermoelectric outlook for B6O also [35].
YB66 is an interesting boride, since it has been well known for around half a
century and has a complex structure with more than 1600 atoms in the unit cell [36]. Slack made the discovery about YB66 being a crystalline material with
glass-like thermal conductivity [37,38] which can be considered as a precursor to the famous phonon glass electron crystal (PGEC) concept. It was reported that the
43
homogeneity region of YB66 was YB56 to YB68 [39,40].
As described in this work, while growing floating zone crystals of yttrium borosilicide we have made the accidental discovery of a strikingly metal-rich phase of YB66; YB47. Later, we purposely synthesized YB48. YB66 had been
reported to be a poor thermoelectric material [15,16] but through thermoelectric measurements of this unexpectedly metal-rich phase (YB48) of YB66 showed a 30
times higher ZT than conventional YB66, and takes a value of approximately 0.1 at
990 K which is a promising start as a new high temperature material. This discovery of a dramatic expansion of homogeneity region in a well-known boride, accompanying striking physical properties, is exciting and shows the still untapped potential of these materials.
3.2 Experimental details
Floating zone (FZ) crystal growth was employed to grow yttrium rich YB66
crystals using a four-mirror-type infrared image furnace (Crystal System Inc., FZ-T-10000-H-III-VPR) equipped with four 2.5 kW xenon lamps as heat source. The preparation process of the polycrystalline feed rods for FZ crystal growth is as follows; we mixed YB4, B and Si powders to obtain a desired final composition,
then, cold pressed it to form a rod at a hydrostatic pressure of 300 MPa. The pressed rod was reacted in a boron nitride (BN) crucible fixed inside of a graphite susceptor that was covered with carbon wool for thermal insulation. Synthesis was carried out in an RF inductive furnace at the temperature of 1700 °C for 8 h in vacuum. To obtain high density feed rod, the synthesized rod was once ground
44
and again formed into a rod and sintered under the same conditions. The final sintered feed rods had a density of about 75-80%. The FZ crystal growths were carried out by driving downward both the feed and seed rods at 10 and 8mm/h, respectively, with counter-rotating at 16 rpm under Ar atmosphere.
The grown crystals were characterized by high-resolution powder X-ray diffraction (XRD), electron probe microanalysis (EPMA), single crystal XRD and inductively coupled plasma atomic emission spectroscopy (ICPAES). Powder XRD measurements with CuKα radiations (Rigaku Ultima-3) were performed to
confirm the required phase formation in the grown crystals, where parts of the crystals were crushed using a stainless steel mortar and obtained powder was washed with HCl solution and rinsed with water to remove stainless steel contamination. Rietveld refinement was performed using FullProf Suite software (2.05). Peak shape was refined with modified Lorentzian function and 6 coefficients polynomial function was used for background refinement.
EPMA was carried out in wavelength-dispersive mode using JEOL JXA-8500F instrument. YB6 was used as standard sample. To achieve fine surface
EPMA samples were initially polished using B4C abrasives and finished using
Al2O3 fine abrasives.
Specimens for single crystal XRD were obtained by cracking a part of the FZ-grown crystals. Single crystal XRD data were collected using a CCD area detector diffractometer (Bruker SMART APEX, Germany) with graphite monochromated MoKα radiations. Intensity data were corrected for Lorentz and polarization
45
effects. Absorption correction applied to the collected data was based on multi-scans.
ICPAES was carried out to detect transition metal impurities in the crystals. Powder samples for ICPAES were obtained using the same method as the one used for powder XRD. Resulted powder (50mg) was dissolved into HNO3 (2 mL)
+ H2O (2mL) + HCl (3 droplets) solution, which was kept at 110 °C for 16 h in a
sealed Teflon crucible. To check the stability of YB48 single crystal at high
temperature we also carried out thermo-gravimetric analysis (TGA) by Rigaku-Thermo plus TG 8120 from 300 K to 1080 K in Ar flow as well as in air flow.
Resistivity and Seebeck coefficient were measured with an ULVAC ZEM-2 in the temperature range of 323–990 K in He atmosphere. To determine the thermal conductivity values, first of all, the room temperature specific heat was measured by using PPMS (physical property measurement system). Then, the relative specific heat and thermal diffusivity coefficient were measured by using laser flash method (ULVAC TC-7000) from 300 K to 1073 K. Thermal conductivity was determined as the product of the density, specific heat, and thermal diffusivity coefficient.
3.3 Results and discussion 3.3.1 Crystal growth of YB48
The boron-rich boride compound YB50 that has an orthorhombic crystal
structure, starts to decompose above 2100 K into phases like YB12 and YB66
46
method is applicable to grow YB50 crystal as an yttrium borosilicide crystal
YB44Si2 that is iso-structural to YB50 [43], by adding a small amount of silicon. To
study the thermoelectric properties of YB44Si2 single crystal we tried to grow it by
the FZ method using an YB44Si2 polycrystalline feed rod. However, we
unexpectedly found that the grown crystal was not an YB44Si2 crystal but an
yttrium-rich YB66 phase. EPMA results indicated that the grown crystal
composition is YB47 with negligible amount of Si, suggesting that Si has been lost
during feed rod preparation process. Si was melted before reacting with YB4 and
B and we found Si ball at the bottom of BN crucible. The grown crystals were crack-free and had a silvery color (shiny part) as shown in Fig. 1(a). Only the shiny part of the grown crystal was taken for characterization and measurements. I will discuss the crystal structure, impurity phase and chemical composition analysis in the later sections.
Fig. 1 Yttrium rich YB66 phase single crystals: (a) YB47 unexpectedly obtained,
47
Tanaka et al. have reported that Y-richest composition of the YB66 phase is
approximately YB56 [39], which contradict the existence of YB47 with YB66
structure. Thus, after getting these unexpected results I tried to grow YB47 single
crystal purposely. I mixed the desired amount of YB4 and amorphous B to
synthesize YB47 polycrystalline sample using the same process as that used for
YB44Si2. The growth conditions and atmosphere were similar to those for YB44Si2.
EPMA results revealed the composition of the grown crystals to be YB48 quite
close to YB47. The grown crystal was also crack free.
3.3.2 Chemical analysis and XRD
The powder XRD patterns of the central parts of the YB47 and YB48 single
crystals are shown in Fig. 2. The powder XRD patterns of YB47 and YB48 crystals
matched with YB66 single crystals (not shown here) [44]. Rietveld refinement for
the YB48 crystal data confirmed YB66 structure type with RF=0.076 and RB=0.099.
Lattice constant was found to be 23.401(8), which is very close to that of YB62
(congruent composition of YB66) [44]. Small amount of YB12 inclusions could be
found in the periphery of the grown crystals, but the central parts were single phase and were used for the thermoelectric properties measurements. The SEM images of the central region of YB48 as well as YB47 single crystals do not show
the presence of any inclusions or cracks (Fig. 3(a-b)).
The obtained results from EPMA and single crystal XRD measurement are presented in Table 1. Structural data of YB47 and YB48 obtained from single
48
with lattice constant 23.4307Å (Table 1,2). Single crystal XRD results reveal that the ratio, [B]/[Y], for unexpected and purposely-grown crystals were 52 and 49, respectively. This ratio was slightly different than the one obtained from EPMA results 47 for the unexpected crystal and 48 for purposely-grown single crystal. We take EPMA results as representative of the composition and consider the composition of the purposely grown single crystal as YB48.
The total number of yttrium atoms per unit cell of YB62 are 26.2 [36], but 33.1 for
the YB48 single crystal indicating a significant difference. In a previous work of
transition metal-doped YB66, Tanaka et al. [44] reported that the yttrium atom
occupy split sites of Y1 (x1, 1/4, 1/4) and Y2 (x2, 1/4, 1/4) while dopant transition
metal atoms occupied body center of the octant of the unit cell, (1/4, 1/4, 1/4) by replacing the B-B pair in B13 site. Single crystal XRD results confirmed these yttrium split sites of Y1 and Y2 for both crystals. For the purposely-grown crystal of YB48 I found a new yttrium site named Y3 at the body center of the octant of
the unit cell, which is the same site as that occupied by doped transition metal atoms. This creation of a new Y site is another strong proof of the unprecedented metal-rich nature of our single crystals.
There are 13 boron atom sites in the YB66 unit cell and a pair of B13 atoms
which occupies the body center of the octant of the unit cell in the case of conventional yttrium less-rich YB66 crystals. The doped transition metal atoms or
the Y3 atom replace the B13 atoms, which slightly affects the remaining twelve B sites [36,44]. The occupancy of Y3 site is rather low (approximately 15%), thus only one yttrium atom per unit cell is available on 8 Y3 sites and the B13 atom pairs are expected to occupy the remaining 7 sites. To exclude the possibility of
49
transition metal impurity occupancy in the Y3 site, ICPAES impurity analysis was carried out and no significant amount of impurity was detected to occupy the Y3 site.
Fig. 4 shows TGA of YB48 single crystal performed in Ar flow as well as in air
flow. TGA data shows almost no change in weight during heating the crystal in Ar flow as well as in air flow indicating YB48 single crystal to be stable at elevated
50
Table 1 Single crystal XRD and EPMA results of the grown crystals
a
Number of independent reflections
b
Number of variable parameters
cF o> 4σ(Fo) Measurement Unexpecte d crystal Purposely grown crystal Single crystal XRD
Crystal system Cubic Cubic Space group Fm3c Fm3c a 23.4292 Å 23.4307Å Yttrium occupancy Y1 0.362 0.342 Y2 0.294 0.323 Y3 - 0.148 Y atom/unit cell 31.5 33.1 composition YB52 YB49 Z 8 8 µ forCuKα(mm -1 ) 3.60 3.787 Crystal dimensions (µm) 130x60x30 130x110x80 NRa 758 956 NVb 110 107 R1c 0.071 0.079 EPM A Element (Atomic% ) Y 2.07 2.03 B 97.9 98.0 Si 0.0099 - Composition YB47.3 YB48.3
51
Table 2 Structural data for YB47 and YB48 single crystals
“a” and “b” represent data for B47 and YB48 respectively
Atom Site X y Z Occupanc
y B1a B1b 96i 96i 0.0 0.0 0.0372(2) 0.0370(2) 0.0590(2) 0.0590(2) 1 1 B2a B2b 96i 96i 0.0 0.0 0.0751(2) 0.0756(2) 0.1161(2) 0.1162(2) 1 1 B3a B3b 96i 96i 0.0 0.0 0.0389(2) 0.0388(2) 0.1809(2) 0.1808(2) 1 1 B4a B4b 96i 96i 0.0 0.0 0.1482(2) 0.1482(2) 0.2416(2) 0.2416(2) 1 1 B5a B5b 96i 96i 0.0 0.0 0.1853(2) 0.1854(2) 0.1713(2) 0.1712(2) 1 1 B6a B6b 192j 192j 0.0386(1) 0.0388(1) 0.1395(1) 0.1397(1) 0.1215(1) 0.1216(1) 1 1 B7a B7b 192j 192j 0.0394(1) 0.0394(1) 0.0816(1) 0.0815(1) 0.2289(1) 0.2291(1) 1 1 B8a B8b 192j 192j 0.0628(1) 0.0628(1) 0.0772(1) 0.0772(1) 0.1583(1) 0.1582(1) 1 1 B9a B9b 192j 192j 0.0634(1) 0.0636(1) 0.1453(1) 0.1454(1) 0.1944(1) 0.1946(1) 1 1 B10a B10b 192j 192j 0.1327(4) 0.1326(3) 0.1748(4) 0.1747(3) 0.1965(4) 0.1972(3) 0.808 0.743 B11a B11b 192j 192j 0.2305(6) 0.2308(5) 0.1626(6) 0.1639(5) 0.3027(6) 0.3018(5) 0.540 0.493 B12a B12b 192j 192j 0.1725(6) 0.1730(5) 0.1273(6) 0.1272(5) 0.2583(6) 0.2591(5) 0.306 0.270 B13a 64g 0.2311(6) 0.2311(6) 0.2311(6) 0.082 Y1a Y1b 48f 48f 0.0538(4) 0.0527(3) 0.25 0.25 0.25 0.25 0.362 0.342 Y2a Y2b 48f 48f 0.0720(6) 0.0716(4) 0.25 0.25 0.25 0.25 0.294 0.323 Y3b 8a 0.25 0.25 0.25 0.148
52
Fig. 2 Powder XRD pattern of YB47 and YB48 crystals grown by floating zone
53
Fig. 3 SEM images of YB47 and YB48 single crystals. Central part of the grown
crystals used for SEM images.
Fig. 4 Thermogravimetric analysis (TGA) of YB48 single crystals in Ar as well as
in air flow. T (K) 300 400 500 600 700 800 900 1000 1100 W ei g h t % 97 98 99 100 101 102
Heating in air flow Heating in Ar flow
54
3.3.3 Thermoelectric measurements
The thermoelectric properties of YB47 and YB48 grown crystals was
measured. T. Mori et al. reported the thermoelectric properties of YB66 single
crystals grown near the boron-rich end with an actual chemical composition close to [B]/[Y]=66 [16]. I compared the thermoelectric properties of the unexpectedly metal-rich phase YB48 with YB66 and ErB66. Regarding the absolute values, it is
clear that the resistivity of YB48 single crystal is much lower than that of YB66 and
ErB66 single crystals [16,19]. The electrical resistivity of YB48 is plotted in Fig. 5
as the logarithm of the resistivity versusTି.ଶହ. The electrical resistivity of many boron-rich borides [45,46] exhibit Mott’s variable range hopping mechanism for three dimensional systems where the resistivity ρ follows:
ߩ = ߩexp[Tൗ ]T ଵ/ସ (1) ܶ is the so-called characteristic temperature and follows the relationship
݇ܶ = 18.1/[ܦ(ܧ)ߦଷ], (2) where ݇, D(ܧ), and ߦ are the Boltzmann constant, the density of states at the Fermi level, and the localization length of the carriers at the Fermi level, respectively.
The localization length of YB62 single crystal which is the congruent composition
of YB66 has been discussed by T. Mori et al. [18] and the measured values of T0, ߛ,
and ߦ were 7.2×10⁸ K, 1.9 mJ/mole/K2 and 0.56 Å, respectively. By fitting the resistivity data of YB48 (Fig. 5) to Eq. (1), we obtained T0=14×106 K, almost 2
55
orders lower than that of YB62 [18]. Following the methodology described in Ref.
(18) we determined the localization length.
Low temperature specific heat measurements were carried out, where C = γT+
AT3, to estimate D(EF) from the electronic γ coefficient using the relationship:
ߛ = ଵଷߨଶ݇
ଶܦ(ܧ) (3)
Fig. 5 Temperature dependence of electrical resistivity of YB47 and YB48 single
crystals, along with literature values.
After obtaining the values of T0 = 8.14×10⁶ K and γ =4.1×10⁻³ mJ/g/K2 (or 3.2
mJ/mole/K2) and using Eq. (2) I calculated the value of localization length ߦ = 2.14 Å for YB48. The localization length can be considered as a measure of
disorder in the compound employed for a comparison between YB48 and YB62.
0.17 0.18 0.19 0.20 0.21 0.22 0.23 0.24 R es is ti v it y ρ ( Ω m ) 10-4 10-3 10-2 10-1 100 101 102 103 YB47 YB48 YB66 [16] ErB66 [19] ) 0.25 (K 0.25 T− −


![Fig. 1.View of the crystal structure of REB 44 Si 2 from a direction slightly tilted along [001] as indicated by the labels, two kinds of polyhedra are shown: B 12](https://thumb-ap.123doks.com/thumbv2/123deta/7695248.1216913/29.892.311.632.265.616/crystal-structure-direction-slightly-tilted-indicated-labels-polyhedra.webp)

![Fig. 6. Views of the crystal structure along: (a) [510] (the growth direction) and (b) [052] of YB 41 Si 1.3](https://thumb-ap.123doks.com/thumbv2/123deta/7695248.1216913/35.892.148.713.136.959/fig-views-crystal-structure-growth-direction-yb-si.webp)
![Fig. 12. Temperature dependence of ZT value of YB 41 Si 1.3 single crystals along [510] direction](https://thumb-ap.123doks.com/thumbv2/123deta/7695248.1216913/43.892.238.670.150.465/fig-temperature-dependence-zt-value-single-crystals-direction.webp)

