Problems of Cambodian Economy Seen from Trade
and Investment Structure (マング・マング・ルウ
ィン教授 退職記念号)
著者
Yoshikawa Keisuke
journal or
publication title
Journal of Economics, Kumamoto Gakuen
University
volume
25
number
1-4
page range
187-206
year
2019-03-31
URL
http://id.nii.ac.jp/1113/00003337/
1
Problems of Cambodian Economy
Seen from Trade and Investment Structure
Keisuke, YOSHIKAWA
Abstract
Cambodia, a least developed country, has experienced high economic growth as a result of the development of the manufacturing factories driven by the garment industry since 2000. In recent years, Cambodia has been replaced by "China Plus One" and "Thai Plus One", and is getting economic benefits of making it a manufacturing base as a result of the progress of natural resource development, the creation of the ASEAN Economic Community (AEC) at the end of 2015, and the development of the economic corridors across the Indochina region.
In this study, in order to clarify the above aspects and its current situation, I will focus on the economic aspect in particular and discuss factors and background of the recent rapid economic growth in Cambodia. Therefore, this research clarifies the transition process of the Cambodian economy, analyzes its background and factors, and derives the characteristics and problems of the Cambodian economy through macroeconomic analysis. Hence, we will show the situations of the industrial structure, the trade structure, and the Foreign Direct Investment (FDI) by using data of various organizations.
1. History and Background of Economic Development in Cambodia
1.1 Previous researchAfter the Second World War, Cambodia has experienced a cold war structuring in the Indochinese Peninsula, the rise of the Pol Pot regime, the Third Indochina war, the domestic reconstruction, and domestic political turmoil which ended in the late 1990s. Since stabilizing the administration in 1997, Cambodia, which began to move towards domestic reconstruction and economic reconstruction, has been rapidly growing economically in recent years due to the rapid increase of inflows of foreign capital. This research relies on representative research mainly on the background of Cambodia's economic development as mentioned above.
Amakawa (2001) a, b explained how Cambodia experienced the formation of the socialist system during the civil war, and from the independence, the birth of the Pol Pot regime and the invasion of Cambodia in Vietnam (the third Indochina war). In addition, the study pointed out that
2
the Production Expansion Unity Group (Kromsamaki) promoted after the collapse of the Pol Pot administration was an important opportunity for reform of farmland ownership, so, the study is important to understand the transition economy and the background of recent economic development.
Hirohata (2004) explained that the transition economy and the situation of opening economy was based on the vast macro data by Cambodian government agencies, overviewed the Cambodian economy through the early 2000s. This research also revealed the situation that Cambodia coped with international reform, fiscal reform, financial reform, and poverty problem with international support, and clarifies the background of Cambodia economic growth.
The rapid growth of the manufacturing industry from the late 1990s and its background have been clarified by Hajikano (2006) and Penghuy (2011). Hajikano (2006) interviewed local companies, clarified the fact that the Chinese garment company and Cambodian small and medium-sized food company have led the Cambodian industry, that those were occurred against the background of China's international trade environment . Penghuy (2011) revealed that Cambodia changed rapidly into a foreign capital dependent economy after the establishment of the Law on Investment of the
Kingdom of Cambodia 1994, by analyzing various statistical data. And he pointed out also that its
industrial structure will have possibility to cause vulnerability for external shocks. Based on these studies, Yoshikawa (2013) explained that the fall in EU and North America includes U. S. demand due to the Lehman Shock in 2008 caused a decrease in the export of the Cambodian garment industry, and revealed that dependence on the garment industry of Cambodian economy caused serious impact on domestic industry.
In recent years, Inada (2013) a, b explained the formation of social capital and its process in Cambodia after independence, and the process of Official Development Assistance (ODA) by the Japan International Cooperation Agency (JICA) and Foreign Direct Investment (FDI) by Japanese companies play a major role in the rehabilitation and development of Cambodia.
Based on these previous studies, I would like to explain the present state of nation-building and economic transition in Cambodia.
1.2 Transition and Opening of Cambodian Economy
After independence, Cambodia returned shortly to the authoritarian regime by Norodom Sihanouk who was the king of Cambodia. After that, Cambodia experienced a coup d'etat and a civil war associated with it by Lon Nol in 1970 due to the influence of the Second Indochinese War which
3
lasted from 1965 to 1975. And from 1975 to 1979, Pol Pot led the Khmer Rouge, who won the civil war, grabbed political power, carried out extreme social reform such as forced migration policy, in which more than 1.5 million Cambodians died.
The Pol Pot administration was destroyed by the invasion from Vietnam in 1978 (the Third Indochina War), but Vietnam continued to stay until 1989. During that period, under the Heng Samrin regime, which was endorsed by Vietnam, Cambodia aimed for economic rehabilitation by a socialist planned economy1). The industrial restoration mainly by state-owned enterprises during this period
was inefficient, and as a result, the economic development of Cambodia was delayed from the other ASEAN countries2).
After Vietnam withdrawal, the Ministerial Conference on Rehabilitation and Reconstruction of
Cambodia, in Tokyo, June 1990 and the Final Act of the Paris Conference on Cambodia, Oct 1991
were held, and Cambodia was able to grasp the keys of nation-building. However, the sweeping up the Pol Pot factions and the conflict between the Front Uni National pour un Cambodge Indépendant, Neutre, Pacifique, et Coopératif (FUNCINPEC) and the Cambodian People's Party (CPP) until the end of the 1990s.
As described above, stabilizing the nation-building, which forms the basis of economic rehabilitation, took time, but the movement of the shifts to the "transition economy" from the socialist planned economy started at the end of the 1980s. In the Cambodian constitutional revision of 1989, the existence of "mixed economy" and "private economy" were approved, leasing of state-owned enterprises to the private sector was approved in the same year, and the sale of state enterprises began in 1991. The establishment of a new constitution in which the establishment of a market economy system (Article 56) in 1993 was enacted accelerated the reform of state-owned enterprises and set a path to industrial restoration mainly by private enterprises3). In the 1990s, The
Royal Government of Cambodia (RGC) formulated the "Cambodia Reconstruction and Development Program" (NPRD) in 1994, and subsequently declared the development policy such as "National Strategic Development Plan" (2006-2010; NSDP, 2011-2013 and 2014-2018; NSDP Update) and the "Socio-Economic Development Plan” (1996-2000; SEDP-I, 2001-2005; SEDP-II). Furthermore, Cambodia government formulated "Rectangular Strategy” (RS I) in 2004, RS Phase II "(RS II) in
1㸧AMAKAWA (2001b). 2㸧HAJIKANO (2011), P23. 3㸧HAJIKANO (2011), P25.
4
2008, and “RS Phase II "(RS III) in 2013 for growth and employment, fairness and efficiency, has developed social economic development and transition economy.
At the same time as this transition, RGC actively worked on the development of a system related to investment and trade. The Law on Investment of the Kingdom of Cambodia was enacted in August 1994 and the Council for Development of Cambodia (CDC) established based on the laws, which are exactly the same as for the global economy Correspondence, and symbolism as a shift to an "outward looking economy". CDC is positioned as the government's highest decision-making council on public investment and private investment by the Investment Law, and is leading the economic rehabilitation and development as a window for international aid and FDI to Cambodia4).
In addition, Low on the Amendment to the Law on Investment of the Kingdom of Cambodia in March 2003 was clearly stated follow; (1) In principle, except for land ownership, domestic capital and foreign capital treat equality. (2) Do not deprivation private assets. (3) Elimination of overseas remittance restrictions (tax exemption). (4) Accept income tax exemption for a minimum of three years for the Qualified Investment Project (QIP) that meets the criteria. These series of investment law establishment and amendment opened up the market preferential treatment of domestic and foreign investors and entrepreneurs, which well expressed the positive attitude of RGC for the open economy5). These investment preferential policies have become a major factor in the expansion of
FDI inflow in recent years. This aspect will be as described later.
1.3 Cambodia and Surrounding Economic Situations
Today's economic growth in Cambodia has been largely supported by the economic environment in the Indochina region. Since the mid-1990s, the Greater Mekong Subregion (GMS) to which the CLMV countries belong has considered the importance of transporting infrastructure improvement, as a result, the North-South Economic Corridor, the East-West Economic Corridor, and the South Economic Corridor (Figure 1) were constructed. The development of these transportation infrastructure networks has helped the rapid increase in FDI to Cambodia since 2000s and has resulted in the shift of companies to Cambodia; "Thai Plus One" which is a production base from Thailand, and "China Plus One" which is a production base shift from China and Vietnam6). As
4㸧CDC (2012).
5㸧For details about Investment Low and QIP, see JBIC (2008), PP.35-47, and HAJIKANO (2011), P26. 6㸧For Details about GMS and economic corridors in Indochina, see ADB (2006).
5
Cambodia's wage is lower than China and Thailand, many labor-intensive industries are moving completely or partially to Cambodia7). In order for companies to utilize such inexpensive labor in
Cambodia, the various economic corridors that span the Indochina region are attractive distribution infrastructures, and their development will directly lead to attracting companies to the domestic market for CLMV countries. In Cambodia crossing by the Southern Economic Corridor, the Neak Loeung Bridge crossing the Mekong River opened in April 2015, so the position as China Plus One through Vietnam will intensify more and more forward.
In addition to the formation of such an economic corridor, the influence of AEC established at the end of 2015 is not small. Cambodia, which joined ASEAN in 1999, also automatically applied "Common Effective Preferential Tariff” (CEPT) for the creation of the ASEAN Free Trade Area (AFTA) which was already started by the first member countries since 1992. AFTA is a core system of AEC established at the end of 2015 and the current ASEAN free trade has been realized by AFTA-CEPT. For the CLM countries, which are economically far behind from the starting member countries such as Singapore, Malaysia and Thailand, the implementation framework of AFTA - CEPT has the mechanism to ensure the implementation of the schedule. The products classification based on the CEPT is Inclusion List (IL)8), Exclusion List (EL), Temporary Exclusion List (TEL), General
Exceptions List (GEL), Sensitive List (SL), and Highly Sensitive List (HSL), with various exclusion regulations and grace periods for CLM countries. This fact gives Cambodia flexibility on industrial protection and trade liberalization. In addition, the achievement deadline shortened by the AFTA-CEPT rescheduling so far has been applied to the latter member countries including Cambodia as well, and the deadline of the tariff elimination is set as 2015. However, the ASEAN Trade in Goods Agreement (ATIGA), signed between ASEAN member countries in February 2009, is a grace period for raw agricultural products on SL and HSL to Cambodia, and as a result deferred the deadline to reduce those tariffs to 0-5% by 20179). Such institutional flexibility in AFTA-CEPT and
AEC is a great help to ensure their feasibility for Cambodia, who is forced to adjust to nation
7㸧The minimum wage in Cambodia is based on an interview survey conducted by the author in the
field, but in principle, it is decided on the basis of the minimum wage in the sewing industry leading the Cambodian economy. The minimum wage that was previously US $ 80 (2013) rose to US $ 120 (2015) by the results of recent labor disputes.
8㸧Although IL was divided into Fast Track (FT) and Normal Track (NT) with different schedule,
"Statement on Bold Measures (SBM)" and "Hanoi Action Plan (HPA) " in 1998 existing classification boundary with tariff rate of 20% was deleted and integrated as a single IL. YOSHIKAWA (2010).
9㸧For details about CEPT and AEC, see ASEAN Secretariat (2011).
6 building and globalization.
Cambodia located at the relay point of the Southern Economic Corridor is receiving business expansion from East and West, "Thai Plus One" and "China Plus One" because of its geographical fortune, but that aspect is determined by AEC there is a possibility of further expansion. In addition, CEPT and ATIGA, which regulate the tariff reduction and elimination schedule for the creation of AFTA, have sufficient flexibility to ensure the feasibility of Cambodia, the latter member state. With the economic corridor and the AEC, the Cambodian economy will be able to benefit from the logistics economy in the Indochina region. Furthermore, globalization in the Indochina region will have an impact on the problems in the Cambodian industry and investment structure, which will be described later.
Figure 1. Main Economic Corridors in Indochina
Source: Author’s Creation.
7
2. Transition of Investment and Trade Situations
2.1 Economic Growth and Transition of Industrial StructureAs mentioned above, in addition to the development plan by NRDP, SEDP-I · II, NSDP, RS I · II · III, Cambodia has undertaken state-owned enterprise reforms and private enterprise development, establishment of investment law and its revision, developed investment incentives by CDC, and promoted transition economy and openness to the outside, and as a result, recorded high economic growth. The trends in gross domestic product (GDP) at constant prices and economic growth rate (Figure 2) show that the economy showed rapid and high economic growth since 2002, particularly from 2004 to 2007 when after Cambodia joined the World Trade Organization (WTO) it recorded an economic growth rate of more than 10%. Although the growth rate sharply declined in 2008 when the Lehman Shock occurred and in the following year, it showed a revival in 2010 and since then it has maintained a high growth rate around 7%10).
While achieving such high economic growth, the Cambodian economy has also changed its industrial structure. According to sectoral share in GDP at constant prices (Table 1), the share of agriculture sector shrunk by 13.3% from 2000 to 2014, while the industrial sector share was 8.9%, and the service sector share was 4.5% expanded. Approximately 75% of the gross domestic added value has been produced by the industrial and service sector, which means that the industrial structure is rapidly changing from the traditional sector to the more value-added modern sector. The aspect of this industrial structural change is also seen in the change in the number of workers engaged in domestic industries in Cambodia (Table 2). According to the trend of the working population by industry sector, agricultural workers still decrease by 9.4% from 2000 to 2014 while the proportion of farmers in the total working population is still high, where industrial sector workers 2% increase, service sector workers increased by 7.3%. Therefore, in Cambodia, about 10% of the working population has shifted from the traditional sector to the modern sector during that period. Thus, in the Cambodian economy, there are still situations where nearly 70% of workers are engaged in the agricultural sector where only 30% of the total added value can be produced, however since 2000 the leading role of industry has been shifting from traditional sector agriculture to industrial and service sector which is the modern sector.
10㸧Cambodia has a high degree of reliance on the Chinese garment industry which had advanced for
the purpose of exporting diversion from the mid-1990s to Europe and the United States, and was greatly affected by the sudden drop in demand in Europe and the United States due to Lehman Shock. YOSHIKAWA (2013).
8
Figure 2. GDP at Constant Prices and the Economic Growth in Cambodia, 2000-2015 (2000 Market Prices)
Table 1. GDP at Constant Prices and the Share by Industrial Origin in Cambodia, 2000-2014 (2000 Market Prices)
* Other service activities include tax, and deduct subsidies on products and imputed bank service charges. Source: Author created from the data of ADB (2016)
7.8% 6.9% 8.5% 10.3% 13.3% 10.8% 10.2% 6.7% 0.1% 6.0% 7.1% 7.3% 7.6% 7.1% 6.9% 0% 2% 4% 6% 8% 10% 12% 14% 0 5,000 10,000 15,000 20,000 25,000 30,000 35,000 40,000 45,000 50,000 2000 2001 2002 2003 2004 2005 2006 2007 2008 2009 2010 2011 2012 2013 2014 2015
GDP ( billion riels ) Growth Rate
Source: Author created from the data of ADB (2016)
Value Share Value Share Value Share Value Share
(billion riels) (%) (billion riels) (%) (billion riels) (%) (billion riels) (%)
5,065.0 35.9 6,475.5 29.4 8,311.0 27.3 9,101.4 22.6 3,078.0 21.8 5,899.7 26.8 8,048.7 26.5 12,340.6 30.7 Mining and quarrying 33.5 0.2 87.0 0.4 193.4 0.6 431.0 1.1 Manufacturing 2,254.8 16.0 4,308.6 19.6 6,179.2 20.3 9,041.3 22.5
Electricity, gas, steam, air conditioning supply, water supply;
sewerage, waste management, and remediation activities 58.1 0.4 103.0 0.5 190.8 0.6 253.9 0.6
Construction 731.6 5.2 1,401.1 6.4 1,485.3 4.9 2,614.4 6.5 5,946.3 42.2 9,634.0 43.8 14,042.8 46.2 18,796.1 46.7
Wholesale and retail trade; repair of motor vehicles and motorcycles 1,512.0 10.7 1,912.8 8.7 2,749.8 9.0 3,545.5 8.8 Accommodation and food service activities 520.9 3.7 953.1 4.3 1,484.8 4.9 2,183.1 5.4 Transportation, storaged, information and communication 930.1 6.6 1,491.1 6.8 1,962.2 6.5 2,584.2 6.4 Financial and insurance activities 175.1 1.2 251.5 1.1 556.6 1.8 905.1 2.2
Real estate activitiese, professional, scientific, technical activities,
administrative and support service activities 855.0 6.1 1,673.5 7.6 1,771.5 5.8 2,549.6 6.3
Public administration and defense; compulsory social security 376.6 2.7 337.1 1.5 392.6 1.3 450.1 1.1 Other service activities * 1,576.6 6.1 3,014.9 8.5 5,125.3 9.7 6,578.3 9.2
14,089.3 100.0 22,009.2 100.0 30,402.4 100.0 40,238.1 100.0
Sector
Total
2005 2010 2014
Agriculture (include forestry and fishing)
Industry
Services
2000
9
Table 2. Employed Persons and Share by Industry in Cambodia, 2000-2014
2.2 Products Trade and Industrial Structure in Cambodia
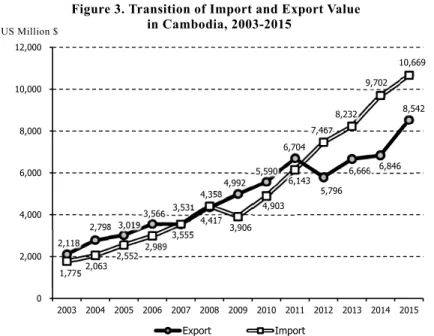
As already mentioned, the Cambodian economy still remains 70% of the labor engaged in low productivity agriculture, however, the shift in industrial structure has advanced to the industrial and service sector, which is the basis of high economic growth. In Cambodia, foreign trade, which is regarded as an engine of growth, has expanded at the same time as its economic growth. According to Figure 3 shows the trend of goods trade from 2003 to 2015, the export value has increased 4 times from about 2.1 billion dollars to about 8.5 billion dollars, and the import value also increased 6 times from about 1.8 billion dollars to 10.6 billion dollars from 2003 to 2015. Since 2012, the trade balance deficit accompanying a decline in exports continues, but imports are on an ongoing trend, and the situation shows that the Cambodian economy is expanding.
Figure 3. Transition of Import and Export Value in Cambodia, 2003-2015
Source: Author created from the data of ADB (2016)
2,118 2,798 3,019 3,566 3,531 4,358 4,992 5,590 6,704 5,796 6,666 6,846 8,542 1,775 2,063 2,552 2,989 3,555 4,417 3,906 4,903 6,143 7,467 8,232 9,702 10,669 0 2,000 4,000 6,000 8,000 10,000 12,000 2003 2004 2005 2006 2007 2008 2009 2010 2011 2012 2013 2014 2015 Export Import
Source: Author created from the data of ITC (2016) US Million $
Persons Share Persons Share Persons Share Persons Share
(thousand) (%) (thousand) (%) (thousand) (%) (thousand) (%)
Agriculture 3,889.0 73.7 4,612.6 60.3 5,122.7 72.3 5,296.6 64.3 Industry 370.6 7.0 742.0 9.7 649.1 9.2 744.4 9.0 Services 1,015.5 19.3 2,294.8 30.0 1,314.5 18.6 2,194.0 26.6 Total 5,275.2 100.0 7,649.4 100.0 7,086.3 100.0 8,235.0 100.0 Sector 2000 2005 2010 2014 䠉㻌㻌㻝㻥㻡㻌䠉
10
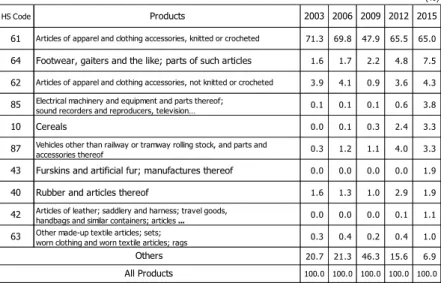
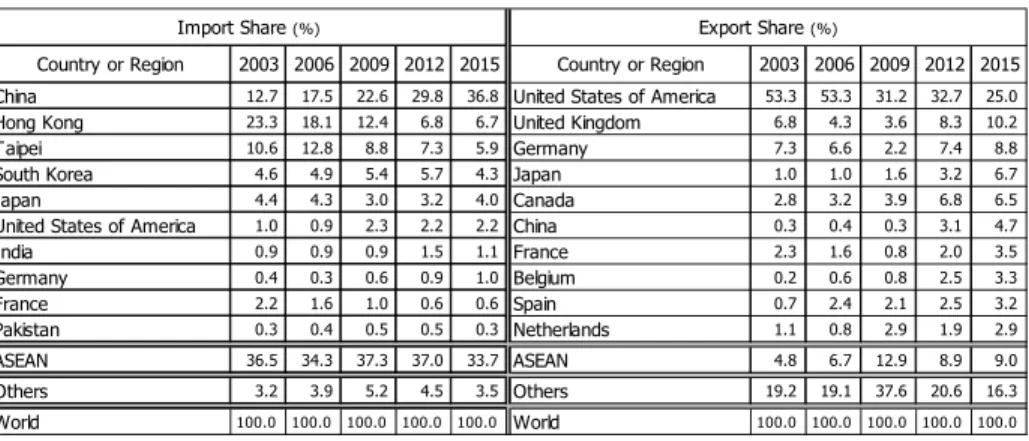
The details of exports are explained in Table 3 showing the major export products and their total trends and Table 5 showing their export partners and their scale. According to these data, “Articles of apparel and clothing accessories, knitted or crocheted” of HS Code 61 and “Articles of apparel and clothing accessories, not knitted or crocheted” of HS Code 62 account for approximately 70%. These classified products are mainly clothing such as suit, jacket, T-shirt, underwear, etc. They are exported to North America / Europe such as USA, UK, Germany and Canada, the share of those exports sharply declined to about 50% due to the decline in demand in Europe and the United States in 2009 as a result of the Lehman Shock. However, “Footwear, gaiters and the like; parts of such articles" of HS Code 64 similar with garment industry has expanded the share of exports to 7.5% since 2012, therefore the garment industry still remains as leading industry and the core of the export industry in Cambodia.
In recent years, the HS Code 85 "Electrical machinery and equipment and parts thereof; sound recorders and reproducers, television image and sound recorders and reproducers” gradually increased their share of export from around 2012. In this classification, electric cables, including automotive wire harnesses, household electric appliances parts, communication equipment (wireless LAN routers, etc.), small electric motors, etc. are exported to Thailand, China and Hong Kong, and this situation reflects the trend towards the base of parts manufacturing factories related to "Thai Plus One" and "China Plus One". For example, in Japanese companies, Minebea (Cambodia) Co., Ltd., established by Minebea Mitsumi who has production plants in Thailand and China, as a microactuator (small electric motor) production plant at the Phnom Penh Special Economic Zone (PPSEZ) from April 2011, and Sumi (Cambodia) affiliated company Sumi (Cambodia) Wiring Systems Co., Ltd. established by Sumitomo Wiring Systems Co., Ltd. who have many production plants in Thailand, China and ASEAN countries, and started the operation in April 2012 as a manufacturing base for wire harnesses11). The operation of intermediate parts manufacturing bases
for exports to Thailand and China by these companies has expanded the share of that classification.
11㸧PPSEZ (2017).
11
Table 3. List of Export Goods Based on HS Classification in Cambodia, 2003-2015
The details of imports are explained using Table 4 showing the major export products and their total trends and Table 5 showing their import partners and their share of values. According to these data, the import of HS Code 60 "Knitted or crocheted fabrics" has expanded its share since 2003 and accounted for about 20% of the total imports since 2006. And similar HS Code 55 "Man-made staple fiber" which is a clothing fabric similar with HS Code 60 rapidly expanded the share of imports since 2004, but shrank by 4.3% in 2009. HS codes 55 and 60 as the clothing fabric is imported mainly from China, Hong Kong and Taiwan as the material of garment products which account for 70% of the export products mentioned above, and the expansion of import share from 2003 is linked with thus exports trends. The background behind this situation is as follows; (1) Most Favored Nation treatment (MFN) was given to Europe and the United States since the 1990s. (2) Joined the World Trade Organization (WTO) in 2004. (3) Because of the factors (1) and (2), Chinese garment enterprises moved to Cambodia to operate and produce, in order to carry out detour exports to Europe and the United States.
In addition, HS Code 87 "Vehicles other than railway or tramway rolling-stock, and parts and accessories" has been increasing its import share since 2006. In that classification, passenger cars and automobiles account for about 30%, freight cars account for about 20%, and motorcycles account for about 20%, and these data are related with the motorization in Cambodia that is progressing with
Source: Author created from the data of ITC (2016)
(%) HS Code Products 2003 2006 2009 2012 2015 61 Articles of apparel and clothing accessories, knitted or crocheted 71.3 69.8 47.9 65.5 65.0
64 Footwear, gaiters and the like; parts of such articles 1.6 1.7 2.2 4.8 7.5
62 Articles of apparel and clothing accessories, not knitted or crocheted 3.9 4.1 0.9 3.6 4.3
85 Electrical machinery and equipment and parts thereof;sound recorders and reproducers, television… 0.1 0.1 0.1 0.6 3.8
10 Cereals 0.0 0.1 0.3 2.4 3.3
87 Vehicles other than railway or tramway rolling stock, and parts andaccessories thereof 0.3 1.2 1.1 4.0 3.3
43 Furskins and artificial fur; manufactures thereof 0.0 0.0 0.0 0.0 1.9
40 Rubber and articles thereof 1.6 1.3 1.0 2.9 1.9
42 Articles of leather; saddlery and harness; travel goods,handbags and similar containers; articles ... 0.0 0.0 0.0 0.1 1.1
63 Other made-up textile articles; sets;worn clothing and worn textile articles; rags 0.3 0.4 0.2 0.4 1.0
20.7 21.3 46.3 15.6 6.9
100.0 100.0 100.0 100.0 100.0
Others All Products
12
economic growth and traffic congestion and accident problems that are getting worse in recent years. And HS Code 84 "Nuclear reactors, boilers, machinery and mechanical appliances; parts products" accounted for about 6% of total import share since 2003, of which 20% for machines for eating and drinking and manufacturing, 6% for sewing machines, 5.7% for civil engineering machines, 5.7% for liquid pumps, and 4.7% for knitting machines. In this way, this classification is mainly composed of capital goods used for civil engineering construction and garment industry, and therefore it has reduced its share in 2009, the year after the Lehman Shock.
Table 4. List of Import Goods Based on HS Classification in Cambodia, 2003-2015
Table 5. List of Import / Export Country and Share with Cambodia, 2003-2015
Source: Author created from the data of ITC (2016)
Source: Author created from the data of ITC (2016)
(%) HS Code Products 2003 2006 2009 2012 2015 60 Knitted or crocheted fabrics 13.2 19.4 18.9 18.9 18.6
87 Vehicles other than railway or tramway rolling stock,and parts and accessories thereof 5.4 7.7 6.5 9.4 10.8
55 Man-made staple fibres 19.7 14.1 9.8 9.8 9.0
84 Machinery, mechanical appliances, nuclear reactors,boilers; parts thereof 4.7 6.3 5.4 6.7 6.3
71 Natural or cultured pearls, precious or semi-precious stones,precious metals, metals clad ... 1.0 0.1 1.4 1.4 5.6
85 Electrical machinery and equipment and parts thereof;sound recorders and reproducers, television ... 3.6 3.6 7.1 3.3 4.8
52 Cotton 3.5 2.0 1.6 2.2 3.6
39 Plastics and articles thereof 1.7 1.9 2.2 1.9 3.0
48 Paper and paperboard; articles of paper pulp, of paper or of paperboard 2.5 2.3 2.4 2.1 2.3
24 Tobacco and manufactured tobacco substitutes 4.2 3.5 4.1 2.3 2.2
40.7 39.1 40.6 42.0 33.9
100.0 100.0 100.0 100.0 100.0
All Products Others
Country or Region 2003 2006 2009 2012 2015 Country or Region 2003 2006 2009 2012 2015 China 12.7 17.5 22.6 29.8 36.8 United States of America 53.3 53.3 31.2 32.7 25.0
Hong Kong 23.3 18.1 12.4 6.8 6.7 United Kingdom 6.8 4.3 3.6 8.3 10.2
Taipei 10.6 12.8 8.8 7.3 5.9 Germany 7.3 6.6 2.2 7.4 8.8
South Korea 4.6 4.9 5.4 5.7 4.3 Japan 1.0 1.0 1.6 3.2 6.7
Japan 4.4 4.3 3.0 3.2 4.0 Canada 2.8 3.2 3.9 6.8 6.5
United States of America 1.0 0.9 2.3 2.2 2.2 China 0.3 0.4 0.3 3.1 4.7
India 0.9 0.9 0.9 1.5 1.1 France 2.3 1.6 0.8 2.0 3.5 Germany 0.4 0.3 0.6 0.9 1.0 Belgium 0.2 0.6 0.8 2.5 3.3 France 2.2 1.6 1.0 0.6 0.6 Spain 0.7 2.4 2.1 2.5 3.2 Pakistan 0.3 0.4 0.5 0.5 0.3 Netherlands 1.1 0.8 2.9 1.9 2.9 ASEAN 36.5 34.3 37.3 37.0 33.7 ASEAN 4.8 6.7 12.9 8.9 9.0 Others 3.2 3.9 5.2 4.5 3.5 Others 19.2 19.1 37.6 20.6 16.3 World 100.0 100.0 100.0 100.0 100.0 World 100.0 100.0 100.0 100.0 100.0
Import Share (%) Export Share (%)
13
2.3 Trend of FDI inflow and Characteristics in Cambodia
Transition of industrial structure in Cambodia and steady economic growth were not realized only by domestic development policies and economic transition. FDI is indispensable for the economic development of Cambodia with poor capital accumulation. They are expected to come to Cambodia due to internal factors such as openness to the outside economies and inexpensive labor forces and external factors such as the base of the South Economic Corridor and the expectation for AEC. According to Table 6, which shows trends in FDI inflows from 2004 to 2014, the FDI that flowed into the Southeast Asia region during the decade from 2004 to 2014 will increase from 39.3 billion dollars to 136.1 billion dollars in ASEAN10 countries, and in ASEAN6 countries, Singapore and Indonesia have been tougher and tripled from 37.3 billion dollars to 123.3 billion dollars. In addition, the CLMV countries have been towed by Vietnam and have expanded more than six times from 2 billion dollars to 12.7 billion dollars, and the FDI for Southeast Asia region is still expanding, regardless of the first member countries or latecomer members. Likewise, the FDI inflows into Cambodia are also expanding. There is a decline due to the impact of the Lehman Shock from 2008 to 2010, ranging from 131 million dollars to 1,727 million dollars in the decade from 2004 to 2014. Although its size is still small compared to the first member countries, the growth rate is the second highest after Laos in ASEAN countries as a whole.
Table 6. FDI Inflows in ASEAN by Host Country, 2004 - 2014
Source: ASEAN Secretariat (2016)a
2004 2005 2006 2007 2008 2009 2010 2011 2012 2013 2014 Brunei Darussalam 206 289 434 260 330 371 625 1,208 865 725 568 Indonesia 1,895 8,336 4,914 6,928 9,318 4,877 13,771 19,242 19,138 18,444 22,276 Malaysia 4,624 4,064 6,072 8,538 7,248 1,405 9,156 12,001 9,400 12,297 10,714 Philippines 688 1,854 2,921 2,916 1,544 1,963 1,298 1,816 2,797 3,860 6,201 Singapore 24,103 17,299 36,613 46,338 11,115 25,036 55,035 45,774 60,980 56,138 72,098 Thailand 5,862 8,048 9,460 11,330 8,539 4,853 9,112 3,861 10,699 13,000 11,538 ASEAN6 37,377 39,891 60,414 76,311 38,095 38,506 88,996 84,902 103,879 104,465 123,395 Cambodia 131 381 483 867 815 539 783 892 1,557 1,275 1,727 Lao PDR 17 28 187 324 228 319 333 467 294 427 913 Myanmar 251 236 428 715 976 963 2,249 2,058 1,354 2,621 946 Viet Nam 1,610 1,954 2,400 6,700 9,579 7,600 8,000 7,519 8,368 8,900 9,200 CLMV 2,010 2,599 3,498 8,606 11,597 9,421 11,364 10,936 11,574 13,222 12,786 ASEAN 39,386 42,489 63,912 84,917 49,693 47,927 100,360 95,838 115,453 117,687 136,181 in US Million $ 䠉㻌㻌㻝㻥㻥㻌䠉
14
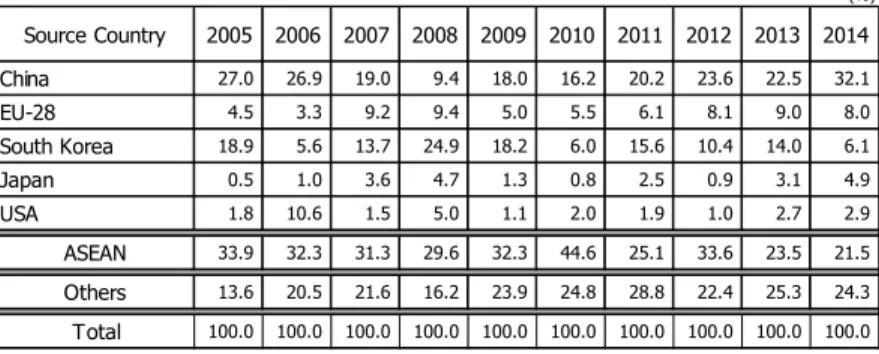
Table 7. Share of FDI Inflows in Cambodia by Source Country 2005 - 2014
Factors contributing to the increase in FDI inflows to Cambodia are as follows: (1) The amendment of the Investment Law in 2003, which included investment incentives such as corporate tax exemption and QIP measures, was made regardless of foreign capital. (2) Accession to the WTO in 2004. Regarding the latter's accession to WTO, China, which had been a member of the WTO in 2001, has received Non-Tariff Barriers (NTBs) such as the Import licenses, quantitative restrictions based on the Multi Fiber Arrangement (MFA) since 1974 from western developed countries until 2005. On the other hand, Cambodia had received MFN from those countries since the 1990s, many Chinese garment enterprises have advanced to Cambodia12). Table 7, which shows the trends of FDI
inflows into Cambodia by country, China occupies a large FDI share except 2008 and 2009 when remain the influence of Lehman Shock, and in 2014 it has occupied an overwhelming share of 32.1%. FDI by Korea and EU countries has been actively carried out. However, the difference between China and those countries is extremely large, and the FDI from China has exceeded the FDI inflows from ASEAN10, which had a large share until 2010.
12㸧The Chinese network also contributed Chinese enterprises to Cambodia. PENGHUY (2011), P19.
Source: ASEAN Secretariat (2016)a
(%) Source Country 2005 2006 2007 2008 2009 2010 2011 2012 2013 2014 China 27.0 26.9 19.0 9.4 18.0 16.2 20.2 23.6 22.5 32.1 EU-28 4.5 3.3 9.2 9.4 5.0 5.5 6.1 8.1 9.0 8.0 South Korea 18.9 5.6 13.7 24.9 18.2 6.0 15.6 10.4 14.0 6.1 Japan 0.5 1.0 3.6 4.7 1.3 0.8 2.5 0.9 3.1 4.9 USA 1.8 10.6 1.5 5.0 1.1 2.0 1.9 1.0 2.7 2.9 ASEAN 33.9 32.3 31.3 29.6 32.3 44.6 25.1 33.6 23.5 21.5 Others 13.6 20.5 21.6 16.2 23.9 24.8 28.8 22.4 25.3 24.3 Total 100.0 100.0 100.0 100.0 100.0 100.0 100.0 100.0 100.0 100.0 䠉㻌㻌㻞㻜㻜㻌䠉
15
Table 8. Share of FDI Inflows and Stocks based on Market Values in Cambodia by Industrial Sector, 2011-2014
(%)
According to Table 8, which shows the share of FDI flowing into Cambodia by industry, FDI flows into Cambodia was 15.2% for agriculture, 28% for manufacturing industry and 15.5% for real estate industry in 2014. Agriculture FDI flows into Cambodia because Cambodia has abundant water resources and inexpensive labor and agricultural FDI has a three-year priority period with QIP based on the revised investment law and tax exemption (Tax holiday) 13 ). The agricultural FDI in
Cambodia is actively being carried out for natural rubber and cassava cultivation by ASEAN countries.
As for the manufacturing industry, the garment industry has been driving the increase in FDI to this sector, and the share of FDI for the garment industry has increased from 18.4% to 26.4% from 2011 to 2014. RGC has adopted the Cambodia Industrial Development Policy 2015-2025 (CIDP) in March 2015 and aims to set the GDP share of the industrial sector to 30% by 2025 , It is not difficult to achieve that goal from the present condition, provided that FDI for the garment industry continues. However, the goal of converting from traditional labor-intensive industries to technology and knowledge intensive industries which placed in this policy also may be difficult to achieve because FDI inflow trends are biased to the labor intensive garment industry14).
13㸧CDC (2013).
14㸧For details of CIDP, see RGC (2015).
Source: Author created from the data of NBC and NIS (2016).
2011 2012 2013 2014 2011 2012 2013 2014 13.8 13.9 14.0 14.1 17.6 14.4 14.1 15.2
1.1 1.1 1.0 1.0 1.0 0.9 0.8 0.8
Garment and footwear 17.7 19.1 19.6 20.5 18.4 24.6 22.4 26.4
Packaging 0.7 0.7 0.9 0.9 0.4 1.0 1.9 0.7 Others 3.9 3.2 2.7 2.5 0.0 0.4 0.4 0.9 Total of Manufacturing 22.2 23.0 23.3 23.9 18.8 26.0 24.7 28.0 Bank 9.6 10.8 10.2 10.1 5.4 15.4 7.2 9.2 Microfinance institutions 0.8 1.2 1.3 1.7 1.1 2.7 2.1 3.9 Non-Bank 0.9 0.8 0.7 0.6 0.2 0.2 0.2 0.2
Total of Financial Activities 11.3 12.7 12.2 12.3 6.7 18.3 9.5 13.3 13.1 12.1 11.3 11.0 9.4 8.1 7.4 9.0 5.3 4.3 3.6 3.1 0.8 0.1 0.0 0.2 2.3 2.1 1.9 1.8 2.9 1.3 1.3 1.1 11.5 11.8 12.2 11.4 19.3 13.2 14.2 6.2 13.6 13.7 14.4 14.6 21.9 14.1 18.0 15.5 5.8 5.3 6.1 6.7 1.6 3.5 10.1 10.7 100.0 100.0 100.0 100.0 100.0 100.0 100.0 100.0 Others Total Construction Electricity Real estate Mining and quarrying Manufacturing Financial activities Accomodation Telecommunication Stocks Flows Agriculture 䠉㻌㻌㻞㻜㻝㻌䠉
16
Regarding the real estate industry, after taking a record of 21.9% in 2011, it also holds a high share and gradually increases its share of stock. This situation is due to the fact that real estate development FDI by China and Korea is increasing in recent years15). The ownership of real estate by
foreigners and foreign capital is limited only to condominiums of more than first floor because ownership of land by foreigners and foreign capital is prohibited in principle under Article 44 of the Constitution of Cambodia16). Therefore, when developing real estate as a business under FDI, it is
limited to implementing in the form of agency contract through third party such as land lease and joint venture with local capital. According to Table 9 showing the current state of real estate FDI from 2010 to 2015, under such conditions, personal transfer has increased about 6 times from 89 million dollars to 519 million dollars, equity investment increased about 2.5 times from 436 million dollars to 1,037 million dollars under such conditions of limited to own real estate. In particular, the latter has increased rapidly since 2013, and non-enterprise investment in these has been mainstreamed by China. Such non-enterprise investment which aimed at asset management for individuals is mainly conducted by Chinese investors, and Chinese and Korean developers support it. Developer’s property ownership by nationality in 2014 show that South Korea is 1,248 million dollars, and China is 756 million dollars, overwhelming the other countries17). In addition, these
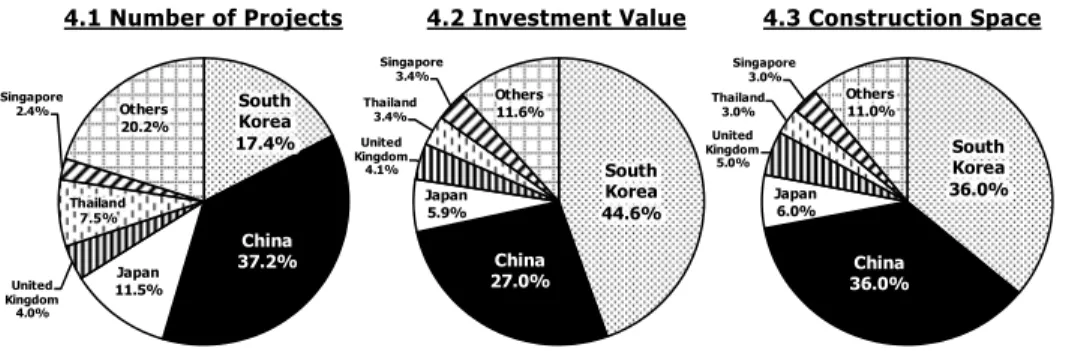
developers have activated FDI for individual real estate for asset management. In addition, FDI for construction work in line with real estate FDI has increased both in construction space and value, and according to Figure 4 which shows the implementation by country, China and South Korea occupy about 70% of the total space and value, these situations have strongly links with real estate ownership of developers by country.
15㸧NBC and NIS (2016), P17.
16㸧Exceptionally, the way foreigners or foreign companies own land in Cambodia are: (1) A joint
venture with a Khmer capital of 51% or more. (2) Spouse who got married to a person of Khmer citizenship. (3) Person who acquired Cambodian nationality after 7 years have passed since immigration. For details of those, see CDC (2013), III-53.
17㸧NBC and NIS (2016), P19.
17
Table 9. Real Estate FDI and Construction Projects in Cambodia, 2010-2015
Figure 4. Share of Construction Projects by Country in Cambodia, 2000-2015
3. Conclusion
As we have seen, RGC has been developing various development policies (NRDP, SEDP-I · II, NSDP, RS I · II · III), state enterprise reform and private enterprise development, establishment of investment law and its reform, and investment incentives for foreign capital, and Cambodia have been on the path of transition and becoming an open economy. As a result, Cambodia achieved an economic growth rate exceeding 7% since 2000 and shows the aspect of industrial transition from agriculture as the traditional sector to industry and service sector as the modern sector, which is based on the support from international trade and FDI.
Regarding the foreign trade in Cambodia, the export values has increased four times and the
Source: Author created from the data of NBC and NIS (2016).
4.1 Number of Projects 4.2 Investment Value 4.3 Construction Space
Source: Author created from the data of NBC and NIS (2016).
2010 2011 2012 2013 2014 2015
3,287,468 4,194,203 6,528,452 7,596,151 6,460,148 7,686,112
2,149 2,125 1,694 1,641 1,960 2,305
841 1,226 2,109 2,773 2,507 3,338
566 402 413 1,484 2,644 2,152
Personal transfars (Workers' remittances) 89 129 159 400 416 519
Equity investment in Cambodia 436 263 241 957 1,638 1,037
Investment in real estate in Cambodia 䇷 䇷 䇷 102 437 380
Deposits of nonresidents in domestic banks 40 10 13 25 154 216
Real Estate FDI (in US$ millions)
Construction Space (square meters)
All Projects
Investment Value (in US$ million)
South Korea 17.4% China 37.2% Japan 11.5% United Kingdom 4.0% Thailand 7.5% Singapore 2.4% Others 20.2% South Korea 44.6% China 27.0% Japan 5.9% United Kingdom 4.1% Thailand 3.4% Singapore 3.4% Others 11.6% South Korea 36.0% China 36.0% Japan 6.0% United Kingdom 5.0% Thailand 3.0% Singapore 3.0% Others 11.0% 䠉㻌㻌㻞㻜㻟㻌䠉
18
import values has increased six times from 2003 to 2015. The situation of such a strong trade expansion in Cambodia has been towed by the garment industry which processes clothing fabrics imported from China, Hong Kong and Taiwan and exports those processed products to North America and Europe and was created by Chinese garment enterprises which looking at the geographical favorable environment to enter and operate Cambodia as a base for detour export. However, although Cambodia is a garment industry-led trading structure, there has been a transition that reflects the establishment of an intermediate component manufacturing plant related to Thai Plus One and China Plus One in recent years. And Cambodia economy is confronted with increase in export of intermediate parts of durable consumer goods and import of passenger cars, cars, freight cars and motorcycles with the motorization, its trade structure is beginning to change.
Foreign capital has also played a major role in making the foundation for industry and trade, in lieu of scarce capital accumulation in Cambodia. FDI inflow to Cambodia increased 13 times from 131 million dollars to 1,727 million dollars in the decade from 2004 to 2014, with the growth rate at the second highest level among all ASEAN countries. Background to the increase in FDI inflows to Cambodia is that investment incentives such as corporate tax exemption and QIP measures are being carried out without distinguishing foreign capital, and MFN treatment from Western countries and WTO accession. And many Chinese garment enterprises which aimed at these transferred to Cambodia, a lot of FDI inflows mainly in the manufacturing industry. The trend has continued in recent years, and the FDI for the garment industry has increased from 18.4% in total to 26.4% from 2011 to 2014.
However, in recent years, changes and concerns have arisen in the FDI trends mentioned above. We must pay attention to the fact that FDI for real estate occupies a high share after recording, reaching 21.9% in 2011. From 2010 to 2015 real estate FDI for personal transfer increased about 6 times, and real estate FDI for equity investment about 2.5 times. Especially the real estate FDI of equity investment has increased sharply since 2013, and real estate FDI aimed at such personal asset management is completed in a composition that Chinese and Korean developers mainly supply to Chinese investors. In other words, these are "speculative FDI" aiming at investment demand of Chinese investors, and they depend heavily on Chinese and Korean developers and Chinese investors. If external risks arise, the negative impact on the sector will be decisive for Cambodia. Cambodia and RGC has to watch out for such speculative real estate FDI in order to avoid the negative influence like the Lehman Shock.
19
References:
ADB (2006), Initial Review of the Greater Mekong Subregion Transport Sector Strategy 2006-2015, Asian Development Bank.
ADB (2007), Key Indicators for Asia and the Pacific 2007, Asian Development Bank. ADB (2014), Key Indicators for Asia and the Pacific 2014, Asian Development Bank.
ADB (2016), Key Indicators for Asia and the Pacific 2016 47th edition, Asian Development Bank. AMAKAWA Naoko (2001a), Nǀchi shoynj no seido to kǀzǀ. In: Naoko AMAKAWA, ed. 2001.
Cambodia no fukkǀ kaihatsu. Institute of Developing Economies, Japan External Trade
Organization.
AMAKAWA Naoko (2001b), Cambodia ni okeru kokumin kokka keisei to kokka no ninaite. In: Naoko AMAKAWA, ed. 2001. Cambodia no fukkǀ kaihatsu. Institute of Developing Economies, Japan External Trade Organization.
ASEAN Secretariat (2011), ASEAN Document Series 2009, ASEAN Secretariat. ASEAN Secretariat (2013), ASEAN Document Series 2012, ASEAN Secretariat. ASEAN Secretariat (2016a), ASEAN Statistics Year Book 2015, ASEAN Secretariat. ASEAN Secretariat (2016b), Joint Statement of the ASEAN-U.S. Special Leaders’ Summit:
Sunnylands Declaration (Sunnylands, California, 15-16 February 2016),
http://www.asean.org/wp-content/uploads/2016/02/Sunnylands-Declaration-FINAL-16-Feb-2016 .pdf [Accessed 18 December 2016], ASEAN Secretariat HP.
CDC (2012), Cambodia tǀshi gaidobukku: 2012, Council for the Development of Cambodia. CDC (2013), Cambodia tǀshi gaidobukku: 2013, Council for the Development of Cambodia. HAJIKANO Naomi (2006), Kanbojia no kǀgyǀ-ka ʊ jiynj-ka no kachnj ni aru seizǀ-gyǀ to sono
ninaite. In: Naoko AMAKAWA, ed. 2006. Kǀhatsu asean shokoku no kǀgyǀ-ka ʊ CLMV
shokoku no keiken to tenbǀ. Institute of Developing Economies, Japan External Trade
Organization.
HAMADA Tetsuro (1999), Japan’s Official Development Assistance (ODA) to the Least among Less Developed Countries (LLDC) ʊ With Special Reference to Japan’s Aid Programming Mechnism against the Aid Coordination System of Cambodia. Forum of International Development Studies,
13. Graduate School of International Development, Nagoya University.
INADA Juichi (2013a), Analysis of the Survey on Social Capital in Cambodia. The Senshu Social
Capital Review, 4. Senshu University.
INADA Juichi (2013b), Kanbojia no fukkǀ kaihatsu purosesu to Nihon no enjo tǀshi. Shakai kagaku
nenpǀ, 47. Senshu University.
ITC (2016), International trade statistics 2001-2016,
http://www.intracen.org/itc/sectors/services/tradestatistics/ [Accessed 5 February 2017], International Trade Center Home Page.
JBIC (2008), Cambodia no tǀshi kankyǀ. chnjken chnjshǀkigǀ shien-shitsu, Japan Bank for International Cooperation
JICA (2001), Poverty Profile Final Report: Kingdom of Cambodia, Japan International Corporation
20 Agency, Japan.
KUBO Koji (2006), CLMV shokoku ni okeru kǀgyǀ-ka keizai seichǀ to ginkǀ bumon. In: Naoko AMAKAWA, ed. 2006. Kǀhatsu asean shokoku no kǀgyǀ-ka ʊ CLMV shokoku no keiken to
tenbǀ. Institute of Developing Economies, Japan External Trade Organization.
NBC and NIS (2016), Report on Foreign Direct Investment Survey Results 2014, National Bank of Cambodia and National Institute of Statistics of Ministry of Planning.
NIS (2011), Statistical Yearbook of Cambodia 2011, National Institute of Statistics, Ministry of Planning, Cambodia.
PENGHUY Ngov (2011), Shijǀkeisei ikǀ-go no Cambodia ni okeru gaishi no yakuwari. In: KOBAYASHI Satoru, ed. Cambodia after the Marketization of Its Economy: An Examination of
Three Facets of Economic Development. Kyoto Working Papers on Area Studies No.115, G-COE Series 113, Center for Southeast Asian Studies, Kyoto University.
PPSEZ (2017), Customers at Phnom Penh SEZ,
http://www.ppsez.com/en/about-us/our-customers.html [Accessed 25 January 2017], Phnom Penh Special Economic Zone Home Page.
RGC (2004), Rectangular Strategy for Growth, Employment, Equity and Efficiency; First Cabinet
Meeting of the Third Legislature of the National Assembly at the Office of the Council of Ministers. Royal Government of Cambodia.
RGC (2008), Rectangular Strategy for Growth, Employment, Equity and Efficiency Phase II; First
Cabinet Meeting of The Third Legislature of the National Assembly at the Office of the Council of Ministers. Royal Government of Cambodia.
RGC (2013), Rectangular Strategy for Growth, Employment, Equity and Efficiency Phase III; First
Cabinet Meeting of The Third Legislature of the National Assembly at the Office of the Council of Ministers. Royal Government of Cambodia.
RGC (2015), Cambodia Industrial Development Policy 2015-2025 “Market orientation and Enabling
Environment for Industrial Development”: Approved by Council of Ministers at Its Plenary Meeting on 06 March 2015. Royal Government of Cambodia.
SIPHANA Sok (2005a), Lessons from Cambodia’s Entry into the World Trade Organization, ADBI RESEARCH POLICY PAPER No. 7, Asian Development Bank Institute.
SIPHANA Sok (2005b), Cambodia enters the WTO: Lessons learned for Least Developed Countries, ADBI RESEARCH POLICY BRIEF No. 16, Asian Development Bank Institute.
YOSHIKAWA Keisuke (2010), The Change and the Development Mechanism of the ASEAN Economic Cooperation ʊ Measures to Outside Proposals and International Situations. Doctoral dissertation, Yokohama National University.
YOSHIKAWA Keisuke (2013), Foreign weakness of the Economy in Cambodia: Deflection of the
Industrial Structure and the Influences. Shǀkeironsǀ 53 (3). Kyushu Sangyo University.