contributing to G0 quiescence survival in fission yeast S. pombe
Author Caroline Starzynski Degree Conferral
Date
2017‑12‑31
Degree Doctor of Philosophy Degree Referral
Number
38005甲第10号 Copyright
Information
(C) 2017 The Author
URL http://doi.org/10.15102/1394.00000174
contributing to G0 quiescence survival in fission yeast S. pombe
By Caroline Starzynski
Supervisor Prof. Mitsuhiro Yanagida
ii
I, Caroline Starzynski, declare that this thesis entitled ‘Investigation on conserved mechanism contributing to quiescence survival’ and the data presented in it are original and my own work.
I confirm that:
• No part of this work has previously been submitted for a degree at this or any other university.
• References to the work of others have been clearly acknowledged. Quotations from the work of others have been clearly indicated, and attributed to them.
• In cases where others have contributed to part of this work, such contribution has been clearly acknowledged and distinguished from my own work.
• None of this work has been previously published elsewhere.
Date: December 4th, 2017
Signature:
iii
I would like to thank my supervisor Prof. Mitsuhiro Yanagida for accepting me, a rather ‘simple-minded’ student, and introducing to me a more sophisticated view on science. Right at the beginning I was only led by my naïve desire to do science but was completely ignorant of the stony way which comes along. Surely, there were many moments of bitterness and failure from my side but his kind patience and critical comments served as a source of motivation. Prof. Yanagida has a sharp mind of a great scientist. He truly was a wise source of knowledge and inspiration to me, for both work and life. His discussions were very valuable and contributed greatly to the development of my thesis.
I am also very thankful to the researcher of the G0 unit, Dr. Kenichi Sajiki, who guided me loyally throughout my thesis work, by teaching me the ‘core’ of scientific work and analysis. He taught me how to efficiently plan experimental approaches and explained to me the importance of conveying a nice and focused scientific story.
Moreover, I am grateful to the technician of the G0 unit, Ms. Ayaka Mori, who contributed greatly to the experiments presented in this thesis. Also, Yuria Tahara, a technician in the same lab, was always there if I had a question and helped me out with the Delta vision microscope.
Finally, I would like to express words of gratitude to the members of the G0
unit who were very supportive throughout my time as a PhD student in the lab.
iv
A list of all relevant abbreviations that were used throughout this thesis is presented below:
•
[4Fe-4S], iron-sulfur cluster;
•
2-OG, 2-oxoglutarate;
•
AAT, aspartate aminotransferase;
•
BCAA, branched-chain amino acids;
•
BLAST, Basic Logic Alignment Search Tool;
•
BLOSUM, blocks substitution matrix;
•
CoQ, ubiquinone;
•
DHADH, Dihydroxy-acid dehydratase;
•
EMM2, Edingburgh minimal medium No. 2
•
EMM2-N, Edingburgh minimal medium No. 2 without added nitrogen source
•
ETC, electron transfer chain;
•
ETF, electron transferring flavoprotein;
•
G0, Gap 0 phase
•
GDH, glutamate dehydrogenase;
•
GZE, G zero essential;
•
HICDH, homoisocitrate dehydrogenase;
•
NADH, nicotinamide adenine dinucleotide hydrogen
•
OCR, oxygen consumption rate;
•
Redox, reduction-oxidation reactions
•
SOD, superoxide dismutase;
•
VE, vegetative phase;
•
YE; yeast extract
•
YPD; yeast, polypeptone, D-glucose
v
Since all living organism rely on assimilating environmental nitrogen (N) to promote cell divisions, an efficient system to deal with N scarcity is deterministic for survival.
For example, the fission yeast Schizosaccharomyces pombe (S. pombe) withstands long-term N starvation by induction of growth arrest and quiescence entry (G0 phase).
In past studies 89 S. pombe genes were found to be required for survival upon G0 phase.
Because these are involved in diverse intracellular functions, a clear mechanism for quiescence was difficult to assign. Therefore, we developed a BLAST-based approach to generate phylogenetic profiles and characterize evolutionary conserved metabolic reactions by comparative analysis using prokaryotic databases of Escherichia coli and Bacillus subtilis. We report fourteen proteins fulfilling this study’s homology criteria, half of which (7/14) are localized to the mitochondria. Subsequent in silico analysis suggests the involvement of two functional response mechanisms which comprise oxygen-consuming and glutamate-metabolic reactions. Among these, ∆sod2 showed abnormally low oxygen consumption upon quiescence and loss of regenerative capability. We report that the conserved mechanisms to survive N starvation comprise enzymes which are associated with the regulation of oxygen and glutamate- oxoglutarate metabolism.
Redox maintenance Superoxide scavenging
Amino acid biosynthesis
Evolu&onary conserved G0 survival mechanism
Oxygen-regulatory/responsive reac<ons
Glutamate/oxoglutarate responsive
reac<ons
vi 1. Introduction
1. Introduction ... 1
1.1 An introduction to the cell cycle and quiescence ... 1
1.2. Fission yeast- A crucial model organism for cell cycle studies and beyond ... 3
1.3. Past genetic screenings with S. pombe ... 5
1.4. Previous work on the identification of G0 regulatory players ... 8
1.5. G0 survival essential genes support viability during N starvation ... 10
1.6. Search for common G0 survival mechanism conserved in bacteria and S. pombe ... 13
2. Materials and Methods 2. Materials and Methods ... 15
2.1. Investigating the conservation of G0 survival essential gene products ... 15
2.1.1 Protein homology search ... 15
2.1.2. Multiple sequence alignments and search for conserved sites ... 16
2.1.3. Generation of phylogenic trees by MEGA 6 ... 16
2.1.4. Oxygen consumption measurements ... 17
2.1.5. Imaging of GZE deletion mutants ... 18
2.2. Study on UbiB family member SPBC21C3.03 ... 18
2.2.1. Strains and cell culture conditions ... 18
2.2.2. UbiB family member protein sequence alignments ... 19
2.2.3. Microscopy ... 19
2.2.4. Drug sensitivity screening by spot test in vegetative cells ... 19
2.2.5. Drug sensitivity screening during G0 phase ... 20
3. Results 3. Results ... 21
3.1 Roughly a dozen highly conserved GZE proteins ... 21
vii
3.4. Four mitochondrial amino acid biosynthetic enzymes ... 36
3.4.1. GZE enzymes generating amino acid precursors – Lys12 and Ilv3 ... 36
3.4.2. Carbon-nitrogen metabolism associated enzymes Gdh1 and Maa1 ... 52
3.4.2.1. Investigating sequence ID variability in selected GZE homologs ... 62
3.5. Electron transfer chain linked GZE- Nde1 and Coq5 ... 75
3.5.1. Investigating sequence ID variability in Coq5 ... 88
3.6. Protein of unknown function SPBC21C3.03 ... 90
3.6.1 Protein function of SPBC21C3.03, a UbiB family member, remains unclear ... 97
3.7. Summary of phylogeny study and literature review ... 99
3.8. Oxygen consumption measurements in S. pombe ... 101
4. Discussion 4. Discussion ... 107
4.1. Mitochondria – Central hub for conserved N starvation mechanisms ... 107
4.2. Conclusion ... 116
5. References ... 117
6. Appendix ... i
viii
List of Figures
Figure 1.1 Shuttling between quiescent and proliferative states ... 2
Figure 1.2. Methodology to induce G0 phase in S. pombe ... 6
Figure 1.3. Summary of past studies on S. pombe G0 regulations ... 7
Figure 1.4. History of identification of G0 survival genes ... 9
Figure 1.5. Experimental design for GZE gene screening ... 11
Figure 1.6. Overview of GZE gene products by latest –N screening ... 12
Figure 3.1. The highly conserved GZE proteins ... 29
Figure 3.2. BLAST pairwise alignments against Sod2 ... 32
Figure 3.3. Sod2 aligned with its homologs ... 33
Figure 3.4. SOD phylogeny reconstruction ... 35
Figure 3.5. Lysine biosynthetic pathway ... 38
Figure 3.6. BLAST pairwise alignments against Lys12 ... 39
Figure 3.7. Lys12 aligned against its bacterial homologs ... 41
Figure 3.8. β-decarboxylating dehydrogenase family phylogeny ... 43
Figure 3.9. Paralelling reaction mechanisms among Lys12 paralogs ... 45
Figure 3.10. Branched-chain amino acid biosynthetic pathway ... 47
Figure 3.11. BLAST pairwise alignments with SPAC17G8.06c/Ilv3 ... 48
Figure 3.12. Alignment of SPAC17G8.06c/Ilv3 and its homologs ... 49
Figure 3.13. DHADH phylogeny reconstruction ... 51
Figure 3.14. Relative protein level change of TCA cycle proteins ... 53
Figure 3.15. BLAST pairwise alignments against Gdh1 ... 55
Figure 3.16. Alignment of Gdh1 and its homologs ... 56
Figure 3.17. BLAST alignments against Maa1 ... 59
Figure 3.18. Alignment with Maa1 and its homologs ... 60
Figure 3.19. Branch topology of Gdh1 and its homologs ... 69
Figure 3.20. Branch topology of Maa1 and its homologs ... 74
Figure 3.21. Relative protein level changes in the respiratory chain ... 76
Figure 3.22. BLAST pairwise alignments with Nde1 ... 78
Figure 3.23. Alignment of Nde1 and its bacterial homologs ... 79
Figure 3.24. Alternative NADH dehydrogenase phylogeny reconstruction ... 81
Figure 3.25. CoQf ubiquinone biosynthetic pathway ... 83
Figure 3.26. BLAST pairwise alignments against Coq5 ... 85
Figure 3.27. Alignment with Coq5 and its homologs ... 86
ix
Figure 3.30. Alignments of SPBC21C3.03 and its bacterial homologs ... 93
Figure 3.31. UbiB family phylogeny reconstruction ... 96
Figure 3.32. Functional setting of conserved GZE within mitochondria ... 100
Figure 3.33. Oxygen consumption rates in WT during VE and G0 ... 102
Figure 3.34. Oxygen consumption rates of VE deletions strains ... 104
Figure 3.35. Oxygen consumption rates of G0 deletions strains ... 105
Figure 4.1. Localization of S. pombe proteins conserved in bacteria ... 110
Figure 4.2. Overview of ancient N starvation reactions within the mitochondria ... 111
Figure 4.3. Basic amino acid pool generation mechanism ... 115
List of Tables Table 2.1. Overview of the internet-accessible resources used ... 16
Table 2.2. Chemical agents used for the spot test experiments ... 19
Table 3.1. BLASTp homology search results ... 23
Table 3.2. Fourteen highly conserved GZE proteins ... 26
Table 3.3. Ability to regenerate from N starvation induced quiescence ... 29
Table 3.4. Variable degree of conservation between GZE alignments ... 65
Table 3.5. Overview of the organisms used for phylogeny study ... 66
List of Supplementary Figures (located in the Appendix) Figure S1 Phylogenic reconstruction of Gdh1 homolos ... i
Figure S2 Phylogenic reconstruction of Maa1 homologs ... ii
Figure S3 Phylogenic reconstruction of Coq5 homologs ... iii
Figure S4 Sequence comparison between S. pombe and UbiB family members ... iv
Figure S5 Morphology of vegetative strains ... v
Figure S6 Morphology of G0-arrested cells ... vi
Figure S7 Oxidative stress inducing hydrogen peroxide screening ... vii
Figure S8 Oxidative stress inducing t-BOOh screening ... viii
Figure S9 Oxidative stress inducing paraquat screening ... ix
Figure S10 Fatty acid synthetase inhibiting Cerulenin screening ... x
Figure S11 Microtubule inhibitor Thiabendazole screening ... xi
Figure S12 Respiratory complex III inhibiting Antimycin A screening ... xii
x
Figure S15 DNA damaging Camptothecin screening ... xv
Figure S16 Mitochondrial protein biosynthesis blocking Erythromycin screening ... xvi
Figure S17 Golgi transport blocking Monensin screening ... xvii
Figure S18 ER blocker Tunicamycin screening ... xviii
Figure S19 Iron chloride screening ... xix
Figure S20 Copper sulfate screening ... xx
Figure S21 Cadmium sulfate screening ... xxii
Figure S22 Summary of drug screening results ... xxiv
Figure S23 Drug screening under G0 conditions with H
2O
2and Antimycin A ... xxv
Figure S24 Drug screening under G0 conditions with H
2O
2and Cerulenin ... xxvi
Figure S25 Polyadenylation sites in SPBC21C3.03 ORF ... xxvii
1. Introduction
1.1. An introduction to the cell cycle and quiescence
Cell growth relies on a series of intracellular events occurring in a cyclic pattern, designated as ‘the cell cycle’. It is defined by distinct phases comprising DNA replication (S phase), chromosome segregation and subsequent cell division (M phase) yielding two daughter cells. Gap phases, G1 and G2, follow M and S phase, respectively. Progression from one event to the other needs to go through cell cycle check points which control that prerequisites for cell progression are met (Saka et al., 1994, Hartwell and Weinert, 1989). In eukaryotic organisms environmental clues, such as nutritional signals, and growth hormone availability are required for the progression through the cell cycle (MillerNorbury and Nurse, 1989). This makes the regulatory mechanism of the cell cycle progression into a deterministic factor for cell fate and thus, survival (Evans et al., 1983, Murray et al., 1989). The absence of the required proliferative signals is known to abolish cell cycle progression and divert the cell into a resting phase termed quiescence or G0 (Augenlicht and Baserga, 1974, Temin, 1971).
The transition from active cell cycle to quiescence phase is reversible upon addition of
growth signals (Pardee, 1974, Zetterberg and Larsson, 1985). There are cell types which
need to switch between these two states. Adult stem cells, for instance, usually exist in
that quiescent mode (Figure 1.1.) which is thought to preserve its cellular integrity and
thus, supports viability and tissue regenerative properties (Sperka et al., 2012). The
ability to transit between these two phases is therefore of great importance to tissue
integrity (Sherr, 1996). Since cellular physiology and metabolic organization change
upon G0 phase entry, the question arises what genetic regulations are responsible for
Figure 1.1. Stem cells shuttle between quiescent and proliferative states. Human adult stem cells exist in the non-dividing or resting phase, termed quiescence. To self- renew or contribute to tissue regeneration cells transit into proliferating mode. Surely, stem cells need to enter the cell cycle to produce differentiated daughter cells upon tissue damage, or for self-renewal. But once the proliferative deed is done the stem cell switches back into quiescent mode.
the transition and maintenance of quiescence. Knockdown-studies in mammalian cell systems appear as a rather complicated endeavor (Eisener-Dorman et al., 2009).
Nevertheless, the reversible withdrawal from cell growth into the G0 state seems to be an evolutionary ubiquitous mechanism of survival. Besides mammalian systems, fission yeast (Yanagida, 2009), bacteria (Roszak and Colwell, 1987) and parasites (Saldivia et al., 2016) rely on the ability to transit between vegetative and quiescent states. Due to its importance for survival, the regulatory mechanism of quiescence is likely to be conserved. Therefore, employing a simpler eukaryotic organism might serve as an ideal approach to study the basic regulatory machinery of the G0 switch and maintenance.
The unicellular eukaryote fission yeast Schizosaccharomyces pombe is a great model to study cell growth and intracellular pathways which are found in humans.
Adult stem cell Self-renewal
Tissue regenera5on
G0 phase Prolifera5ve
phase
M
G1
G2 S
In fact, S. pombe shares a number of processes found in human (Hoffman et al., 2016, Aravind et al., 2000). Besides a relatively high amount of conserved proteins, it was reported that around 65% of S. pombe protein interactions are conserved in human (Vo et al., 2016). Therefore, the current study relies on S. pombe as a model organism to uncover ancient G0 phase survival mechanisms.
1.2. Fission yeast - A crucial model organism for cell cycle studies and beyond Numerous S. pombe studies successfully identified and characterized genes contributing to regulatory mechanisms of the cell cycle (Hagan et al., 2016, Russell and Nurse, 1987), chromosome segregation (Yanagida, 2000), nutritional adaptations (Saitoh and Yanagida, 2014) and quiescence (Takeda and Yanagida, 2010, Sajiki et al., 2009, Su et al., 1996). By the year 2002 its genome had been sequenced (Wood et al., 2002) and 5,054 protein-encoding genes were recorded (Hoffman et al., 2016).
Following the completion of S. pombe genome sequencing, a PCR-based approach for
targeted deletion of non-essential genes was developed (Bahler et al., 1998,
Decottignies et al., 2003). This simple technique transformed S. pombe into a ‘box of
bricks’ for generating a model with desired genetic features. The general idea behind
mutant screenings is to determine gene function via the emerging phenotype differing
from the wild type strain. In this way insights into phenotypic changes, gained from
mutational experiments, can be used to characterize a specific gene product. A few
decades ago first phenotypic studies on gene mutants were successful in characterizing
essential players of the cell cycle control. The initial experimental design relied on mutagenesis treatment which generated strains displaying a temperature sensitive (ts) phenotype at restricted temperature (36°C). These isolated ts mutants strains showed unusual physiological features like aberrant cell size and cell cycle progression defects (Nurse et al., 1976). Besides genes behind the cell cycle checkpoint control (Fantes and Nurse, 1978) another deterministic factor influencing the passage through the cycle was reported to be nutrient availability in S. pombe. In fact, depletion of nitrogen from the culturing media caused radical cell size reduction coupled with a cell cycle arrest (Fantes and Nurse, 1977, Young and Fantes, 1987) predominantly in the G1 phase prior to the S phase (Costello, 1986, Su et al., 1996). These growth-arrested yeast cells were found to exist in a resting state, distinct from the proliferative mode (Iida and Yahara, 1984).
This contrasts with glucose-starved cells which arrested after DNA synthesis in G2 phase with a higher DNA content (Masuda et al., 2016). Notably, G2-arrested cells do not differ in cell size and shape from vegetative cells (Mochida and Yanagida, 2006). Other features of nitrogen-starved G0 phase active metabolism (Sajiki et al., 2013) and prolonged viability (Su et al., 1996). This is in contrast to glucose-restricted cells in stationary phase whose survival rate is rather reduced to a few days (Roux et al., 2006).
Nitrogen (N) depletion was reported to cause a rapid remodeling of gene
expression. Notably, after 20 minutes of N starvation expression of ribosome
biogenesis genes significantly decreased and an increase in nucleotide salvage gene
expressions was observed (Kristell et al., 2010). Twelve hours following nitrogen
starvation the cell volume had decreased by 50% (Marguerat et al., 2012) which is a
consequence of radical reductions in protein levels due to the large-scale protein degradation pathway known as autophagy (Nakashima et al., 2006, Kohda et al., 2007).
Besides radical re-adjustments of the proteome, bulk mRNA content decreased at the onset of quiescence by ~80% compared to vegetative state levels. The majority of mRNA transcripts decreased in number, whereas 1-2% of mRNA transcripts were more abundant at quiescence (Marguerat et al., 2012). In the next section past G0 studies in S. pombe, which successfully identified the genes behind crucial intracellular pathways such as the cell cycle and quiescence, will be described.
1.3. Past genetic screenings with S. pombe
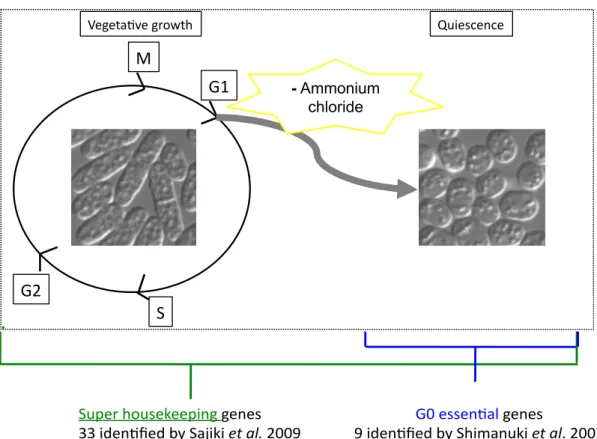
With the rise of the high-throughput analysis era, screening of mutant libraries, spanning thousands of genes, has been increasingly employed. It has proved as an efficient approach for identifying several genetic players of cellular pathways under defined experimental conditions. To answer the above-mentioned question about the regulatory machinery of N-starvation induced G0 survival, a collection of temperature- sensitive mutant strains was screened for growth arrest during G0 conditions. The common technique for G0 induction is nitrogen (N) source (0.5% NH
4Cl) depletion from the S. pombe culturing medium Edinburgh minimal medium EMM2 (Figure 1.2.).
G0 phase can be confirmed by light microscopic method since its shows an easily
discernible round morphology in contrast to rod-shaped proliferating cells (Su et al.,
1996). Further experimental confirmation involves DNA content measurements of G0
phase cells by fluorescence-activated cell sorting (FACS) since G0 cells are pre-
replicative and contain 1C DNA.
Figure 1.2. Methodology to induce G0 phase in S. pombe. The synthetic medium Edinburgh minimal medium 2 (EMM2) is preferentially employed it contains one well- defined N source which is ammonium chloride (red). Leaving out this particular compound is enough for G0 studies
.This contrasts with G2 arrested cells which went through S phase and contain 2C DNA.
Past experimental approaches by G0 unit in Okinawa involved screenings of two
different types of mutant strains (Figure 1.3.): 1) Temperature-sensitive (ts) S. pombe
mutant library, generated by mutagenesis treatment (Hayashi et al., 2004, Hayashi et
al., 2007) and 2) non-essential deletion mutant strains (Shimanuki et al., 2007). A
previous screening approach used a ts mutant library which identified 33 genes to be
required during N depleted incubation (Sajiki et al., 2009). Since mutations in these 33
genes caused both, restricted temperature and N starvation sensitivities, the affected
Figure 1.3. Summary of past studies on S. pombe quiescence (G0 phase) regulation. Quiescence in S. pombe is induced by depletion of ammonium chloride from the culture medium. Two types of mutant libraries were used for nitrogen starvation (–N) screening experiments. Temperature-sensitive mutant strains, affected in cellular house-keeping genes. These were termed ‘super housekeeping’ (SHK) genes. A different approach used Bioneer whole-gene deletion library. The pilot study identified genes which are specifically required for G0 only. They are therefore G0 essential.
genes are thought to promote survival during vegetative growth and quiescence. These genes are designated as ‘super housekeeping’ (SHK) genes.
Mutants with impaired stress response pathways, involving MAP kinase cascade proteins and transport were shown to be unable to enter G0 state. This finding
suggests that intracellular trafficking and stress response signaling is required for the initial transition period leading into G0. Other mutants are involved in diverse
G1#
G0#
Removal(of(
Nitrogen(
M#
S#
G2#
Vegeta-ve#growth#
24#h#
#–N#
Super#housekeeping#genes#
33#iden-fied#by#Sajiki#et#al.#2009#
Quiescence#
G0#essen-al#genes#
9#iden-fied#by#Shimanuki#et#al.#2007#
G1#
G0#
Removal(of(
Nitrogen(
M#
S#
G2#
Vegeta-ve#growth#
24#h#
#–N#
Super#housekeeping#genes#
33#iden-fied#by#Sajiki#et#al.#2009#
Quiescence#
G0#essen-al#genes#
9#iden-fied#by#Shimanuki#et#al.#2007#
G1#
G0#
Removal(of(
Nitrogen(
M#
S#
G2#
Vegeta-ve#growth#
24#h#
#–N#
Super#housekeeping#genes#
33#iden-fied#by#Sajiki#et#al.#2009#
Quiescence#
G0#essen-al#genes#
9#iden-fied#by#Shimanuki#et#al.#2007#
- Ammonium sulfate- Ammonium
chloride
intracellular processes such as RNA metabolism, protein trafficking, glycolysis ergosterol synthesis and cell wall organization.
Despite their dual importance of SHK genes for survival in both physiological phases, gene products truly essential for G0 survival still need to be characterized.
The next section will deal with past experimental approaches by the G0 unit to characterize this regulatory machinery.
1.4. Previous work on the identification of G0 regulatory players
A direct way to assess the requirement of a certain gene during -N starvation conditions is by depleting the cell out of it and watch the resulting effect. Therefore, viability assessments in N starved media with S. pombe mutant strains, lacking the target gene, will give a more precise statement whether the gene is indispensable. In an initial N starvation pilot study, Shimanuki et al. investigated genes exclusively essential for G0 survival and found nine genes through screening of 53 deletion mutant strains (Figure 1.4.).
These nine deletion strains can proliferate in regular culture medium, but lose
viability in G0 phase under N starvation (Shimanuki et al., 2007). From the results, we
understood that diverse functions comprising signaling, transcriptional regulation and
intracellular transport (Figure 1.4.: red boxes) are involved in quiescence. The
remaining three genes (sds23, rrd1 and cbs2) encode proteins involved in nutrient
sensing/signaling via phosphatase-kinase relay (Yanagida, 2009).
Figure 1.4. Overview of the identified SHK and G0 survival essential genes.
Sajiki et al., found gene products which are essential for growth and viability under vegetative state and N-starved G0 phase, termed ‘super housekeeping genes’ (SHK) (white boxes, black font). Some SHK gene mutants were unable to entry the G0 state upon N starvation (white box encircled). Shimanuki et al., tried to identify genes indispensable for G0 survival only. Nine gene products were reported so far to affect G0 viability when depleted (red boxes, black font).
The results of the pilot study gave an initial outlook about the possibilities of mutant library screenings for the identification of G0 essential genes. As a next step, screenings of a larger number of deletion mutants was performed which will be discussed in the next section.
Sup45 Protein synthesis
Protein trafficking Nat10
Rpc40
RNA processing
Clathrin RNA processing RNA degradation
Phosphatase
Rrd1 Sds23
AMPK CDK1
MAPK signaling PP2A
Signaling
Kinase Nuclear Function
Mis4 Mis16 Fcp1
Dhp1 Smd3
Polymerase Chromatin Remodeling
Ribosome biogenesis Cdc2
Hrf1
Protein degradation Ssp1
Translation release
CAMKK
Alp2 Autophagy
Transcription factor Klf1
Retromer Vps11 Gyp7 SNARE
Vam6 Rsv2
Actin Metabolism
Pyk1
Mitochondria Translation
Dmr1 Lipid synthetic
Atg1801 Cbs2
Hcs1 Prp4
Cts1 UTP synthesis
Glycolysis Ctk2
Fps1 Cdc13
Membrane & Cell wall
Mnn9 Pps1 Smi1
Synthase Transferase
Atg1802 Wis1 Sty1
Wsp1 End4 Ypt1
Sec17
Protein SHK protein, G0 entry defect (Sajiki et al.) Protein G0 essential (Shimanuki et al.) Protein Superhouse keeping (SHK) (Sajiki et al.)
Ypt5
1.5. G0 survival essential genes support viability during N starvation
G zero (G0) survival essential (GZE) genes were investigated by employing the Bioneer haploid deletion mutant library featuring more than 3, 500 strains. The current study will be based on the unpublished results obtained by members of the G0 unit. In contrast to the above-mentioned ts mutant libraries, the Bioneer haploid deletion mutant strains thrive under vegetative culture conditions even at restricted temperature. In this way, it was ensured that the screening focus lies truly on identifying GZE genes. The screening consisted of two procedures (Figure 1.5.): 1) Spot tests on EMM-N agar plates which found 154 gene deletion strains. These S. pombe mutants were unable to grow on the N deprived agar plates (Figure 1.5.A). 2) Subsequent long-term viability assessment in liquid EMM2-N media was conducted (Figure 1.5.B). In the end 89 GZE genes were found to have impaired viability when transferred from N-starved to N-replenished medium within a four-week-long -N incubation (Figure 1.6.).
Depending on the gene deletion, diminished viability was observed at varying time
points of -N incubation. This observed viability impairment is defined by a reduced
ability to regenerate upon N replenishment (Sajiki et al., publication in progress).
Figure 1.5. Experimental design for GZE gene identification. Sajiki et al., (publication in progress) performed two experimental set-ups: A) The first deals with screening of 3,500 gene deletion strains (Bioneer library) by spotting vegetative cells from liquid EMM2+N cultures, on agar plates depleted of the nitrogen source (EMM2- N). After max. 2 months the strains are transferred on N-replenished plates (EMM2+N) B) In the second experiment the selected strains are checked for viability after long- term incubation in -N conditions (four weeks). Each week a fixed number of 300 cells were plated on agar plates with rich medium yeast extract, polypeptone and D-glucose (YPD). In this way, the ability to regenerate from quiescence was assessed for each of the 154 selected deletion mutants. The results provide an idea about the time of viability loss during -N incubation.
Bioneer'library'
Liquid'EMM2'+N' EMM2'5N'
Agar'media'
Spo;ng'on' Select'growth'' impaired'strains'
Liquid'EMM2+'N'
Liquid'EMM2'+N' ShiA'to'5N'
Liquid'EMM2'5N' Incubate'for'4'weeks'
1st'week' 2nd'week' 3rd'week' 4th'week'
YPD' Agar'media' Spot'300'cells'
A
B
Bioneer'library'
Liquid'EMM2'+N' EMM2'5N'
Agar'media'
Spo;ng'on' Select'growth'' impaired'strains'
Liquid'EMM2+'N'
Liquid'EMM2'+N' ShiA'to'5N'
Liquid'EMM2'5N' Incubate'for'4'weeks'
1st'week' 2nd'week' 3rd'week' 4th'week'
YPD' Agar'media' Spot'300'cells'
A
B
Bioneer'library'
Liquid'EMM2'+N' EMM2'5N'
Agar'media'
Spo;ng'on' Select'growth'' impaired'strains'
Liquid'EMM2+'N'
Liquid'EMM2'+N' ShiA'to'5N'
Liquid'EMM2'5N' Incubate'for'4'weeks'
1st'week' 2nd'week' 3rd'week' 4th'week'
YPD' Agar'media' Spot'300'cells'
A
B
Bioneer library
Liquid EMM2+N cultures
EMM2-N
Agar media EMM2+N
Liquid media EMM2+N
Agar media Spot and
incubate for max. 2 months
Select for growth impaired strains Transfer on
N-replenished medium
Bioneer'library'
Liquid'EMM2'+N' EMM2'5N'
Agar'media'
Spo;ng'on' Select'growth'' impaired'strains'
Liquid'EMM2+'N'
Liquid'EMM2'+N' ShiA'to'5N'
Liquid'EMM2'5N' Incubate'for'4'weeks'
1st'week' 2nd'week' 3rd'week' 4th'week'
YPD' Agar'media' Spot'300'cells'
A
B
Bioneer'library'
Liquid'EMM2'+N' EMM2'5N'
Agar'media'
Spo;ng'on' Select'growth'' impaired'strains'
Liquid'EMM2+'N'
Liquid'EMM2'+N' ShiA'to'5N'
Liquid'EMM2'5N' Incubate'for'4'weeks'
1st'week' 2nd'week' 3rd'week' 4th'week'
YPD' Agar'media' Spot'300'cells'
A
B
Spot 300 cells
YPD Agar media Incubate for 4 weeks
EMM2-N Liquid medium EMM2+N
Liquid medium
Week 1 Week 2 Week 3 Week 4 Shift to
F igu re 1.6. O ve rvi ew of t he G 0 e ss ent ia l (G Z E ) ge ne produc ts ide nt ifi ed by ni troge n s ta rva tion s cre eni ng ( Sa jiki e t a l., unpubl is he d).
Rpl1001 Rpl2002
Rpl3201 Rpl3601 Rpp102
Atg6 Atg13 Aut12 Vac7Atg7
Protein synthesis 11 Protein trafficking 11 Shf1
Rik1
Hap2
SPAPJ691.02
Apq12 Sgf11
Mhf1RNA processing 6 Cwf16
Elp4Ker1 SPCC1393.08 Cti1 Exo2 SPBC577.04
Med20 Wbp4 Tho7
Transcription Transcription factor RNA processingRNA degradation Phosphatase 11 Ctf1 Ppn1
Ypa1
Par1 Zds1Sds23
Mug134Pmp1 SPBC902.03Nem1
Rnc1 PP1
Nem1-Spo7
MAPK phosphatasePP2A Kin1
Signaling 13 Kinase 2
Nuclear Function 20 Vht1
Iec1Arp42 Fft3 Tfg3 Dep1 Ash2
Nuclear Envelope Chromatin Remodeling Histone Modification
DNA Damage Response
Dph3
Ssz1 SPAC637.09
Sbh1
Protein degradation 11 Hcr1
Ribosomes Translation
Protein folding/targeting Pof15 SPAC694.04c
Autophagy Atg3Atg5 Atg14 Atg1801 Vacuole CORVET Vps3Retromer Vps26 Vps35 Gyp7 ESCRT Bro1 Sst6
Did2 Did4 Vps20
Trp663 Transporter Metabolism 6 (+4) Are2
Amino acid synthetic Met6 Coq5 Nde1 Antioxidant Sod2
Mitochondria 11 Electron transportLys12 Gdh1 Maa1
Ilv3
Unknown SPBC21C3.03 SPBC83.19c SPBC365.16
Lipid synthetic SPBC83.16c
Atg1802 Cbs2 Asp1
Mtd1 SPAC11D3.15
AntioxidantInositol
Polyamine synthetic
SPBC1347.08c
DNA replication Spe1
Ubiquitin ligase SPAC694.04c Klf1Rsv2
F
igure 1.6. Overview of the G0 essential (GZE) genes. Results from viability assessments after incubation in N starvation conditions performed by Sajikiet al., publication in progress. The nine GZE gene products identified by Shimanukiet al., 2007 are included.It is likely that -N survival involves different stages where protein functions contribute to pathways in a time-dependent mechanism. Sajiki et al., reported distinct metabolic responses for 75 metabolic compounds whose abundance changes upon initial N starvation. These included rapid decrease in free amino acids, and compounds of purine biosynthesis within one hour of N starvation. On the other hand, increase in the TCA cycle compounds 2-oxoglutarate (2-OG) and succinate indicate remodeling of carbon (C) metabolism (Sajiki et al., 2013). Especially, 2-OG is a well-known compound associated with both energy and nitrogen metabolic pathways. It was reported to be elevated in response to N starvation under plenty of glucose in many organisms like the bacteria (Shimizu, 2013, Bren et al., 2016) and in plants (Lancien et al., 2000). Since the changes in 2-OG seem to be a ubiquitous response to N level fluctuations, the pressing assumption about a common N starvation survival mechanism arises. It may be that quiescence induction and 2-OG rise upon N starvation likely originate from universal intracellular response mechanisms. We assume that the basic pathway had proven to be the most efficient way throughout evolutionary progress. There this study focuses on the identification of evolutionary conserved enzymes among the 89 GZE protein products which are involved in the ancient N starvation survival reactions and pathways. This kind of ‘phylogenetic profiling’ as described in (Sun et al., 2005) may provide a clue about function and possible interactions among other GZE proteins.
1.6. Search for common mechanisms shared among bacteria and S. pombe
The bacterial survival response to amino acid starvation is the entry into a
resting state which is similar to quiescence showing increased carbon storage,
decrease in protein biosynthesis, cell wall thickening and a general increase in resistance towards oxidative stress (Rittershaus et al., 2013). Therefore, the following question arises whether there are conserved proteins among the S. pombe (G zero essential) GZE proteins which might be involved in universal mechanisms essential for nitrogen starvation-induced quiescence survival.
The two widely characterized bacterial species Bacillus subtilis (strain168) and Escherichia coli (strain K12) are employed in the current homology search study. Since
their genomes had been completely sequenced by (Blattner et al., 1997) and (Kunst et
al., 1997) it is ensured that no homolog is overseen. The commensal E. coli, and the
non-pathogenic soil bacterium B. subtilis differ in their cell wall physiology, a trait
easily discernable by the gram stain. They both respond to starvation by protein
biosynthetic inhibition and growth halt, known as stringent response (Hauryliuk et al.,
2015). Therefore, they appear as ideal study objects for comparative analysis. To
support the assumption of a universal nitrogen starvation survival pathway the degree
of conservation of GZE proteins to prokaryotes needs to be assessed.
2. Materials and Methods
2.1. Study on mitochondria-localized G0 essential gene products 2.1.1. Protein homology search
The Basic Logic Alignment Search Tool (BLAST)-assisted homology search consisted of two steps: 1) Each GZE protein sequence was compared against E. coli K12 and B.
subtilis 168 protein databases separately. These databases consisted of non-redundant protein sequences (nr). BLOSUM62 was used as a scoring matrix with expect threshold of 10. The word-size for matches was 2 to increase sensitivity for distantly related proteins. The ‘best hit’ BLASTp approach, with following criteria sequence coverage rate of ≥ 50% (Moreno-Hagelsieb and Latimer, 2008) and E value ≤ 1.0E-04 (Sun et al., 2005), was performed. If the highest hit to prokaryotic protein sequences had identical functions, the corresponding GZE and its prokaryotic counterparts were selected for BLAST pairwise alignment against the corresponding query S. pombe sequence (Pearson, 2013). The initial criteria for the BLAST pairwise homology confirmation are an E-value cut-off rate ≤ 1.0E-05 and a sequence coverage ≥ 50%.
2.1.2. Multiple sequence alignments and search for conserved active sites
Multiple alignments against selected GZE S. pombe orthologs including human, E. coli, and B. subtilis sequences were constructed with the Chimera Viewer tool (Pettersen et al., 2004). Protein alignments are obtained by running ClustalW (Larkin et al., 2007) which are then loaded on the Chimera program for functional site identification. The functional sites are included into the sequence alignments by exporting the crystal structures directly from the RSCS (PDB) protein databank (Berman et al., 2000). S.
pombe protein sequences are obtained from pombase.org database (Wood et al., 2012),
whereas protein sequences for other organisms are obtained from uniprot.com database (The UniProt, 2017). Information on enzymatic functions and biosynthetic pathways are retrieved from the Kyoto Encyclopedia of Genes and Genomes (KEGG) pathway database (Kanehisa and Goto, 2000).
2.1.3. Generation of phylogenic trees for Maa1, Gdh1 and Coq5 orthologs
FASTA files are obtained from uniprot.org database (The UniProt, 2017). or GenBank® (Benson et al., 2004, Benson et al., 2005). Sequences are aligned using the ClustalW algorithm (Larkin et al., 2007). The resulting alignments are loaded in the Molecular Evolutionary Genetics Analysis (MEGA) version 6 (Tamura et al., 2013) to carry out Maximum likelihood phylogenetic analysis with 1,000 bootstrap replicates.
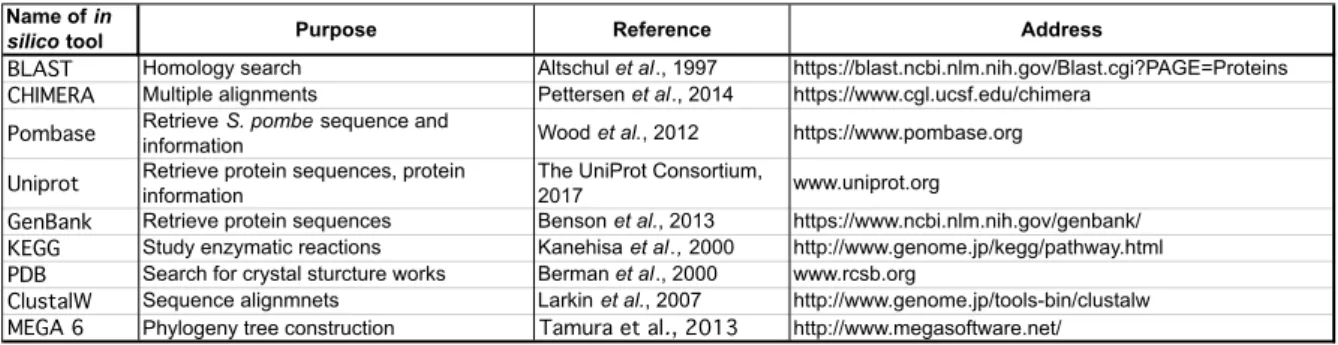
Detailed information on the in silico tools is shown in Table 2.1.
Table 2.1. Overview of the internet-accessible resources used for this study
2.1.4. Oxygen consumption measurements
Oxygen consumption rate (OCR) measurements are performed with the Seahorse XF- 96 flux analyzer (Bioscience, USA) at 26°C. Preparation and handling are performed according to the manufacturer’s protocol. For the OCR pilot study, different cell
Name of in
silico tool Purpose Reference Address
BLAST Homology search Altschul et al., 1997 https://blast.ncbi.nlm.nih.gov/Blast.cgi?PAGE=Proteins CHIMERA Multiple alignments Pettersen et al., 2014 https://www.cgl.ucsf.edu/chimera
Pombase Retrieve S. pombe sequence and
information Wood et al., 2012 https://www.pombase.org
Uniprot Retrieve protein sequences, protein information
The UniProt Consortium,
2017 www.uniprot.org
GenBank Retrieve protein sequences Benson et al., 2013 https://www.ncbi.nlm.nih.gov/genbank/
KEGG Study enzymatic reactions Kanehisa et al., 2000 http://www.genome.jp/kegg/pathway.html PDB Search for crystal sturcture works Berman et al., 2000 www.rcsb.org
ClustalW Sequence alignmnets Larkin et al., 2007 http://www.genome.jp/tools-bin/clustalw MEGA 6 Phylogeny tree construction Tamura et al., 2013 http://www.megasoftware.net/
concentrations of 972h- wild type at vegetative and G0-arrested state are assayed:
1x10
6, 2.5x10
6, 5x10
6and 7.5x10
6cells per mL. The ideal concentrations are used for the OCR study of deletion strains. Overnight cultures in the synthetic Edinburgh minimal medium with added ammonium chloride (EMM2+N) are set up separately containing deletion strains and 972 h- wild type control. Each strain is divided into VE and G0 samples. Culture shift from EMM2+N into ammonium depleted minimal medium (EMM2-N), by using nitrocellulose membrane filtration method (Shimanuki et al., 2007), was performed to induce G0 and sampled after 24h. The results for measurements of each individual strain type are shown as the mean ± STD. Graphs are plotted with Excel. At least three independent experiments for each deletion strain were performed.
2.1.5. Imaging of GZE deletion mutants
Before shifts from EMM2+N to EMM2-N, cells were incubated overnight at 26°C.
24 hours after transfer into EMM2-N medium and constant incubation at 26°C, G0 cells
were used for microscopy. Cells were fixated in glutaraldehyde and observed by Axio
Vision 2 (Zeiss) microscope. Cells in vegetative state were used as control.
2.2. Characterization of UbiB family protein SPBC21C3.03
2.2.1. Strains and cell culture conditions
For the sensitivity screening of S. pombe ABC1-like kinase family members, following strains were used in the study: Wild type S. pombe 972 h-, ∆SPBC21C3.03,
∆SPAC10F6.14c, ∆SPBC15C.04, ∆coq8 and as controls ∆sod2, ∆nde1, ∆rad3 (for UV
and hydroxyurea only). Before experimental procedures deletion of all four UbiB family members from Bioneer library was checked by confirmation PCR as described on the Bioneer homepage. For the drug screenings, wild type 972 h- cells and mutants were grown overnight at 26°C in liquid YE [0.5% yeast extract, 2% glucose] and cell number was adjusted prior to spotting on agar plates with added drugs and no drugs.
Plates containing drugs were made a few days before spotting.
2.2.2. UbiB protein family sequence alignments
Protein sequence in FASTA format for E. coli UbiB protein was obtained from uniprot.org. The S. pombe protein sequences for the three UbiB family members were retrieved from pombase.org. Alignments of the protein sequences were performed with the online tool found at Multalin.org.
2.2.3. Microscopy
Imaging by Axio Vision 2 microscope was performed as described in section 2.15.
Images of cells at vegetative and G0 states were taken. Wild type and S. pombe UbiB
family mutants ∆SPBC21C3.03, ∆coq8, ∆SPAC10F6.14c and ∆SPBC15C.04 were
used.
2.2.4. Drug screen by spot test during vegetative state
YE agar plates with and without drug were made usually 3-4 days prior to the spotting experiments. Stock solutions of the drugs were made using either Dimethylsulfoxide (DMSO), water or ethanol as solvent according to the manufacturer’s recommendation.
The cultured cells were serially diluted and spotted on the prepared agar plates. Then
the plates were incubated at 26°C and 36°C in parallel. After 5 days, pictures of the plates were taken. The following compounds, used for the sensitivity screenings, are shown in Table 2.2 . Spot tests were performed twice and yielded reproducible results.
Table 2.2. Chemical agents used for the spot test experiment. Overview of the drugs and compounds used for the growth sensitivity tests. Following makes were used Sigma Aldrich (USA) and Wako (Japan). As the solvent either Dimethyl sulfoxide (DMSO), H2O and ethanol (EtOH) were used. Stock solution concentrations for each drug are indicated.
Name Maker Solvent Stock conc.
Cerulenin SIGMA DMSO 1mg / ml
Thiabendazole Wako DMSO 100 mM
30% H2O2 Wako H2O 500 mM
Paraquat dichloride hydrate SIGMA H2O 100 mM
Methyl viologen dichloride hydrate SIGMA H2O 100 mM
Calcofluor SIGMA H2O 10 mg/ml
Amphotericin B from Streptomyces sp. SIGMA DMSO 10mg/ml
Tunicamycin from Streptomyces sp. SIGMA DMSO 1 mg/ml
Monensin sodium salt SIGMA EtOH 10 mg/ml
CuSO4 Wako H2O 100 mM
CdSO4 SIGMA H2O 40 mM
Antimycin A from Streptomyces sp. SIGMA DMSO 2 mM
tert-Butyl Hydroperoxide solution SIGMA H2O
Hydroxyurea Wako H2O 1M
(S)-(+)-Camptothecin SIGMA DMSO 10mM
Erythromycin SIGMA EtOH 50 mg/ml
Iron( ) Chloride Hexahydrate Wako H2O 500 mM