GIS‑BASED SIMULATION FOR EVACUATION PLANNING SUPPORT IN CASE OF EARTHQUAKE
著者 グェン ディン タン
著者別表示 Nguyen Dinh Thanh journal or
publication title
博士論文要旨Abstract 学位授与番号 13301甲第4607号
学位名 博士(学術)
学位授与年月日 2017‑09‑26
URL http://hdl.handle.net/2297/00049720
Creative Commons : 表示 ‑ 非営利 ‑ 改変禁止 http://creativecommons.org/licenses/by‑nc‑nd/3.0/deed.ja
i
Dissertation Abstract
GIS-BASED SIMULATION FOR EVACUATION PLANNING SUPPORT
IN CASE OF EARTHQUAKE
Kanazawa University
Graduated School of Natural Science and Technology Division of Environmental Design
Student ID No: 1424052006 Name: NGUYEN DINH THANH
Supervisor: Professor SHEN ZHENJIANG
ii
Abstract
This PhD research focused on conducting GIS-based simulations for evacuation planning which could support disaster managers for reviewing and improving current evacuation method, estimating sufficiency of shelters to all evacuees as well as developing evacuation routes planning when an earthquake occurs in urban area. First of all, by integrating risk estimation on building damage and shelter capacity by calculating number of evacuees from damaged buildings which is input data for shelter capacity estimation, a whole framework of earthquake evacuation will be represented which includes forecasting seismic intensity for upcoming earthquake, damaged building and evacuee prediction, evacuation simulation to shelters in school districts, and shelter capacity estimation. Moreover, this research estimates shelter capacity risk according to different scenarios of seismic intensities as well as accessibility from all residents’ houses to shelters based on a simulation in which residents will find the nearest shelters for evacuation by using network analysis. In addition, a comparison between above two scenarios of evacuation that are going to shelters in school district and going to the nearest shelter in the city is conducted for finding out which scenario is better and more convenient to evacuees. Finally, the research also contributes a new method for identifying road blockade caused by debris from damaged buildings in urban area by using near table function and buffer function in ArcGIS software. Locations of road blockade, then, are inputted in the developed evacuation simulation from residents’
houses to shelters which reflects difficulties that residents have to encounter under earthquake in real situation.
Keywords: Seismic intensity distribution, damaged building, evacuee, shelter capacity,
accessibility, school district, nearest shelter, road blockade, debris length, building height,
distance to road center, building location, evacuation route planning.
1
1. Introduction
“Large earthquakes can happen anywhere in Japan at any time” is a message from Kumamoto earthquake in Kumamoto, Kyushu, Japan which has typhoons and active volcanos (Nakanishi, 2016). Moreover, damages caused by earthquake in urban area were huge: uncountable buildings collapsed, many roads damaged and many people died and injured. In addition, buildings which are collapsed will result in residents’ evacuation at shelters as well as making roads blocked because of their debris. According to a report from Great East Japan Earthquake 2011, there were more than 470,000 people who evacuated at more than 2,400 shelters and a lack of sufficient supplies of food, water, electric power, etc. as well as difficulties on goods delivery to earthquake affected areas because of damaged roads (Ranghieri and Ishiwatari, 2011). Besides that, Goncalo et al.
(2012) also pointed out that debris from the damaged buildings are major inaccessibility sources in the urban areas and it took an account of 91% of road blockade in 1995 Kobe earthquake (Mizuta 2012). From above view point, estimating impact of potential future earthquake on human life and developing evacuation model for simulating how residents go to shelters as well as predicting which portion of the road has high potential to be blocked are extremely necessary and important for evacuation planning. Therefore, this PhD research aims at conducting GIS-based evacuation simulations from residents’
houses to main accommodation shelters (hereafter main shelter) which will support disaster managers for reviewing current evacuation strategies, estimating sufficiency of shelters to all evacuees as well as developing evacuation routes planning before an upcoming earthquake occurs. Though this aim, we also try to obtain flowing objectives:
1. Integrating risk estimation on residential building damage and shelter capacity in order to develop a whole framework of earthquake evacuation;
2. Examining shelter capacity at shelters with different scenarios of earthquake and accessibility to shelters;
3. Comparing two scenarios of evacuation: going to main accommodation shelters in primary school districts and going to the nearest main shelter in city.
4. Predicting locations of road blockade caused by debris from damaged buildings in urban area;
5. Improving evacuation model by considering locations of road blockade.
The remained part of this paper is organized as follows. In section 2, we introduce
methods for obtaining proposed aim and objectives. Section 3 presents a method for
integrating risk estimation on residential building damage and shelter capacity by
calculating number of evacuees from damaged buildings in order to develop a whole
framework of earthquake evacuation. Section 4 examines shelter capacity at shelters
2
according to two different scenarios of earthquake with intensities of 6.5 and 7.0 JMA as well as accessibility from all residents’ houses to their nearest shelters. In section 5, a comparison between two above scenarios of evacuation which are going to main shelters in school districts and going to the nearest main shelter in city is conducted for finding out which scenario is better and more convenient to evacuees. In section 6 and 7, a new method for identifying portions of the road network having high potential for loss connectivity caused by debris from damaged buildings is introduced and its application to above developed evacuation model is conducted which makes the evacuation model more realistic and reasonable as real situation respectively. Finally, I conclude this research and point out possible future research in section 8.
2. Methodology
This PhD research employed network analysis in ArcGIS software as a tool for conducting evacuation simulations from residents’ houses to main shelters. Moreover, necessary data which includes location of main shelters, buildings, population, road network, and school districts, etc. are considered as input for the simulation. Besides that, in order to obtain mentioned-above objectives, this research proposes some separate methods as following:
- Number of residents which is calculated from damaged buildings based on building’s floor area and population data is used for integrating risk estimations on building damage and shelter capacity. An output of damaged building estimation will be an input of evacuation simulation for estimating shelter capacity. This calculation method is considered as a new contribution in a paper namely “A GIS-based model for integrated risk estimation on residential building damage and shelter capacity in case of earthquake - A case study of Kanazawa City, Japan -” which is in under review process by international journal of disaster risk science;
- Network analysis in ArcGIS software is employed for conducting evacuation simulation in which residents based on road network to go to the nearest shelter according to different seismic intensities well as examining accessibility from residents’ houses to shelters. This method was presented in a paper published by a symposium on computer technology of information, system, and applications, architecture institute of japan (AIJISA);
- Three factors which include total evacuation distances from evacuees’ houses to
main shelters; four distance categories of 2km service areas: 0-500m, 500-1000m, 1000-
2000m, and over 2000m; and a supply-to-demand ratio (hereafter SDR ratio) of each main
shelter are considered for making a comparison between two scenarios of evacuation.
3
This method was presented in a paper published in AIJISA and a paper submitted to disaster advances;
- Near table function and buffer function in ArcGIS software are used for identifying road blockade based on relative locations of damaged buildings, their debris length, and a distance from these buildings to road’s center; This work has presented at a workshop on Spatial Planning for Disaster Prevention and Sustainable Development and will be submitted to Journal of Risk Science as a special issue reserved for above workshop;
- Data on locations of road blockade and network analysis are used for simulating residents’ evacuation to shelters. This work will be submitted to International Journal of Disaster Risk Reduction.
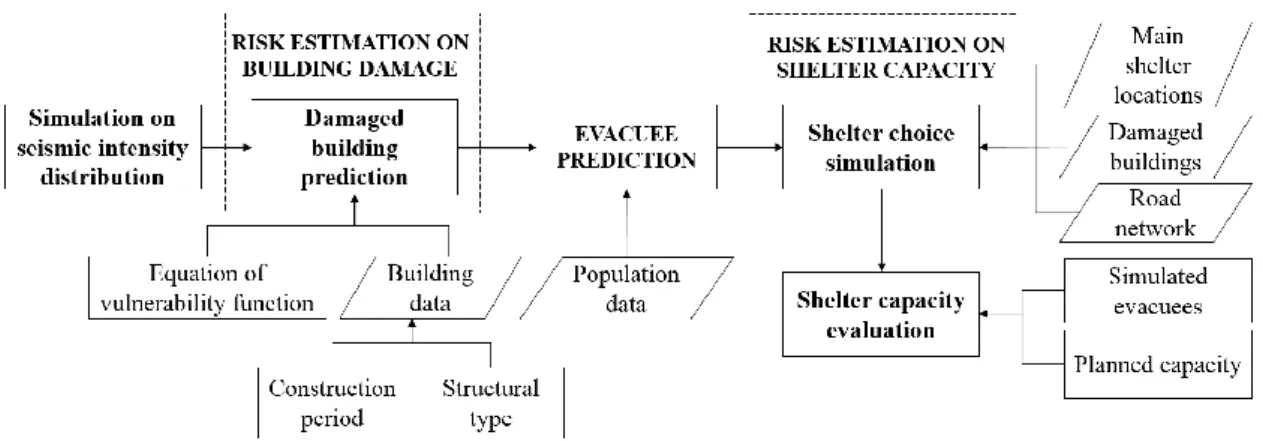
3. Integration of risk estimation on residential building damage and shelter capacity The aim of this section is to integrate risk estimation on residential building damage with that on shelter capacity which were investigated separately in previous works in literature (Hashemi and Alesheikh 2011; Ye et al. 2012) by calculating number of evacuees from damaged buildings which is considered as input data for shelter capacity estimation. By integrating these two risk estimation, a whole framework of evacuation planning is represented which includes a forecast of seismic intensity for an up-coming earthquake, a prediction of damaged buildings and evacuees as a sequence of the earthquake damage, an evacuation simulation from residents’ houses to main shelters in school districts, and an estimation on shelter capacity for examining whether capacity is sufficient to evacuees (Figure 1).
Figure 1– Flowchart representing integration between risk estimation on building damage and risk estimation on shelter capacity by evacuee prediction
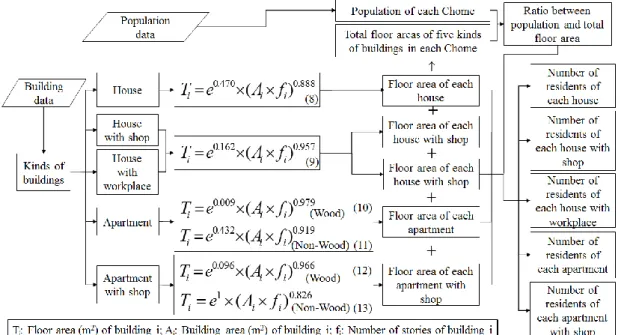
The number of damaged buildings was predicted by using vulnerability function
which indicates a relationship between ratio of damaged buildings according to different
structural types, construction periods and the JMA seismic intensity (Yamaguchi and
4
Yamazaki 2000. Moreover, this work also predicted evacuees based on two variables that were damaged buildings and residents of each damaged building. Different from previous researches (Kimura et al. 2004; Shao and Anaka 2012; Chou et al. 2013) that used average population of each building, we proposed a way to calculate residents of each building based on floor area of each building and population of each Chome where the buildings were located. Moreover, formulas suggested by Ohba (2000) were employed for calculating the floor area based on the building height and building area. Each kind of buildings was proposed a separated formula for the calculation (equation 1 to 6) as showed in figure 2.
Figure 2 - Flowchart representing a procedure for calculating number of residents of each building
Then, the equations for calculating number of residents of each building are represented as following:
j j
j
T
R P (7)
ij ij
ij
T R
Re (8)
R
j: Ratio between population of Chome j and total floor areas of all buildings located in Chome j; P
j: Population of Chome j; T
j: Total floor areas of all buildings located in Chome j; Re
ij: Number of residents of building i living in Chome j; T
ij: Floor area of building i located in Chome j;
The number of evacuees is a total residents of all damaged buildings and the number
5
of evacuees of each school district is calculated as a following equation:
ni
im im
SDm
B
E
1
Re (9)
E
SDm: Number of evacuees in school district m; B
im: Damage building i located in school district m; Re
im: Number of residents of building i living in school district m.
The number of evacuees at school districts, then, was used as an input data for an evacuation simulation to 66 main shelters in 62 school districts in Kanazawa city by using network analysis in ArcGIS software in order to find out how many evacuees at each main shelters in each school district. Moreover, the shelter capacity of each main shelter was estimated by comparing simulated evacuees at each shelter and its planned capacity.
The simulated results showed that number of damaged buildings and evacuees were 29687 and 79335 respectively while number of school districts which have main shelters with insufficient capacity was 14 and most of them were community centers and other centers with small capacity. The section also suggested solutions to deal with exceed evacuees at 14 school districts by asking them to go to other accommodation shelters in their neighboring school districts.
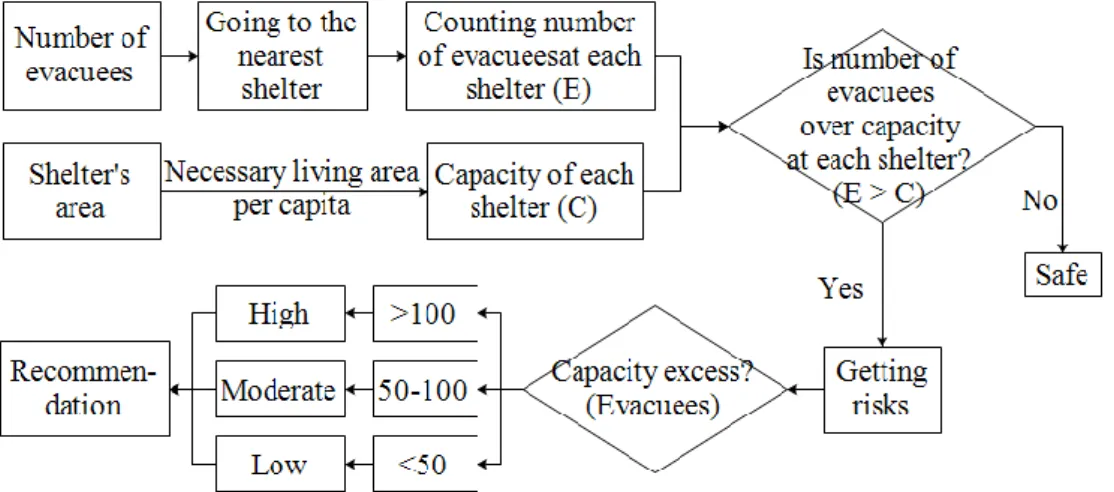
4. Estimating ability of accommodation shelters focusing on accessibility and capacity
Figure 3 - Flowchart representing a procedure for estimating capacity risk of accommodation shelters
Different from above section which developed an evacuation model for simulating
residents’ evacuation in school districts as same as current evacuation method in
Kanazawa city, in this section, an evacuation simulation in which residents will find the
nearest shelters for evacuation was conducted by using network analysis. The shelters
here included all elementary schools, secondary school and high school in the city which
were 112 shelters in total. Through the simulation, capacity risk of each shelter according
6
to two scenarios of earthquake with seismic intensities of 6.5 JMA and 7 JMA respectively as well as accessibility from all residents’ houses to their nearest shelters was estimated (figure 3) and examined. Moreover, by applying methods for predicting damaged buildings and evacuees mentioned in above section, number of damaged buildings and evacuees in each scenario of seismic intensity were calculated as presented in table 1. The calculated results showed that number of damaged buildings and evacuees in scenario of seismic intensity of 7 JMA was two times more than those in scenario of seismic intensity of 6.5 JMA.
For the capacity risk estimation, according to simulated results, there were 33 of 112 shelters getting risk in scenario with seismic intensity of 6.5 JMA while in scenario with seismic intensity of 7 JMA, number of shelters getting risk was 54. However, 32 of these shelters in two scenario had no information about their planned capacity, so the capacity is 0 and these shelter got risk. From the result, the higher the seismic intensity is the more the damaged building collapsed are and the more the shelters getting risk are.
Table – 2 Number of buildings and people according to different categories of evacuation distances of 112 accommodation shelters
For accessibility estimation, four distance categories of 2km service area of each shelter were created in order to calculate ratio of damaged buildings and evacuees at each distance category (table 2). From above result, there were a lot of buildings (20% of all
Table 1 – Number of damaged buildings and evacuees according to different seismic intensities
7
buildings) and people (18% of population) who need to take more than 1000m to go to the shelters. Therefore, it is necessary to designate more shelters in order to decrease residents’ evacuation distance.
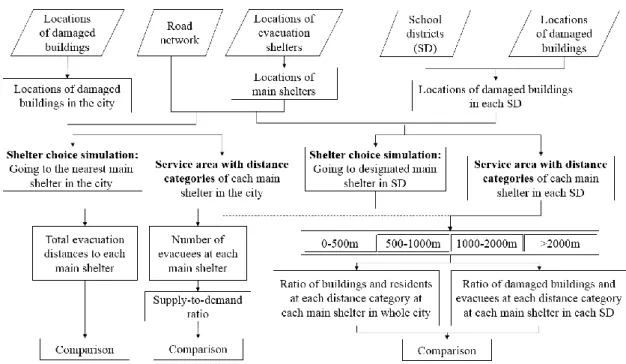
5. Comparing two evacuation scenarios: going to designated main accommodation shelter in school district and the nearest shelter in the city
Figure 4- Flowchart representing a procedure for comparing two scenarios of evacuation strategy
According to the current policy on earthquake evacuation in Kanazawa City, Japan,
residents are required to go to main shelters in their school district for evacuation. In the
case if the main shelters cannot meet number of all evacuees, other accommodation
shelters in the same school district will be used to serve the evacuees (scenario 1). In the
other hand, in other countries, such Taiwan, etc. residents are also required to evacuate at
the nearest shelters from their houses in their districts or cities (scenario 2). This matches
one of principles of planning earthquake evacuation shelters which is nearest evacuation
principle (Liu et al., 2011; Wei et al., 2012; Chu and Su, 2012; Kilci et al, 2015, Xu et al.,
2016). From above explanation, it seems that there is a conflict between principles of
evacuation shelter planning which prefer going to nearest shelters and the current method
for evacuation which asks residents to go to shelters in school district in Kanazawa city,
Japan. From this respect, this research proposed a method for making a comparison
between two scenarios of evacuation based on the total evacuation distances that evacuees
have travel to main shelters, three distance categories of service areas which are 0-500m
500-1000m, 1000-2000m, and over 2000m, and a supply-to-demand ratio of each main
8
shelter (figure 4). The research may provide a useful reference to disaster managers for reviewing the current evacuation method in practice as well as show advantages from going to the nearest shelter in order to support them to rethink a plan for improving current evacuation method.
According to the results, scenario 2 is more effective to evacuees than scenario 1 for some reasons. Firstly, the total evacuation distance from damaged buildings to main shelters in scenario 2 was less than that in scenario 1 which were 22733 km and 25117 km respectively. Secondly, the service areas of shelters showed that nearly 99.62% of total evacuees were served by main shelters in scenario 2 while it was 98.01% in the scenario 1. Moreover, according to ratios of damaged buildings and evacuees at each category of service area, there were more damaged buildings and evacuees located in short distance categories, such as 0-500m, 500-1000m and less damaged buildings and evacuees located in long distance categories, such as 1000-2000m, over 2000m in scenario 2 comparing with those in scenario 1. Finally, the result on supply-to-demand ratio at each main shelters according to two scenarios pointed out that allocating evacuees to main shelters in scenario 2 is more reasonable and suitable than scenario 1 because it could serve more evacuees.
6. Estimating road blockade caused by debris from damaged buildings
This section introduces a method for identifying portions of the road network having high potential for loss connectivity caused by debris from damaged buildings based on relative locations of damaged buildings, their debris length, and a distance from these buildings to road’s center. Two typical relative locations of damaged buildings that have high potential for making the road blocked include a single damaged building along a road (figure 5) and opposite or nearly opposite damaged buildings along a road (figure 6).
The distance between roadside building wall and road’s center indicates the nearest
distance from a damaged building to road’s center in front of it which was calculated by
using near table function in ArcGIS software. Besides that, the debris length is assumed
as a dependent value of building’s height and it equals a half, one-fourth, and one-eighth
of building’s height corresponding to three cases of different debris lengths (Nishino et
al., 2012). These three cases will show impact of debris length to road blockade. Road
blockade, then, is identified by comparing debris length of a damaged building with a
distance from roadside building wall to road’s center. For a single damaged building along
a road, the locations of road blockade can be detected based on the calculation results on
length of debris and the distance between roadside building wall and road’s center. For
opposite or nearly opposite damaged buildings along a road, locations of road blockade
9
will be identified by using buffer function (figure 7). The results showed that there was an increase of locations of road blockade which are 18, 47, 166 locations when the debris length of damaged buildings got longer as H/8, H/4, H/2 respectively. Furthermore, as corresponding the increase of locations of road blockade, number of damaged buildings without access to main shelters also increased as 9, 20, 81 buildings respectively.
Figure 5 Road blockade caused by debris from a damaged building along a road
a) b)
Figure 6. Road blockade caused by debris from opposite (a) or nearly opposite (b) damaged buildings along a road
Figure 7. An example of road blockade detection by using the buffer function. The buffer zone was created based on debris length of damaged buildings.
7. Improving evacuation modelling by considering road blockade
In this section, the proposed method for identifying road blockade in above section
10