5
DOI: http://dx.doi.org/10.14246/irspsd.3.4_5
Copyright@SPSD Press from 2010, SPSD Press, Kanazawa
Urbanization Patterns of China’s Cities in 1990-2010
He Li
1*, Shichen Zhao
1and Daqiang Wang
11 Graduate School of Human-Environment Studies, Kyushu University
* Corresponding Author, Email: [email protected] Received 20 July, 2014; Accepted 17 January, 2015
Key words: Urbanization pattern, Comprehensive Indicator, PCA, Cluster Analysis,
Discriminant Analysis
Abstract:
This study attempts to describe the urbanization patterns of China’s cities during the period 1990–2010. Firstly, we selected eight most telling indicators of urbanization for 218 cities from the China City Statistic Yearbook 1991, 1996, 2001, 2006 and 2011; secondly, we adopted Principal Component Analysis (PCA) to extract three comprehensive indicators from the sample database. They are: Potential Capacity for Expansion of Tertiary Industry (PCETI), the Degree of Urban Commercialization (DUC) and the Potential Capacity for Population Growth (PCPG); thirdly, these three comprehensive indicators were used to classify the 218 cities in 2010 into four groups by Cluster Analysis; fourthly, the same 218 cities in 1990 were classified into those four groups by Discriminant Analysis—Group 1: medium PCETI, remarkable DUC and limited PCPG. Group 2: medium PCETI, limited DUC and limited PCPG. Group 3: limited PCETI, medium DUC and medium PCPG. Group 4: remarkable PCETI, limited DUC and remarkable PCPG. On the basis of the cities’ transition over 20 years and changes of three comprehensive indicators’ levels, we determine ten urbanization patterns. The research could be useful and constructive for rethinking China’s urbanization and new stages of development.
1. INTRODUCTION
Over the past several decades, continued urbanization has resulted in nearly half of the world’s population living in urban areas. As the world’s urban growth is expected to be concentrated in the developing countries in the next 30 years (Cohen, 2006), economic reforms have sped up urbanization in China since the early 1980s. Starting from 1990, when a frenzy of development zones and real estate construction swept across China, many cities have experienced dramatic growth of the urban area.
Increased urban population, human activities and migration from rural areas are the main reasons for this growth. According to the general rule of global urbanization, urbanization levels between 30% and 70% are considered to indicate accelerated development (Northam, 1975). Now that the sixth census shows that the urbanization level in China is about 50% (Population Census Office under the State Council, Department of Population and Employment Statistics National Bureau of Statistics, 2010), China could be considered as being in a stage of accelerated development (Li et al., 2012).
Because of the transformation from the planned economy to market
economy, despite what is happening in China being superficially similar
with what has already occurred in other countries, the process of
urbanization in China is quite unique in terms of the scale and speed as well as the increasing number and size of cities (Chan and Yao, 1999). Evaluation on China’s urbanization has aroused interest among scholars.
Many scholars have focused their attentions on the whole country’s urbanization pattern. They usually consider the ratio of the urban population to total population as the proxy of urbanization and define its urbanization pattern based on the relationship between the level of urbanization and the economic development. Compared to other countries, the growth rate of the level of urbanization in China is much faster than that of economic development; economic reform since the early 1980s has revitalized the Chinese economy while accelerating the pace of resource consumption and environmental degradation. China’s further plan should target on the quality of urbanization. (Chan and Yao, 1999; Chang and Brada, 2006; Chen et al., 2010; Chen et al., 2013; Li et al., 2012). The core of that - the development of urban areas - is the focus of this study, whose aim is to illustrate the picture of China’s urbanization pattern on the city scale in a new way.
Previous studies concern the urbanization patterns of the region including a large area of suburbs. In this paper, we narrow down the objects to their urban area. We determine urbanization patterns of China’s cities based on the degree of several comprehensive indicators of urbanization. Significant efforts about the comprehensive indicators of urbanization have been made toward: comprehensive analysis on the evolution of cities (Duo et al., 2000;
Yang and Chen, 2010; Yuan and James, 2002); the sustainability of cities (Fang and Qi, 2010; Shen et al., 2012); the relationship between resource and environment with urbanization (Chen et al., 2010; Wang et al., 2011).
Urbanization patterns proposed in this study are expected to be useful and constructive for rethinking China’s urbanization.
2. STUDY AREAS AND INDICATORS
Urbanization is a dynamic socio-spatial process of several different and overlapping dimensions, each of which has its own vocabulary and traditions of scholarship. For this reason it has not been possible to identify a commonly agreed series of indicators. In this study, we focus on the dimensions of urbanization on population, space, and economy. To investigate on the transition of urbanization overtime, this study makes use of data from the China City Statistical Yearbook 1991, 1996, 2001, 2006 and 2011 to establish an indicator system.
Primarily, 43 same or similar indicators and 243 cities covered by the database of all five China City Statistical Yearbooks are picked out. Some of these 43 indicators’ data have to be obtained by secondary calculation.
During the period covered by this study, some cities have changed their names. While the initial information of these 243 cities is clear, these indicators are further selected according to the frequency of utilization in previous research (Chang and Brada, 2006; Chen et al., 2010; Chen et al., 2013; Duo et al., 2000; Fang and Qi, 2010; Henderson, 2000; Shen et al., 2012; Wang et al., 2011; Yang et al., 2012; Yang and Chen, 2010; Yuan and James, 2002). In this way, 17 of the 43 candidate indicators are selected.
Then we exclude six indicators which do not characterize the dimensions of
population, space, and economy: Public Transportation Vehicles per 10,000
Population and those to reduce the effect of information overlap (eg.,
Average Wage and Per Capita GDP; Percentage of Employment by
secondary industry and The Contribution of Secondary Industry to GDP)
from which we cut four indicators. Because of the close relationship between housing development and urbanization (Chen et al., 2011), we add one indicator—Per Capita Investment in Real Estate Development. The eventual system includes eight indicators, as shown in Table 1.
We sort out 218 cities with complete data of the eventual eight indicators in China City Statistical Yearbook 1991, 1996, 2001, 2006 and 2011 from the 243 cities. The 218 cities cover 25 provincial capitals in mainland China, except Tibet Autonomous Regions and Hainan Province; four municipalities directly under the Central Government (Beijing, Tianjin, Shanghai, Chongqing) and 189 prefecture-level cities.
Table 1. Raw indicator selected from China City Statistical Yearbooks
(Source: China City Statistical Yearbook (1991, 1996, 2001, 2006, 2011). Department of
Urban Socio-economic Investigation, National Bureau of Statistics)
2.1 Study Areas
There are two kinds of city data in the China City Statistical Yearbooks.
One is data of all Divisions of Administrative Areas, including city urban areas, suburbs and counties or county-level cities under its jurisdiction.
There is a considerable large area of suburb in counties or county-level cities. The other is data of city urban areas and suburbs. In this study, we use the latter as it more closely represents the data of the real urban area.
2.2 Indicators
Three of eight eventual indicators are calculated with the existing data.
Firstly, Per Capita Gross Domestic Product (GDP) is divided by the registered population at the Year-end. It is calculated without adjustments for inflation because a Z-score normalization was applied to the panel data in this study. Using this method Per capita GDP data can be compared in ways that reduce the influence of dimension and magnitude on research results.
Per Capita GDP is calculated with the registered population only at the Year- end for a set of reliable and continuous data of Per Capita GDP that is not already available. Because China begin to calculate Per Capita GDP with Usual Resident Population since 2004 (Xu, 2006), only current data of Per capita GDP and Usual Resident Population exists for the areas under study in the China City Statistical Yearbooks, the earlier data is not available.
Secondly, Per Capita Investment in Real Estate Development is Investment in Real Estate Development divided by the registered population at the Year-end.
Thirdly, The Contribution of Built-up Area to Administrative Division Area is the area of built-up zone divided by the area of administrative divisions.
Indicator Unit
Population Density people/sq. km
The Percentage of Employment in The Primary Industry % The Percentage of Employment in The Secondary Industry % The Percentage of Employment in The Tertiary Industry %
Per Capita GDP Yuan
Per Capita Investment in Real Estate Development Yuan The Contribution of Built-up Area to Divisions of Administrative Areas %
Per Capita Road Area sq. m
3. METHODS
3.1 Data Pre-processing
Eight raw indicators were standardized to eight new variables by using Z- score normalization to eliminate the influence of dimension and magnitude (Hardle and Simar, 2007; Wang, 2004).
3.2 Principal Component Analysis
Comprehensive indicators were generated with Principal Component Analysis (PCA).
Firstly, raw data were standardized by Z-score normalization.
Standardized data is presented by , 1,2 … (p is the number of variables); 1,2, . . (q is the number of cities). Secondly, the correlation matrix R of standardized data were calculated; thirdly, eigenvalue of R were figured out; then, eigenvector of were calculated, 1,2, … , is the amount of extracted components, is the ith vector components of .
The loading of component on i variable:
= 1 The score of the component of j city:
2
The value of eigenvalue λ reflects the influence degree of a component on original random variables, meaning how much the components can explain the original random variables. There are two criteria for extracting principal components: Firstly, the value of eigenvalues λ must be greater than 1; secondly, the greater the value of cumulative percentage, the more information of original data is included in the extracted components; the extracted principal components are considered as comprehensive indictors.
The value of l is the basis for explaining the meaning of comprehensive indictors. The greater the value, the more information of i indicator on the i comprehensive indictors (Hardle and Simar, 2007; Wang, 2004; Zhang, 2006).
3.3 Cluster Analysis
We input the standardized data of 2010 into formula (2) to get the scores of comprehensive indictors for each city. The scores were viewed as variables of cities when we employed a Hierarchical Cluster Analysis to classify them. The influence of dimension and magnitude was small enough so that it could be safely omitted. It was not necessary to normalize the score of comprehensive indictors for the cluster analysis.
Each city started in its own cluster. Firstly, sums of squared deviations of each cluster were calculated; secondly, the Squared Euclidean Distance between a sum of squared deviations of any two clusters were measured;
thirdly, pairs of clusters with the closest distance were merged as one moves
up the hierarchy; we repeated this computing process until getting four
groups (Hardle and Simar, 2007; Wang, 2004).
3.4 Discriminant Analysis
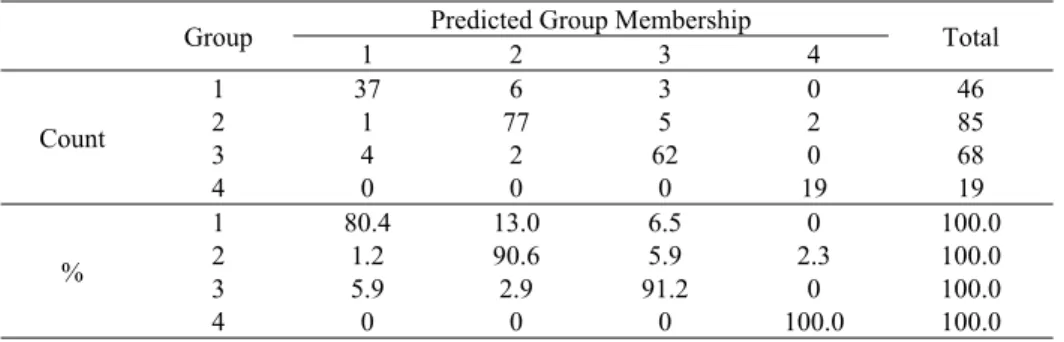
First we employ Misclassification Probabilities on the data of classification from 2010 using a re-substitution method (Hardle and Simar, 2007; Wang, 2004) to predict the precision of dividing cities in 1990 into four groups. As shown in Table 2, the precision respectively was 80.4% for group 1, 90.6% for group 2, 91.2% for group 3 and 100.0% for group four. The errors were acceptable.
Table 2. The Misclassification Probabilities
Then we input the standardized data of 1990 into formula (2) to get the scores of comprehensive indicators of cities. These scores were viewed as variables’ cities when we employed Bayes Discriminant Analysis to allocate new observations, i.e., cities in 1990 into four groups which were generated by applying Cluster Analysis to data of 2010, the result is shown in Table 5.
The whole computational process was accomplished using the software Statistic Package for Social Science.
Table 3. Extraction Sums of Squared Loadings
4. RESULTS AND DISCUSSIONS 4.1 Comprehensive Indicators
As shown in Table 3, according to Eigenvalues and values of Cumulative Percentage, the first three components are extracted as principal components.
The value of Cumulative Percentage is nearly 80%. That means the three principal components explain the original random variables well.
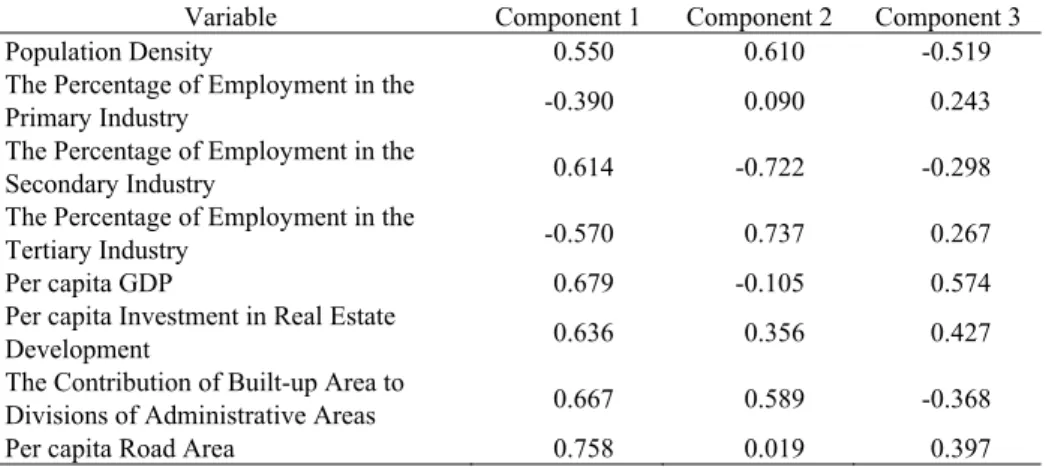
As shown in Table 4 , the loadings of the first principal component on the urban infrastructure variables (Per capita Road Area, The Contribution of Built-up Area to Divisions of Administrative Areas) and economy variables (Per capita GDP, Per capita Investment in Real Estate Development, and The Percentage of Employment in the Secondary Industry) are positive and relatively significant; the loading on The Percentage of Employment in the Tertiary Industry is negative, and the absolute value is significant. Therefore, the first principal component is best described by urban infrastructure and economy variables (Hardle and Simar, 2007; Zhang, 2006). The higher the score of the first principal component is, the more developed urban infrastructure and economic development are, and the more the support for
Group Predicted Group Membership Total
1 2 3 4
Count
1 37 6 3 0 46
2 1 77 5 2 85
3 4 2 62 0 68
4 0 0 0 19 19
%
1 80.4 13.0 6.5 0 100.0
2 1.2 90.6 5.9 2.3 100.0
3 5.9 2.9 91.2 0 100.0
4 0 0 0 100.0 100.0
Component Eigenvalues Percentage of Variance Cumulative Percentage
1 3.042 38.025 38.025
2 1.929 24.112 62.137
3 1.294 16.179 78.316
the development of Tertiary Industry, which means the more the potential capacity for the expansion of Tertiary Industry. Consequently, the first comprehensive indicator is Potential Capacity for the Expansion of Tertiary Industry (PCETI).
Table 4. The Loadings of Components on Variables
The loading of the second principal component on The Percentage of Employment in the Tertiary Industry is positive and relatively significant;
the loading of The Percentage of Employment in the Secondary Industry is negative and the absolute value is significant. Hence, the second principal component is essentially the difference between the Tertiary Industry and Secondary Industry (Hardle and Simar, 2007; Zhang, 2006). The higher the score of the second principal component, the more developed the Tertiary Industry is; the lower the score, the more developed the Secondary Industry is. So, the second principal component reflects the economic structure. We have the second comprehensive indicator named as Degree of Urban Commercialization (DUC).
The loadings of the third principal component on economy variables (Per capita GDP and Per capita Investment in Real Estate Development) are positive and relatively significant; the loading on Population Density is negative and the absolute value is significant. For this reason, the third principal component is best described by economic variables and the Population Density variable (Hardle and Simar, 2007; Zhang, 2006). The higher the score of the third principal component, the more the support for Population Growth; the lower the score, the heavier the burden of population. Therefore, the third comprehensive indicator is Potential Capacity for Population Growth (PCPG).
4.2 Characteristics of Each Group
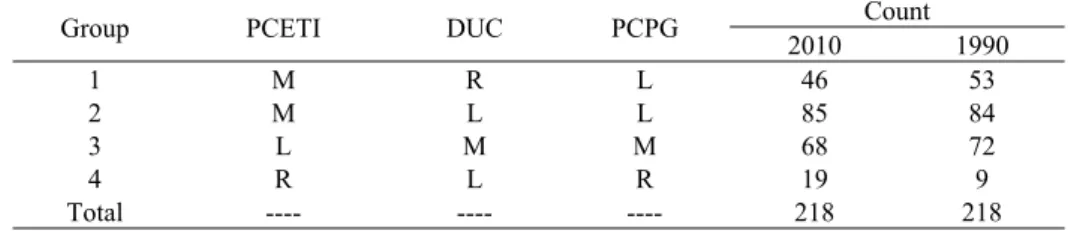
Group 1: As shown in Table 5, in 1990, there were 53 cities in Group 1;
in 2010, there were 46 cities. The level of Potential Capacity for Expansion of Tertiary Industry is medium; the level of Degree of Urban Commercialization is remarkable; the level of Potential Capacity for Population Growth is low. Some developed cities are in Group 1 because of their developed urban infrastructure, tertiary industry and high population density. Coming to other cities, the urban fundamental infrastructure and economy are under-developed, while their tertiary industry is more developed than their secondary industry.
Group 2: As shown in Table 5, in 1990, there were 84 cities in Group 2;
in 2010, there were 85 cities. The level of Potential Capacity for the Expansion of Tertiary Industry is medium; the level of Degree of Urban
Variable Component 1 Component 2 Component 3
Population Density 0.550 0.610 -0.519
The Percentage of Employment in the
Primary Industry -0.390 0.090 0.243
The Percentage of Employment in the
Secondary Industry 0.614 -0.722 -0.298
The Percentage of Employment in the
Tertiary Industry -0.570 0.737 0.267
Per capita GDP 0.679 -0.105 0.574
Per capita Investment in Real Estate
Development 0.636 0.356 0.427
The Contribution of Built-up Area to
Divisions of Administrative Areas 0.667 0.589 -0.368
Per capita Road Area 0.758 0.019 0.397
Commercialization is low; the level of Potential Capacity for Population Growth is low. Some developed cities are in Group 2 because of their developed urban infrastructure, secondary industry and high population density. Coming to other cities, overall, their urban fundamental infrastructure and economy are under-developed, while their secondary industry is more developed.
Group 3: As shown in Table 5, in 1990, there were 72 cities in Group 3;
in 2010, there were 68 cities. The level of Potential Capacity for the Expansion of Tertiary Industry is low; the level of Degree of Urban Commercialization is medium; the level of Potential Capacity for Population Growth is medium. There is no very developed city in Group 3. The urban infrastructure and economic development of cities in Group 3 are fair. The development of tertiary industry and secondary industry are balanced.
Table 5. The Classification and Character of Cities in 2010 and 1990
Group 4: As shown in Table 5, in 1990, there were nine cities in Group 4; in 2010, there were 19 cities. The level of Potential Capacity for the Expansion of Tertiary Industry is remarkable; the level of Degree of Urban Commercialization is limited; the level of Potential Capacity for Population Growth is remarkable. Overall, their urban fundamental infrastructure and economy are relatively developed, and the development of tertiary industry and secondary industry is balanced.
The number of cities in Groups 2 and 3 is steady; the number in Group 1 reduced from 53 in 1990 to 46 in 2010; the number in Group 4 doubled from nine in 1990 to 19 in 2010.
4.3 Urbanization Pattern of China’s Cities 1990-2010 and their Distribution
As shown in Table 7, based on the transition of cities among groups and the change of three comprehensive indicators’ levels, we determine ten urbanization patterns of China’s cities during 1990-2010.
Pattern 1: As shown in Table 7, there are 125 cities—57.34% among all of the tested cities. These cities stay in the group with the same characteristics after 20 years of rapid development. There is no significant reform of cities’ development model in this pattern.
Specifically, as shown in Table 6, 26 cities of Group 1 in 2010 came from Group 1in 1990. Combined with Table 5 and Table 7, these 26 cities retained the same characteristics during the 20 year period: medium potential capacity for expansion of tertiary industry, remarkable degree of urban commercialization and limited potential capacity for population growth. This group includes cities such as Beijing, Shanghai, and Guangzhou.
As shown in Table 6, 49 cities of Group 2 in 2010 came from Group 2 in 1990. Combined with Table 5 and Table 7, these 49 cities with medium potential capacity for expansion of tertiary industry, limited degree of urban commercialization and limited potential capacity for population growth retained the same characteristics during the 20 year period. This group
Group PCETI DUC PCPG Count
2010 1990
1 M R L 46 53
2 M L L 85 84
3 L M M 68 72
4 R L R 19 9
Total ---- ---- ---- 218 218
Note : R----Remarkable M----Medium L----Limited
includes cities such as Tianjin, Datong, and Jilin, cities with rich mineral resources or developed secondary industry.
As shown in Table 6, 44 cities of Group 3 in 2010 came from Group 3 in 1990. Combined with Table 5 and Table 7, these 44 cities with limited potential capacity for expansion of tertiary industry, medium degree of urban commercialization and medium potential capacity for population growth retained the same characteristics during the 20 year period. This group includes cities such as Hengshui, Shuozhou and Yuncheng.
As shown in Table 6, six cities of Group 4 in 2010 came from Group 4 in 1990. Combined with Table 5 and Table 7, these six cities with remarkable potential capacity for expansion of tertiary industry, limited degree of urban commercialization and remarkable potential capacity for population growth retained the same characteristics during the 20 year period. This group includes cities such as Daqing, Xiamen and Dongying.
China can be divided into three main economic areas: The Eastern Area, The Middle Area and The Western Area (Zhang, 2002). Cities in Pattern 1 are mainly located in the eastern and middle areas. A smaller number of cities are distributed in the western area. Specifically, there are 45 cities in the eastern area, 52 cities in the middle area and 28 cities in the western area, as shown in Figure 1 and Table 8.
Pattern 2: As shown in Table 7, there are 23 cities, 10.55%, in Pattern 2, including one transition that was from Group 3 in 1990 to Group 2 in 2010.
From Table 5 and Table 7, the potential capacity for expansion of tertiary industry for these cities increased from low to medium; the degree of urban commercialization and the capacity for population growth downgraded from medium to limited. Overall, over the 20 year period for this pattern, cities’
economic growth and development of urban infrastructure was dramatic, and the emphasis of economic development was secondary industry. Urban population also grew dramatically. In this pattern, there are cities such as Putian, Quanzhou and Longyan. Six of the cities in Pattern 2 are distributed in the eastern area, ten are distributed in the middle area and seven cities are distributed in the western area, as shown in Figure 1and Table 8.
Pattern 3: As shown in Table 7, there are 16 cities, 7.34%, in Pattern 3, including one transition that was from Group 2 in 1990 to Group 1 in 2010.
From Table 5 and Table 7, the potential capacity for the expansion of tertiary industry and capacity for population growth of these 16 cities remained the same level. The emphasis of economic development transferred from secondary to tertiary industry during the 20 year period, so the degree of urban commercialization upgraded from low to remarkable. In this pattern, there are cities such as Shenyang, Anshan, Fushun and Fuxin. All of them were typical industrial cities. While their urban commercial development was dramatic during the 20 year period, they transitioned from Group 2 to Group 1. Ten of the cities in Pattern 3 are distributed in the eastern area; five are distributed in the middle area; and one city is distributed in the western area, as shown in Figure 1 and Table 8.
Pattern 4: As shown in Table 7, there are 13 cities, 5.96%, in Pattern 4, including one transition that was from Group 2 in 1990 to Group 3 in 2010.
From Table 5 and Table 7, the potential capacity for the expansion of tertiary
industry downgraded from medium to limited; both the degree of urban
commercialization and the capacity for population growth upgraded from
limited to medium. Overall, in the 20 year period, the economic growth was
dramatic. Especially, tertiary industry advanced more than secondary
industry. In this pattern there are cities such as Chengde, Changzhi and
Chifeng. Three of the cities in Pattern 4 are distributed in the eastern area,
five cities are distributed in the middle area and five cities are distributed in the western area, as shown in Figure 1 and Table 8.
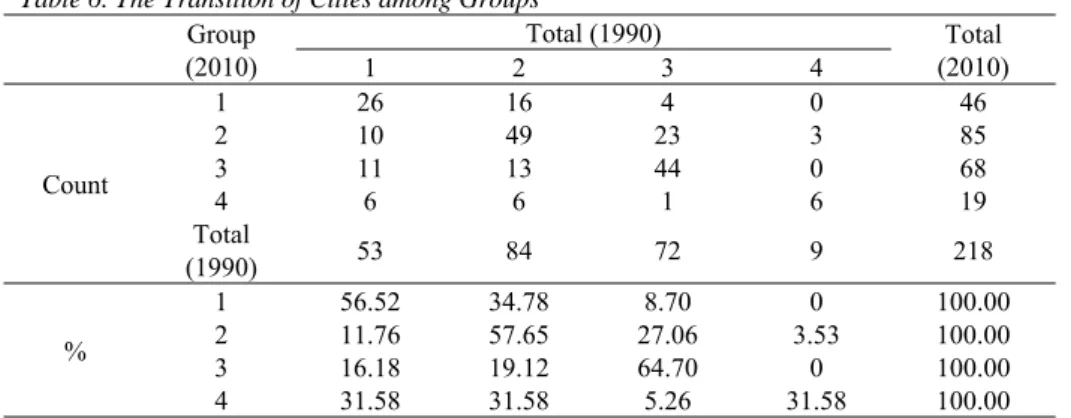
Table 6. The Transition of Cities among Groups
Pattern 5: As shown in Table 7, there are 11 cities, 5.05%, in Pattern 5 including one transition that was from Group 1 in 1990 to Group 3 in 2010.
From Table 5 and Table 7, the potential capacity for the expansion of tertiary industry downgraded from medium to limited; the degree of urban commercialization downgraded from remarkable to medium and the capacity for population growth upgraded from limited to medium. In the 20 year period, the development of tertiary industry was dramatic while the secondary industry advanced more than tertiary industry. Overall, the economic growth was dramatic. In this pattern, there are cities such as Harbin, Kaifeng and Shangqiu. One of the cities in Pattern 5 is distributed in the eastern area, five cities are distributed in the middle area and five cities are distributed in the western area, as shown in Figure 1 and Table 8.
Pattern 6: As shown in Table 7, there are ten cities, 4.59%, in Pattern 6 including one transition that was from Group 1 in 1990 to Group 2 in 2010.
From Table 5 and Table 7, the potential capacity for the expansion of tertiary industry and capacity for population growth of these ten cities remained the same level. The secondary industry advanced more than the tertiary industry during the 20 year period, so the degree of urban commercialization downgraded from remarkable to limited. In this pattern, there are cities such as Taiyuan, Wenzhou and Nantong. Eight of the cities in Pattern 6 are distributed in the eastern area, two cities are distributed in the middle area and none are in the western area, as shown in Figure 1 and Table 8.
Pattern 7: As shown in Table 7, there are seven cities, 3.21%, in Pattern 7, including two transitions of cities among groups. For this pattern, in the 20 year period, cities’ economic growth and the development of urban infrastructure were dramatic; especially the development of tertiary industry, which advanced more than the Secondary Industry.
Specifically, as shown in Table 6, six cities, 31.58%, of Group 4 in 2010 came from Group 1 in 1990. From Table 5 and Table 7, the potential capacity for the expansion of tertiary industry upgraded from medium to remarkable, the degree of urban commercialization downgraded from remarkable to limited and the capacity for population growth upgraded from limited to remarkable. This pattern included cities such as Qingdao and Wuxi.
As shown in Table 6, one city, 5.26%, of Group 4 in 2010 came from Group 3 in 1990. From Table 5 and Table 7, the potential capacity for the expansion of tertiary industry upgraded from limited to remarkable, the degree of urban commercialization downgraded from medium to limited and the capacity for population growth upgraded from medium to remarkable.
This city is Zhongshan.
Group (2010)
Total (1990) Total
(2010)
1 2 3 4
Count
1 26 16 4 0 46
2 10 49 23 3 85
3 11 13 44 0 68
4 6 6 1 6 19
Total
(1990) 53 84 72 9 218
%
1 56.52 34.78 8.70 0 100.00
2 11.76 57.65 27.06 3.53 100.00
3 16.18 19.12 64.70 0 100.00
4 31.58 31.58 5.26 31.58 100.00
Six of the cities in Pattern 7 distributed in the eastern area, one distributed in the middle area and none are in the western area, as shown in Figure 1 and Table 8.
Table 7. Urbanization Pattern of Cities in China 1990-2010
Pattern 8: As shown in Table 7, there are six cities, 2.75%, in Pattern 8 including one transition that was from Group 2 in 1990 to Group 4 in 2010.
From Table 5 and Table 7, the potential capacity for the expansion of tertiary industry upgraded from medium to remarkable, the degree of urban commercialization remained the same level on limited and the capacity for population growth upgraded from limited to remarkable. In the 20 year period, the economic growth and the development of urban infrastructure were dramatic and the development of tertiary industry and secondary industry were balanced. In this pattern, there are cities such as Baotou and Ningbo. Three of the cities in Pattern 8 are distributed in the eastern area, two are distributed in the middle area and one city is distributed in the western area, as shown in Figure 1 and Table 8.
Pattern 9: As shown in Table 7, there are four cities, 1.83%, in Pattern 9, including one transition that was from Group 3 in 1990 to Group 1 in 2010.
From Table 5 and Table 7, the potential capacity for the expansion of tertiary industry upgraded from limited to medium, the degree of urban commercialization upgraded from medium to remarkable and the capacity for population growth downgraded from medium to limited. Overall, in the 20 year period, these four cities’ economic growth and development of urban infrastructure was dramatic and the tertiary industry advanced more than the secondary industry. Urban population also grew dramatically. The four cities of this pattern are Langfang, Jincheng, Tieling and Sanya. Three of the cities in Pattern 9 are distributed in the eastern area, one city is distributed in the middle area and none are in the western area, as shown in Figure 1 and Table 8.
Pattern 10: As shown in Table 7, there are three cities, 1. 38%, in Pattern 10, including one transition that is from Group 4 in 1990 to Group 2 in 2010.
From Table 5 and Table 7, the degree of urban commercialization remained on the level of limited, the remarkable potential capacity for the expansion of tertiary industry and the capacity for population growth respectively downgraded to medium and limited. Overall, in the 20 year period, the development of tertiary industry and secondary industry were dramatic and balanced and urban population grew dramatically. The three cities of this pattern are Shiyan, Jiayuguan and Jinchang. No city of Pattern 10 is in the
Pattern PCETI DUC PCPG Transition Count %
1 R R R
1→1 26
125 57.34
2→2 49
3→3 44
4→4 6
2 U D D 3→2 23 10.55
3 R U R 2→1 16 7.34
4 D U U 2→3 13 5.96
5 D D U 1→3 11 5.05
6 R D R 1→2 10 4.59
7 U D U 1→4 6 7 3.21
3→4 1
8 U R U 2→4 6 2.75
9 U U D 3→1 4 1.83
10 D R D 4→2 3 1.38
Total ---- ---- ---- ---- 218 100
Note: R---- Remain U---- Upgrade D---- Downgrade
eastern area, one city is distributed in the middle area and two cities are in the western area, as shown in Figure 1 and Table 8.
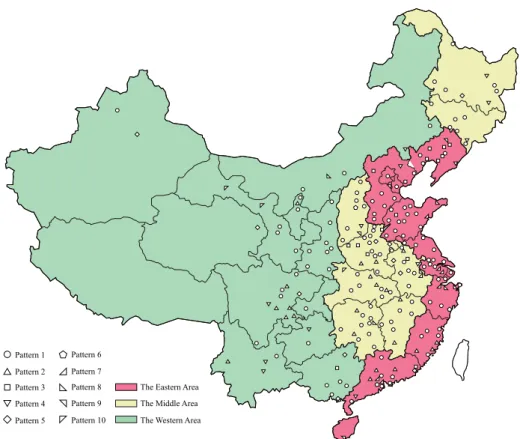
Figure 1. The Distribution of Cities in Three Main Economic Areas Table 8. The Distribution of Urbanization Patterns in Three Main Economic Areas
The distribution of urbanization patterns in three main economic areas reveals the development feature of each economic area. Firstly, cities in Pattern 1 make a great percentage of the totality of the three economic areas.
That means most cities in these three main economic areas have followed the same development mode during the 20 year period. Secondly, cities in Pattern 3 and Pattern 6 respectively are the second-most and the third-most in the eastern area, and the amounts are similar. That means development transformation has happened over time in the eastern area. Some cities explored new ways to develop the tertiary industry and some industrial cities improved their initial industrial development mode. Thirdly, cities in Pattern 2 are the second-most in the middle and western areas. That means there are some cities that have experienced primary urbanization over the 20 years period in these two areas where urban construction has been promoted, secondary industry has developed and the urban population has increased.
Pattern 1 Pattern 2 Pattern 3 Pattern 4 Pattern 5
Pattern 6 Pattern 7 Pattern 8 Pattern 9 Pattern 10
The Eastern Area The Middle Area The Western Area