断熱材の熱特性
断熱材の熱特性
~熱伝導率および比熱測定~
~熱伝導率および比熱測定~
ニチアス㈱ 浜松研究所
大村 高弘
講演内容
講演内容
l
熱伝導率測定における問題点とそれに対す
る取り組み
l
各種熱伝導率測定方法と測定結果の比較
l
熱伝導率の推定式
l
断熱材の比熱測定
断熱材の熱伝導率測定に関する問題点
断熱材の熱伝導率測定に関する問題点
l
標準物質がない→装置間の誤差
精度確認ができない。
l
広い温度領域における断熱材の熱伝導率や
比熱が正確に示されていない。
特に
800℃以上の高温や真空下のデータ。
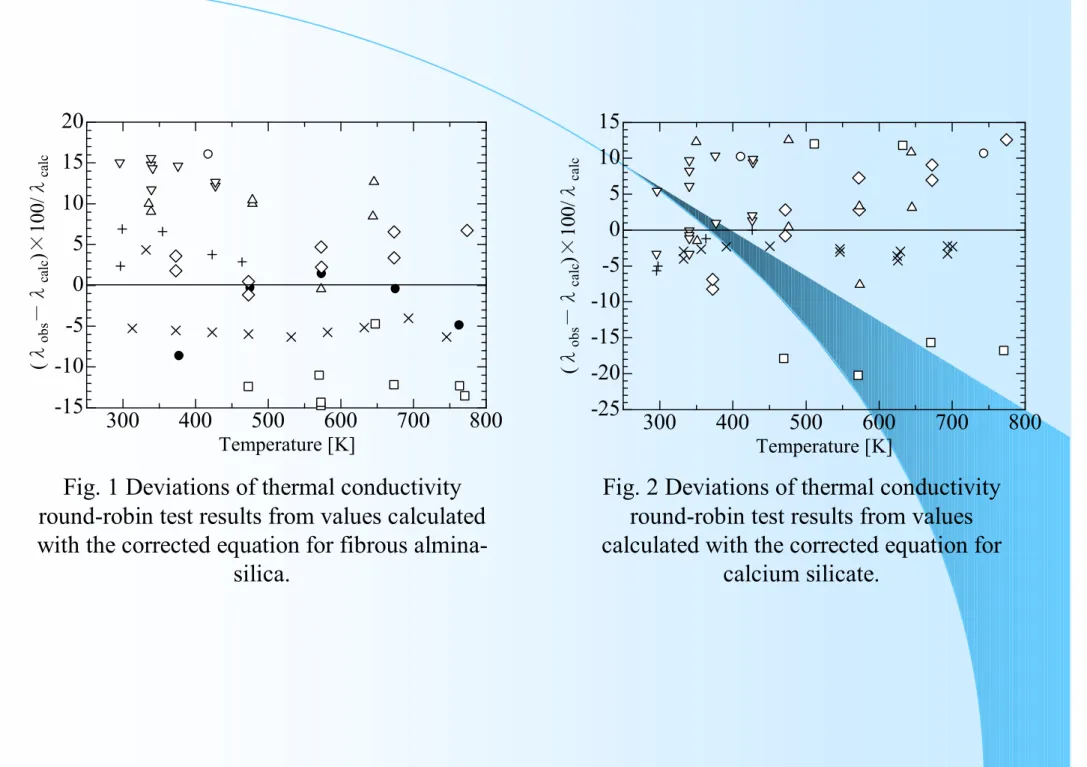
300 400 500 600 700 800 -15 -10 -5 0 5 10 15 20 Temperature [K] (λ ob s - λca lc )× 10 0/ λca lc
Fig. 1 Deviations of thermal conductivity round-robin test results from values calculated with the corrected equation for fibrous
almina-silica. 300 400 500 600 700 800 -25 -20 -15 -10 -5 0 5 10 15 Temperature [K] (λ ob s - λca lc )× 10 0/ λca lc
Fig. 2 Deviations of thermal conductivity round-robin test results from values calculated with the corrected equation for
熱伝導率の測定精度向上にた取り組み
熱伝導率の測定精度向上にた取り組み
1. 各種測定法が可能な装置の開発:定常法と非定常法の比較
定 常 法:
保護熱板法
保護熱板法
非定常法:
非定常熱線法、周期加熱法、ホットディスク法
非定常熱線法、周期加熱法、ホットディスク法
2.
2.
精度の高い推定式の提案
精度の高い推定式の提案
:
:
温度と嵩密度の関数
温度と嵩密度の関数
1. 異種測定法による結果を比較
2. 測定結果と推定式による結果との比較
間 接 加 熱 法 直 接 加 熱 法 定 常 法 軸 方 向 定 常 熱 流 絶 対 法 比 較 法 経 方 向 定 常 熱 流 縦 型 絶 対 法 平 板 絶 対 法 可 動 間 隙 法 絶 対 法 同 心 円 筒 法 縦 型 比 較 法 平 板 比 較 法 同 心 球 法 比 較 法 同 心 円 筒 法 軸 方 向 非 定 常 熱 流 非 定 常 法 経 方 向 非 定 常 熱 流 パ ル ス 状 加 熱 法 ス テ ッ プ 状 加 熱 法 波 面 分 割 干 渉 法 周 期 加 熱 法 光 音 響 法 強 制 レ ー リ ー 散 乱 法 ( パ ル ス 状 加 熱 ) ラ プ ラ ス 変 換 法 ( 平 板 ) ( 任 意 加 熱 ) 定 速 昇 温 法 熱 線 法 ( ス テ ッ プ 状 加 熱 ) ラ プ ラ ス 変 換 法 ( 円 筒 ) 定 常 法 非 定 常 法 軸 方 向 熱 流 軸 方 向 熱 流 径 方 向 熱 流 (Kohlrausch法, 積 分 法 ) (Angell法 ) ( 物 性 値 同 時 測 定 法 )
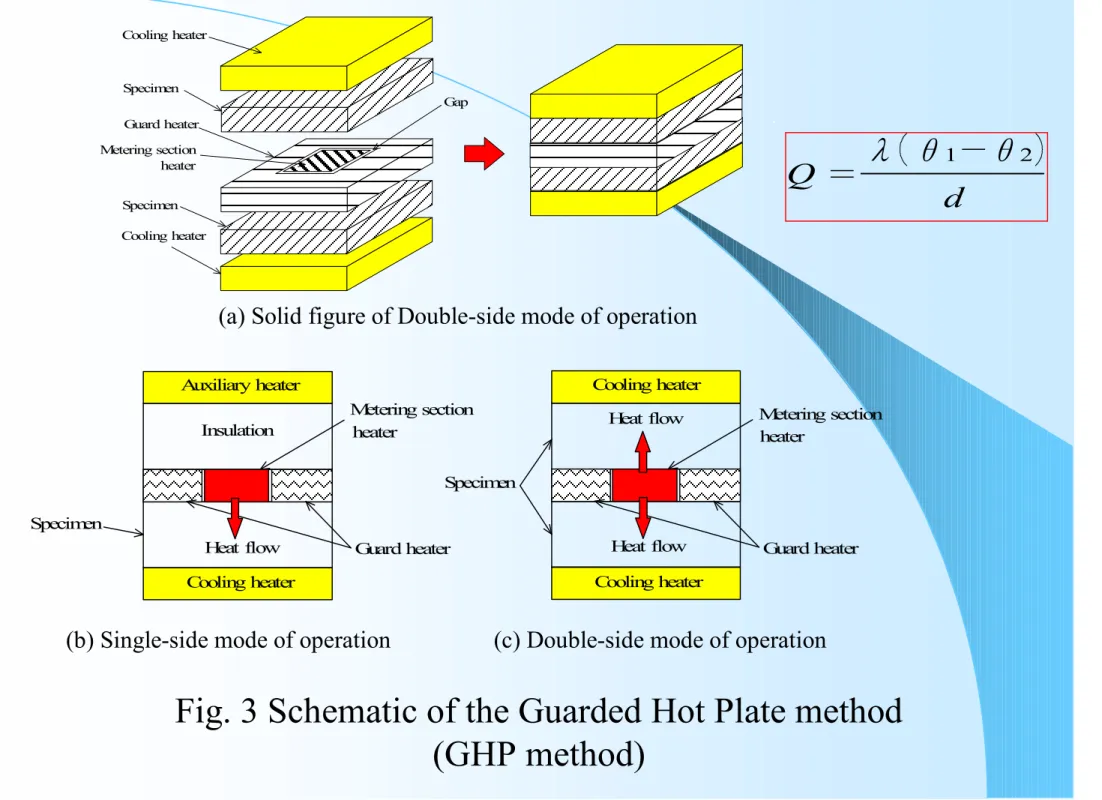
Fig. 3 Schematic of the Guarded Hot Plate method
(GHP method)
(a) Solid figure of Double-side mode of operation Guard heater Specimen Specimen Cooling heater Cooling heater Gap Metering section heater Specimen Guard heater Cooling heater Cooling heater Heat flow Metering section Specimen Guard heater Auxiliary heater Cooling heater Heat flow
Insulation heater Heat flow Metering sectionheater
(b) Single-side mode of operation (c) Double-side mode of operation
Q
=
λ θ
1-θ
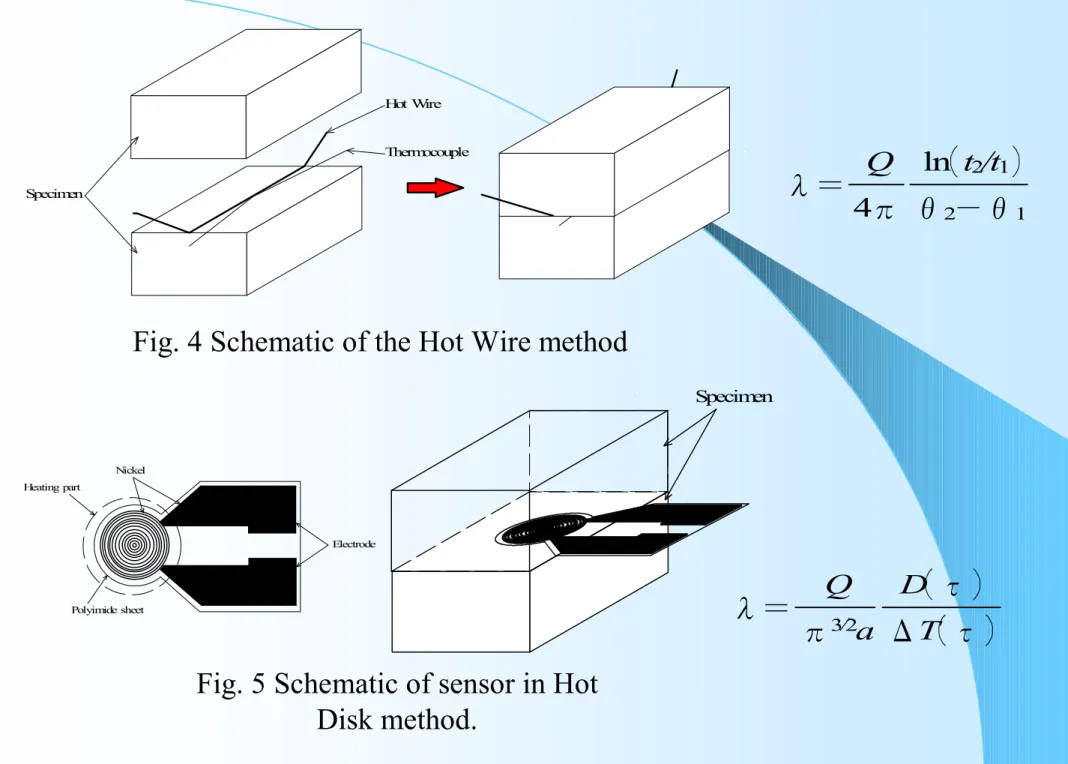
2Hot Wire Thermocouple Specimen
Fig. 4 Schematic of the Hot Wire method
Polyimide sheet Nickel Heating part
Electrode
Fig. 5 Schematic of sensor in Hot
Disk method.
Specimenλ=
4
π
Q
θ
2-θ
1ln t
2/t
1λ=
π
3/2a
Q
Δ
T
τ
D
τ
Specimen cross section T em pe ra tu re ( ℃) 1010 1000 990 Time (hour) 5~10℃ 3~6℃ Thermal sensor1 Thermal sensor2 Thermal sensor3 Heat waves
Top half of specimen Bottom half of specimen
Thermal sensor2 Thermal sensor1 Thermal sensor3 2 0 2 0
φ:
time lag,
T:period,
κ:
thermal diffusivity,
ρ:
density
λ:
thermal conductivity.
φ=
arg
sinhkL 1+i
sinhkx 1+i
A=
As Aj=
cosh2kL-
cos2kL cosh2kx-
cos2kxκ=
2k2ω
ω=
2π
Tλ=ρ
c
κ
測定装置(
測定装置(
GHP
GHP
法)
法)
Water tank Thermal insulation Specimen Auxiliary heater 円 筒 ヒ - タ Metering Guard heater Cylindricalheater Cooling unit Bell glass Vacuum pump Temperature controller Scanner Digital multimeter Computer heatersection Thermal insulation Thermal insulation 120 200 2 50 Water tank
測定装置(周期加熱法、非定常熱線法)
Water tank Insulation Specimen Insulation Auxiliary heater 円 筒 ヒ - タ Cylindricalheater Cooling unit
Insulation Bell
Glass
Vacuum pump Scanner
Digital Multimeter Computer
Temperature Controller Function Generator
Cyclic heaterSpecimen
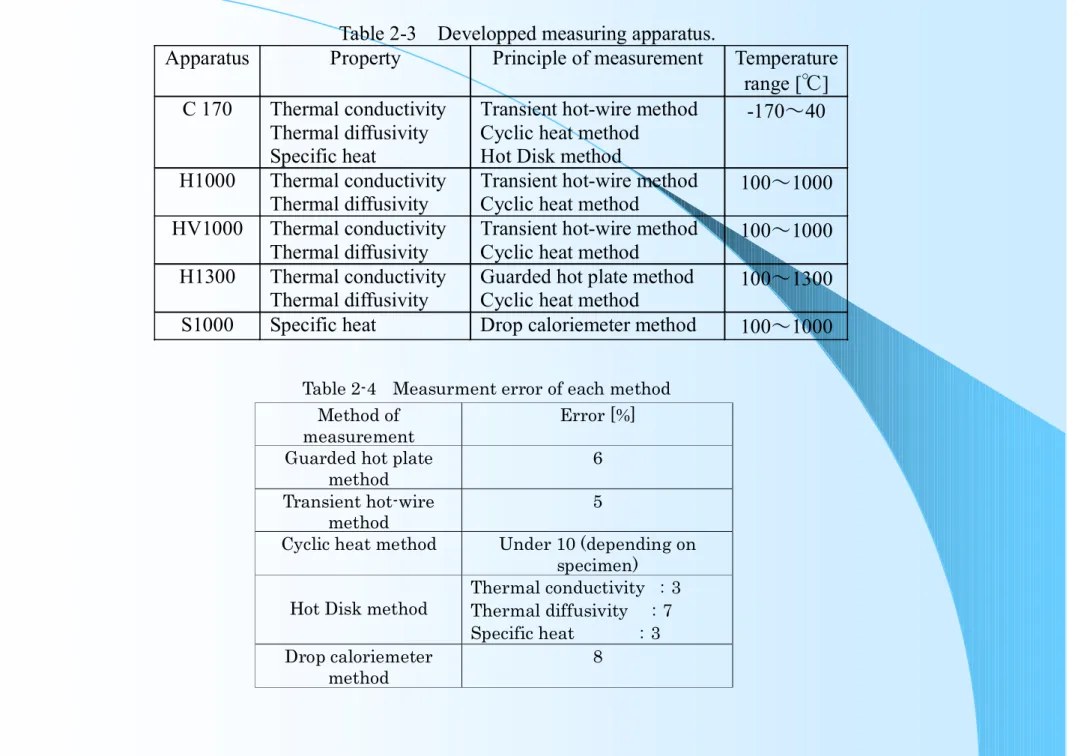
Table 2-3 Developped measuring apparatus.
Apparatus Property Principle of measurement Temperature range [℃] C 170 Thermal conductivity
Thermal diffusivity Specific heat
Transient hot-wire method Cyclic heat method
Hot Disk method
-170~40 H1000 Thermal conductivity
Thermal diffusivity
Transient hot-wire method
Cyclic heat method 100~1000 HV1000 Thermal conductivity
Thermal diffusivity
Transient hot-wire method
Cyclic heat method 100~1000 H1300 Thermal conductivity
Thermal diffusivity Guarded hot plate method Cyclic heat method 100~1300 S1000 Specific heat Drop caloriemeter method 100~1000
Table 2-4 Measurment error of each method Method of
measurement Error [%] Guarded hot plate
method 6 Transient hot-wire
method 5
Cyclic heat method Under 10 (depending on specimen)
Hot Disk method Thermal conductivity :3 Thermal diffusivity :7 Specific heat :3 Drop caloriemeter
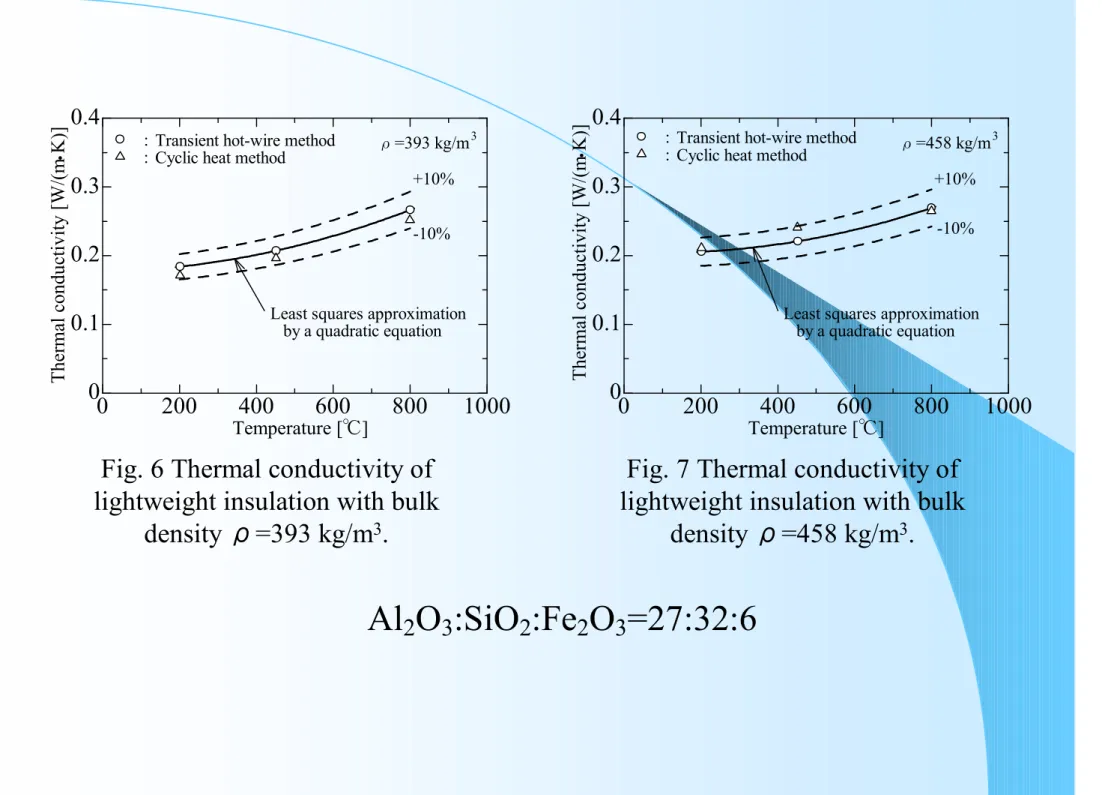
0 200 400 600 800 1000 0 0.1 0.2 0.3 0.4 Temperature [℃] T he rm al c on du ct iv it y [W /( m K )]
・ :Transient hot-wire method:Cyclic heat method
+10% -10%
Least squares approximation by a quadratic equation
ρ=393 kg/m3
Fig. 6 Thermal conductivity of
lightweight insulation with bulk
density ρ=393 kg/m
3.
Al
2O
3:SiO
2:Fe
2O
3=27:32:6
0 200 400 600 800 1000 0 0.1 0.2 0.3 0.4 Temperature [℃] T he rm al c on du ct iv it y [W /( m K )]・ :Transient hot-wire method:Cyclic heat method
+10% -10%
Least squares approximation by a quadratic equation
ρ=458 kg/m3
Fig. 7 Thermal conductivity of
lightweight insulation with bulk
0 500 1000 0 0.1 0.2 0.3 0.4
Least squares approximation by a quadratic equation Temperature [℃] T he rm al c on du ct iv it y [W /( m K )] ・ +10% +10% -10% -10% Atmospheric pressure 1.3 Pa
:GHP method under atmosferic pressure :Cyclic heat method under
atmosferic pressure :GHP method under 1.3 Pa :Cyclic heat method under 1.3 Pa
Fig. 8 Thermal conductivity of alumina fiber insulation with bulk density ρ= 205
kg/m3.
H1300を使った測定比較
0 500 1000 0 0.1 0.2 0.3 0.4 Temperature [℃] T he rm al c on du ct iv it y [W /( m K )] Atmospheric pressure 1.3 Pa +10% +10% -10% -10% :H1000(Atmospheric pressure) :H1300(Atmospheric pressure) :H1000(1.3Pa) :H1300(1.3Pa) ・Fig. 9 Comparison thermal conductivity of alumina fiber insulation (ρ= 205 kg/m3) by
異種測定法間の差
異種測定法間の差
l
保護熱板法、非定常熱線法、周期加熱法、
ホットディスク法に関して、同一試験体であ
れば、測定結果は±
10%以内で一致する。
未知の材料に適用可能
推定式の結果と測定結果の
推定式の結果と測定結果の
比較による精度向上
比較による精度向上
測定精度の高い高嵩
密度断熱材のデータ
から推定式を作成
なぜ推定式が必要か?
低嵩密度(
20kg/m
3以下)断熱材
は、ふく射エネルギーを透過さ
せてしまうため、測定誤差が大
きい。装置に依存してしまう。
異種測定法による
チェックが難しい
測定結果と
推定結果を
比較
精度向上
従来の推定式と問題点
従来の推定式と問題点
最も実用的な式
=
a
+
b
+
c
a, b, cは係数
ρは嵩密度
r
r
l
*その他の数多くの推定式
箇々の素材の熱物
性値や素材同士の
接触熱抵抗を必要
としている
開発スピードにつ
いて行けず、実用
性に欠ける
従来の推定式の問題点
従来の推定式の問題点
1. 温度の関数になっていない
2. 嵩密度のみの関数:他の情報(固体、ふく射、気体
による伝熱効果)が得られない
3. 高嵩密度試験体で推定式を作成すると、低嵩密度
側は外挿になるため、推定精度が悪い
試験体ごとに、最小自乗法を使って
係数
a, b, c を導出しているため
根本的な原因
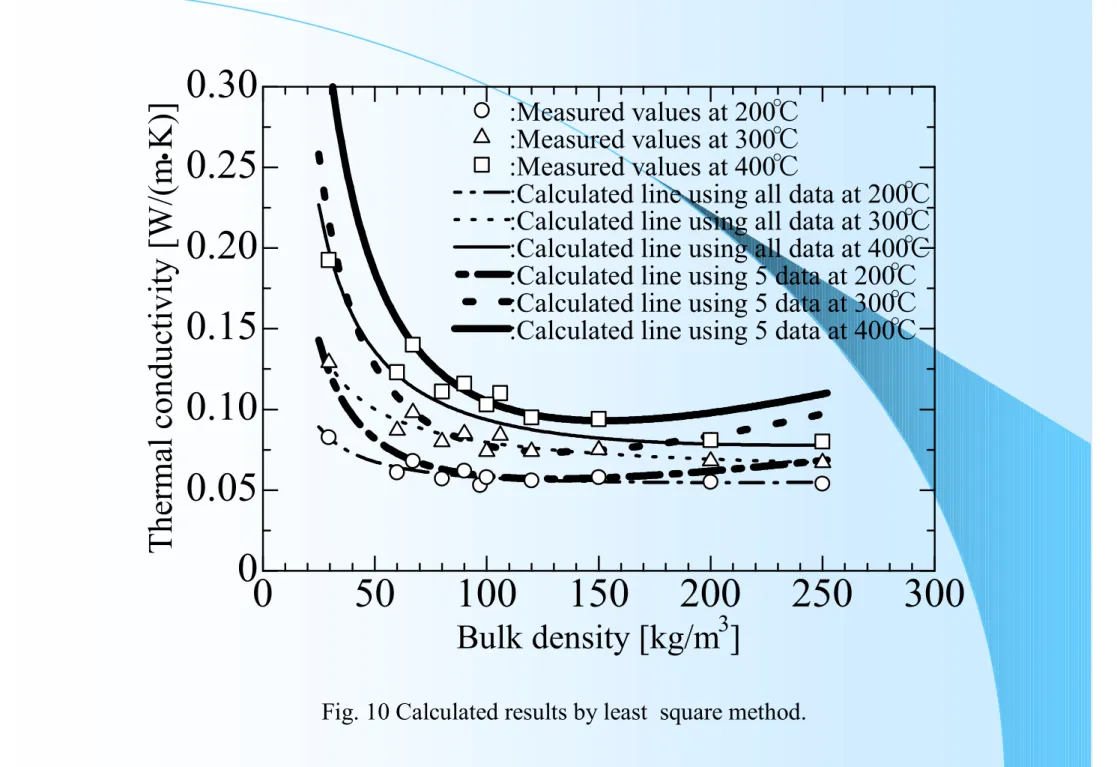
0
50
100
150
200
250
300
0
0.05
0.10
0.15
0.20
0.25
0.30
Bulk density [kg/m
3]
T
he
rm
al
c
on
du
ct
iv
ity
[
W
/(
m
K
)]
:Measured values at 200℃
:Measured values at 300℃
:Measured values at 400℃
:Calculated line using all data at 200℃
:Calculated line using all data at 300℃
:Calculated line using all data at 400℃
:Calculated line using 5 data at 200℃
:Calculated line using 5 data at 300℃
:Calculated line using 5 data at 400℃
・
係数
係数
U
U
および
および
V
V
0
0
の
の
決定
決定
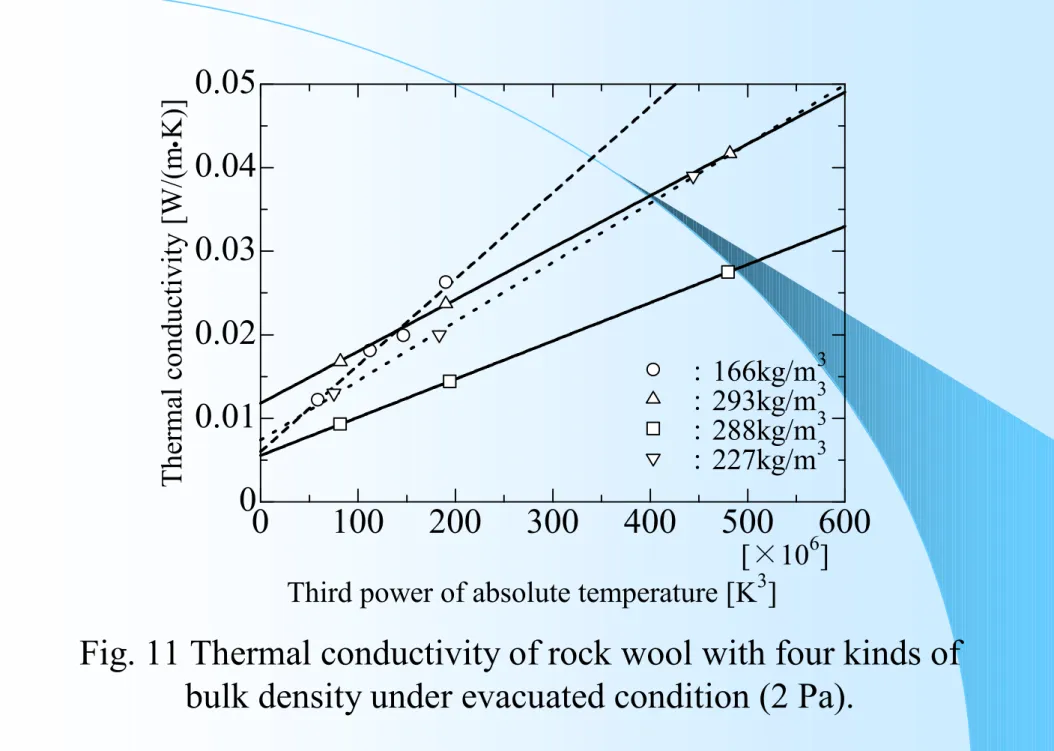
真空下の熱伝導率λ
v
:
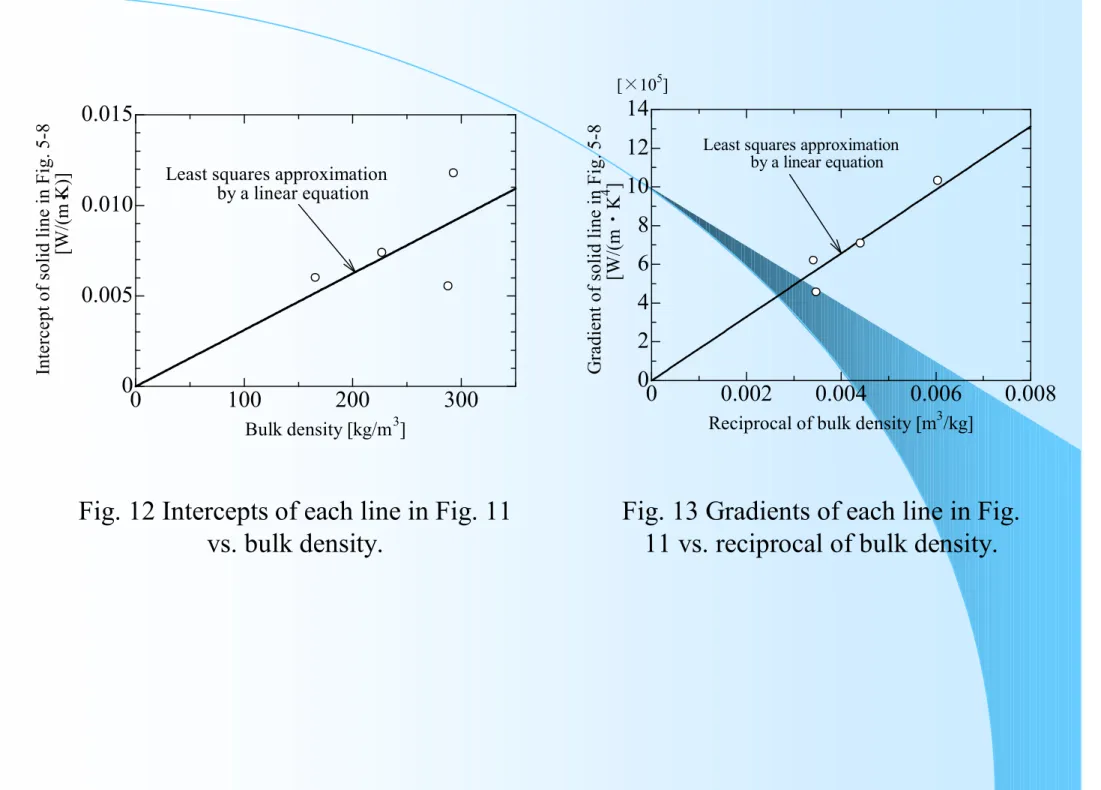
λv T 3 Aρ B /ρ ρ切片
=Aρ
切片 A傾き
=B/ρ
傾き B 1/ρ3
T
B
A
v
r
r
l
=
+
0
100
200
300
400
500
600
0
0.01
0.02
0.03
0.04
0.05
Third power of absolute temperature [K
3]
T
he
rm
al
c
on
du
ct
iv
it
y
[W
/(
m
K
)]
[×10
6]
:
166kg/m
3:
293kg/m
3:
288kg/m
3:
227kg/m
3・
Fig. 11 Thermal conductivity of rock wool with four kinds of
bulk density under evacuated condition (2 Pa).
0 100 200 300 0 0.005 0.010 0.015 Bulk density [kg/m3] In te rc ep t o f so li d li ne in F ig . 5 -8 [W /( m K )] ・
Least squares approximation by a linear equation
Fig. 12 Intercepts of each line in Fig. 11
vs. bulk density.
0 0.002 0.004 0.006 0.008 0 2 4 6 8 10 12 14Reciprocal of bulk density [m3/kg]
G ra di en t o f so li d li ne in F ig . 5 -8 [ W /( m ・ K 4 ] [×105]
Least squares approximation by a linear equation
Fig. 13 Gradients of each line in Fig.
11 vs. reciprocal of bulk density.
0 50 100 150 200 250 300 0.02 0.03 0.04 0.05 0.06 0.07 0.08 Bulk density [kg/m3] T he rm al c on du ct iv ity [ W /( m K )] :Measured values at 20℃ :Measured values at 60℃ :Measured values at 100℃
:Calculated line by Eq.(5-36) at 20℃
:Calculated line by Eq.(5-36) at 60℃
:Calculated line by Eq.(5-36) at 100℃
・
Fig. 14 Thermal conductivity of
rock wool.
0 50 100 150 200 250 300 0 0.05 0.1 0.15 0.2 0.25 0.3 Bulk density [kg/m3] T he rm al c on du ct iv it y [W /( m K )] :Measured values at 200℃ :Measured values at 300℃ :Measured values at 400℃:Calculated line by Eq.(5-36) at 200℃ :Calculated line by Eq.(5-36) at 300℃ :Calculated line by Eq.(5-36) at 400℃
・
Fig. 15 Thermal conductivity of rock
wool.
0
50
100
150
200
250
0
0.05
0.10
0.15
0.20
0.25
0.30
Bulk density [kg/m
3]
T
he
rm
al
c
on
du
ct
iv
it
y
[W
/(
m
K
)]
100℃
200℃
300℃
400℃
500℃
600℃
・
真比熱と平均比熱
真比熱と平均比熱
(
s
base
)
s
s
st
H
H
d
d
m
c
=
1
-1
1
q
真比熱
2
1
2
1
1
s
s
s
s
s
sm
H
H
m
c
q
q
-=
平均比熱
① Cylindrical heater
② Specimen
③ Digital multimeter
④ Temperature controller
⑤-1 Thermocouple
⑥ Measuring water tank
⑦ Monitoring water tank
⑧ Support plate ⑨ Personal computer ① ② ③ ④ ⑥ ⑦ ⑤ -2 ⑧ ⑨ ⑤ -1 1 5 2 2 7 5 1 4 0 7 0 0 2 5 0 6 0 0 φ 8 9 φ 1 9 1 ⑤-2 Thermocouple
Fig. 17 Schematic of specific heat measuring apparatus
(Type: S1000)
0 200 400 600 800 1000 1200 0 200 400 600 800 1000 1200 1400 Temperature [℃] E nt ha lp y [k J/ kg ] :Measured values :Eq.(2-90) +10% -10%
Fig. 18 Enthalpy of the standard
specimen SRM720 Synthetic
Sapphire (α-Al
2O
3)
0 200 400 600 800 1000 1200 0 0.2 0.4 0.6 0.8 1.0 1.2 1.4 1.6 Temperature [℃] M ea n sp ec if ic h ea t [ kJ /k g/ K ] :Measured values :Eqs.(2-15) and (2-90) +10% -10%Fig. 19 Mean specific heat of the
standard specimen SRM720
Synthetic Sapphire (α-Al
2O
3)
0 200 400 600 800 1000 1200 0 0.2 0.4 0.6 0.8 1.0 1.2 1.4 1.6 Temperature [℃] S pe ci fi c he at [ kJ /k g/ K ] +5% -5%
SiC refractory material ρ=2800kg/m3
Ts1=290~1000℃
:Measured values (Mean specific heat) :Mean specific heat by Eq. (6-9) :True specific heat
Fig. 20 Mean and true specific heats of SiC refractory. 0 200 400 600 800 1000 1200 0 0.2 0.4 0.6 0.8 1 1.2 1.4 1.6 Rockwool ρ=100kg/m3 Ts1=100~700℃ +5% -5% Temperature [℃] Sp ec if ic h ea t [ kJ /k g/ K
] :Measured values (Mean specific heat):Mean specific heat Eq. (6-9)
:True specific heat
Fig. 21 Mean and true specific heats of rock wool. 0 200 400 600 800 1000 1200 0 0.2 0.4 0.6 0.8 1 1.2 1.4 1.6 Temperature [℃] S pe ci fi c he at [ kJ /k g/ K ]
Alumina silica fiber insulation ρ=130kg/m3
Ts1=100~1000℃
+5% -5%
:Measured values (Mean specific heat) :Mean specific heat by Eq. (6-9) :True specific heat
0 200 400 600 800 1000 1200 0 0.2 0.4 0.6 0.8 1.0 1.2 1.4 1.6 Temperature [℃] S pe ci fi c he at [ kJ /k g/ K ] +5% -5% Calcium-silicate insulation ρ=130kg/m3 Ts1=120~1000℃
:Measured values (Mean specific heat) :Mean specific heat by Eq. (6-9)
:True specific heat
Fig. 23 Mean and true specific heats of calcium-silicate insulation. 0 200 400 600 800 1000 1200 0 0.2 0.4 0.6 0.8 1.0 1.2 1.4 1.6 Temperature [℃] S pe ci fi c he at [ kJ /k g/ K ] +5% -5% SiO2-glass ρ=2465kg/m3 Ts1=200~600℃
:Measured values (Mean specific heat)
:Mean specific heat by Eq. (6-9)
:True specific heat
Fig. 24 Mean and true specific heats of SiO2-glass. 0 50 100 150 200 250 300 0 0.2 0.4 0.6 0.8 1.0 1.2 1.4 1.6 +5% -5% Temperature [℃] Sp ec if ic h ea t [ kJ /k g/ K ] Fluoro rubber ρ=1858kg/m3 Ts1=100~200℃
:Measured value (Mean specific heat) :Mean specific heat by Eq. (6-9) :True specific heat

![Fig. 14 Thermal conductivity of rock wool. 0 50 100 150 200 250 30000.050.10.150.20.250.3Bulk density [kg/m3]Thermal conductivity [W/(m K)]:Measured values at 200℃:Measured values at 300℃:Measured values at 400℃](https://thumb-ap.123doks.com/thumbv2/123deta/5829320.542708/26.1261.91.1186.51.821/thermal-conductivity-density-thermal-conductivity-measured-measured-measured.webp)
