NUMERICAL ASSESSMENT FOR THE BEHAVIOR OF THE PLEISTOCENE MARINE FOUNDATIONS DUE TO CONSTRUCTION OF THE 1ST PHASE ISLAND OF KANSAI INTERNATIONAL AIRPORT
14
0
0
全文
(2) MIMURA AND JEON. 1116. Fig. 1.. Location map for Kansai International Airport. void ratio and the logarithm of applied overburden within the range of virgin compression. On the basis of these ˆndings, Mimura et al. (1994) proposed the trilinear compression model for the Pleistocene clays of KIX construction site. This modeling provided a rapid advance in settlement without any signiˆcant dissipation of excess pore water pressure, which has actually occurred in the ˆeld. Mimura and Jang (2004) proposed a concept of compression in which viscoplastic behavior is assumed to occur even in the quasi-overconsolidated region less than pc for the Pleistocene clays in Osaka Bay. The procedure has been found to be versatile and allows for the long-term settlement monitored in the reclaimed islands in Osaka Port to be described (Mimura and Jang, 2005a). In the present paper, the time-dependent behavior of the Pleistocene deposits of the reclaimed foundation of the 1st phase island of KIX is investigated based on the elasto-viscoplastic ˆnite element analyses. Here, the performance of excess pore water pressure propagation in the Pleistocene deposits is highlighted. The mass permeability of the Pleistocene sand gravel deposits is selected as one of the parameters controlling the deformation of the foundation ground. It is of importance to know how far the generated excess pore water pressure will propagate in permeable sand gravel layers because it directly in‰uences the performance of the adjacent structures. The eŠect of the existence of excess pore water pressure in the permeable Pleistocene sand gravel layers on the subsequent advance in settlement of the Pleistocene deposits is of great concern for predicting the longterm settlement of the oŠshore-reclaimed marine foundations. Based on trial calculations, the authors show how to assess the actual behavior of the foundation ground that is taking place in the case of large-scale oŠshore reclamation such as KIX. FRAMEWORK OF NUMERICAL ASSESSMENT. Elasto-Viscoplastic Model The elasto-viscoplastic constitutive model used in this. paper was proposed by Sekiguchi (1977). Sekiguchi et al. (1982) modiˆed the model to a plane-strain version. The viscoplastic ‰ow rule for the model is generally expressed as follows:. e· pij=L. &F &s?ij. (1). in which F is the viscoplastic potential and L is the proportional constant. Viscoplastic potential F is deˆned as follows:. «. F=a・ln 1+. n· 0・t exp a. Ø f » $= a. np. (2). in which a is a secondary compression index, n· 0 is the reference volumetric strain rate, f is the function in terms of the eŠective stress and expressed in the following form:. f=. l- k sm ・ln +D 1+ e 0 (sm)0. {. 2J 2 ( 2 J2 ) 0 - sm ( sm ) 0. }. (3). Here, l and k are the compression and swelling index, 2J2 and s?m are the second invariant of shear stress and mean eŠective stress, and D denotes the dilatancy coe‹cient. The subscript, 0 means the stress at the initial condition. The concrete form of the model is also shown in the reference (Mimura and Sekiguchi, 1986). The resulting constitutive relations are implemented into the ˆnite element analysis procedure through the following incremental form:. Ds?t=[C ep]sDet-s DsRt s. (4). Where s Ds?tand s Detare the associated sets of the eŠective stress increments and the strain increments respectively, and [C ep] stands for the elasto-viscoplastic coe‹cient matrix. The term ssRt represents a set of `relaxation stress', which increases with time when the strain is held constant. The pore water ‰ow is assumed to obey isotropic Darcy's law. In relation to this, it is further assumed that the coe‹cient of permeability, k, depends on the void ratio, e, in the following form:.
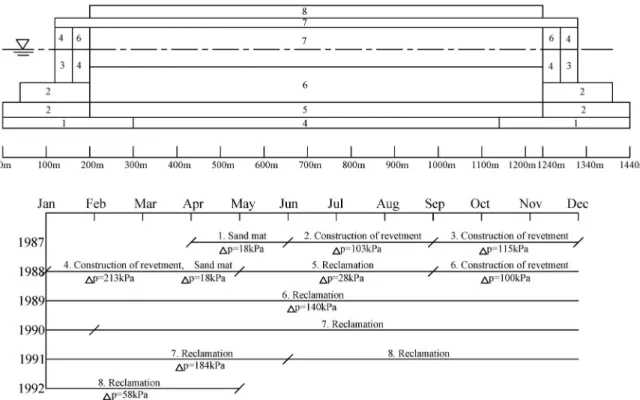
(3) NUMERICAL ANALYSIS OF MARINE FOUNDATIONS. k=k0・exp. Ø » e- e0 lk. (5). in which k0 is the initial value of k at e=e0 and lk is a material constant governing the rate of change in permeability subjected to a change in the void ratio under the condition that the coe‹cients of consolidation, cv are constant for the individual Pleistocene clays. Note that each quadrilateral element consists of four constant strain triangles and the nodal displacement increments and the element pore water pressure is taken as the primary unknowns of the problem. The ˆnite element equations governing those unknowns are established on the basis of Biot's formulation (Christian, 1968; Akai and Tamura, 1976), and are solved numerically using the semi-band method of the Gaussian elimination.. Compression Modeling for Quasi-overconsolidated Pleistocene Clays Based on the in-situ measured data, long-term settlement has been found to take place in the reclaimed islands of Osaka Port even in Pleistocene clay layers that do not undergo plastic yielding (Mimura et al., 2001). As it is also stated, the seabed deposits of Osaka Bay have been formed due to the soil supply from the rivers on the sinking base. Therefore, those sediments such as the Pleistocene clays should be normally consolidated even though they exhibit an apparent overconsolidation with an OCR of 1.2 to 1.6. The authors consider those quasioverconsolidated Pleistocene clays as ``normally consolidated aged clays'' with seeming overconsolidation due to the diagenesis eŠect. In this sense, the following assumption is introduced: The Pleistocene clays in Osaka Bay are ``normally consolidated aged clays'' that exhibit the elasto-viscoplastic behavior even in the region p0+DpÃpc, while an elastic behavior is assumed to occur in this region by the conventional constitutive models. Figure 2 shows the conventional and the proposed compression models schematically. Here, the Pleistocene clays are assumed to exhibit the time-dependent behavior not only in the normally consolidated region but also in the overconsolidated region when the positive loading increment Dp is applied ( p?Ã p0).. Fig. 2. Compression modeling for the Pleistocene clays. 1117. The stress, pc in the proposed model does not denote the conventional yield stress but is regarded as one change in the phase of clay deformation on the reference consolidation curve for monotonic compression due to the fading structural eŠect. The procedure with the proposed concept is found to provide descriptive accuracy for predicting the long-term deformation of the reclaimed Pleistocene deposits in Osaka Port (Mimura and Jang, 2004, 2005a). In the present study, the elasto-viscoplastic ˆnite element code with the proposed compression model is also used to investigate the stress-deformation characteristics of the Pleistocene deposits due to the oŠshore airport ˆll of KIX. FOUNDATION MODEL AND PARAMETERS. Foundation Model and Hydraulic Boundary A series of elasto-viscoplastic ˆnite element analyses is performed to assess the long-term settlement and the generation/dissipation process of excess pore water pressure for the Pleistocene foundation of the 1st phase island of KIX due to oŠshore reclamation. Figure 3 shows the plan view of the 1st phase island of KIX together with the location of monitoring point 1, where the diŠerential settlement of the individual Pleistocene clay layers as well as the excess pore water pressure at various depths, both in the clay and the sand gravel layers, have been measured. A series of elasto-viscoplastic ˆnite element analyses is carried out along the section shown by A-A? in Fig. 3. The model foundation used is schematically shown in Fig. 4, and the construction sequence is shown in Fig. 5 with the increasing process of the applied stress due to reclamation. The prescribed ˆnal overburden due to airport ˆll construction amounts to about 430 kPa at the monitoring point 1. Here, Ma and Ds denote the marine clay and the Pleistocene sand gravel layer respectively, and the individual names of the Pleistocene clay layers have been updated to the present ones based on the geological ˆndings from the boring KIX18–1 (Kitada et al, 2009). Ma13 is the Holocene marine clay whereas the others are Pleistocene in origin. The original foundation is set from the elevation of -18 m to -166 m. For the. Fig. 3. Plan view of the 1st phase island of Kansai International Airport and the location of the monitoring point.
(4) MIMURA AND JEON. 1118. Fig. 4.. Schematic cross-section of the foundation ground of Kansai International Airport for ˆnite element analysis. Fig. 5.. Schematic cross-section of the airport ˆll and the construction sequence. normally consolidated Holocene clay deposit, Ma13, sand drains are driven in a rectangular conˆguration with a pitch of 2.0 to 2.5 meters to promote the consolidation. The modeling of sand drains is simulated by the macroelement method (Sekiguchi et al., 1986). The lateral boundary of the clay layers (A-A? lines) in Fig. 4 is assumed to be undrained while that of the sand gravel layers is assumed to be fully drained. The bottom boundary is hence assumed to be undrained because Ds10 is under-. lain by Ma3 whose permeability is low enough to be impermeable. Mimura and Sumikura (2000) reported that insu‹cient distance to the hydraulic boundary causes the dissipation of excess pore water pressure to be overestimated, and that the permeable sand gravel layers play a signiˆcant role in controlling the rate of consolidation. It is natural that the calculated results are seriously in‰uenced by the setting of boundary conditions. In the case of KIX, as there are alternating permeable sand.
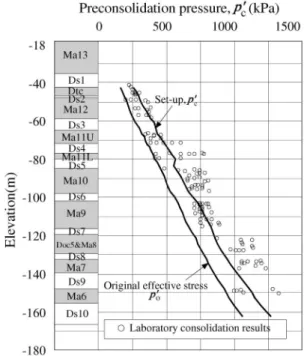
(5) NUMERICAL ANALYSIS OF MARINE FOUNDATIONS. 1119. gravel layers sandwiched by the Pleistocene clay layers, the propagation of excess pore water pressure through those permeable sand gravel layers should be of concern. Then, the eŠect of the mesh size in terms of the distance to the seaside boundary merits due consideration with regard to the subsequent deformation. Mimura and Jang (2005b) reported that when the distance to the boundary is set to be about 10 times of the loading area, the eŠect of the hydraulic boundary condition can be ruled out. Based on the ˆndings, the FE mesh used in the present study is shown in Fig. 4. As shown in Fig. 4, while the loading area by reclamation of the 1st phase island is 1,440 m, the distance to the right boundary is set to be 5,000m, which is the actual distance from land. For the opposite oŠshore side boundary, it is set to be 11,440 m to make the numerical results free from the eŠect of the hydraulic boundary. The larger distance for the left boundary was set after considering that the 2nd phase island will be constructed on this side in future.. Soil Parameters The Pleistocene clays in Osaka Bay exhibit slight overconsolidation due to the eŠect of diagenesis, such as the aging eŠect and/or development of cementation among clay particles. In this analysis, the Pleistocene clay layers are assumed to be lightly overconsolidated, and the values of OCR are assumed to about 1.2 to 1.6 based on the result derived from conventional step loading consolidation test. Figure 6 shows the distribution of pc with depth in the Pleistocene clay deposits at KIX. According to the report by Akai and Sano (1981), the values of pc-p0 are almost constant for the upper to middle Pleistocene clays. Based on the this, the mean values of the scattered data of the consolidation yield stresses are selected as the representative values of pc shown by the solid line in Fig. 6. Here, the values of OCR are assumed to be identical for the individual Pleistocene clay layers. As a result, the values for some layers have been set on the safer side. The resultant proˆle of OCR for the Pleistocene clays is shown in Fig. 7. The values of OCR are decreasing with depth, showing the largest at the top of the Pleistocene clay with 1.60 and the smallest at the bottom with 1.20. The Pleistocene sand gravel layers, which are expressed by Ds, are also assumed to be linear elastic material. The model foundation for ˆnite element analysis shown in Fig. 4 is assumed to be horizontally continuous for the sand gravel layers sandwiched by the Pleistocene clay layers. However, how the sand gravel layers under the Pleistocene marine foundation are distributed in practice has not been deˆnitely conˆrmed. Due attention should be paid to the fact that the thickness, the horizontal continuity and the ˆne contents of the sand gravel layers are the in‰uential factors which control the process of the generation and dissipation of excess pore water pressure in the Pleistocene deposits. In present study, the concept of ``mass permeability'' is introduced. It is true the values of the coe‹cient of permeability, k were derived based on the experiments, but for such a large scale reclamation, those experimental values are meaningful as long. Fig. 6.. Distribution of preconsolidation pressure ( pc) with depth. Fig. 7. Set up Overconsolidation Ratio (OCR) for the Pleistocene clays. as the distributed structure of the sand gravel layers are rationally modeled over a wide range. At present, no detailed distribution model for them can be established. Furthermore, the permeability controlling the advance in consolidation is not the one derived in the laboratory but the one that actually functions in the ˆeld. The authors consider this practical permeability as ``mass permeability'', the permeability that eŠectively controls the process of excess pore water dissipation in the ˆeld. The ``equivalent coe‹cient of permeability'' is hence introduced as a representative of ``mass permeability'' by considering the.
(6) 1120. MIMURA AND JEON. horizontal continuity, the change of thickness horizontally and the degree of ˆne contents for the Pleistocene sand gravel deposits. For convenience, the sand gravel layers are assumed to be level and continuous and the equivalent coe‹cients of permeability are provided for the individual sand gravel layers following the above-mentioned judgment. No comprehensive laboratory tests have been conducted for deriving the coe‹cient of permeability of the Pleistocene sand gravel materials because of the di‹culties in obtaining the high quality undisturbed samples from deep sedimentation. Furthermore, the Pleistocene sand gravel layers were considered perfectly drained at the early stage of the projects. The importance of the permeability of the Pleistocene sand gravel layers was recognized through the in-situ measurement of the excess pore water pressure in the individual layers (Akai and Tanaka, 1999). On the basis of the ˆndings by Itoh et al. (2001), Takemura and Nakaseko (2005) summarized the status of the Pleistocene sand gravel deposits at KIX based on the geophysical and geological investigation. The brief evaluation for the individual sand gravel layers (Ds) is explained as follows: Ds1: This unit is correlated with the Tenma Formation at Osaka Plain. The seismic re‰ection proˆle shows that Ds1 is widely and consistently distributed beneath KIX. Ds2: This unit is deposited in marine environment at temporal lower sea level stage during the Last Interglacial Period and has a narrow distribution parallel to the present shoreline. Ds3: This unit includes the sediments deposited in river ‰oor and ‰ood plain at lower sea level stages and widely distributed particularly beneath the 2nd phase island. Ds4: This unit is deposited under the deltaic condition. The mode of distribution is similar to Ds3. Ds5: This unit is widely distributed particularly beneath the 2nd phase island. Relatively coarse materials are situated in the old river ‰oor and ‰ood plain towards the main land. Ds6: The distributed area of this unit is relatively narrow with deˆnite limitation of existence oŠshore. It is deposited in the river ‰oor and ‰ood plain. Ds7: Blackish environment during regression produced relatively ˆne sand layers. This unit includes small-scale river ‰oor deposits to land direction with deˆnite limitation of existence oŠshore. Ds8: This unit includes the sediments in the ‰ood plain and small-scale river ‰oor deposits. Deˆnite distribution is expected beneath the airport islands. Ds9: This unit has the river ‰oor deposits indicating lower sea level stage. A similar distribution is expected as Ds8. Ds10: This coarser unit is called ``basal gravel of Kukojima Formation''. Flood plain deposits are observed in the sequence. Deˆnite distribution is found towards the main land with occasional sandwiched clay layers. This layer is thought to be function as a predominant permeable one as same as Ds1. Here, it is important to realize that the geological and. geophysical output about the qualitative evaluation for permeability of the Pleistocene sand gravel layers has to be transformed to the quantitative numerical values of the coe‹cient of permeability to apply to the present elasto-viscoplastic ˆnite element procedure. On the basis of the above-mentioned evaluation for permeability of the Pleistocene sand gravel layers, a series of three-dimensional seepage analyses around the marine foundations of KIX was conducted (Kansai International Airport Co., 2002; Nishigaki and Imai, 2005). By providing coe‹cients of permeability in the order of 100 m/day to 101 m/day for the individual sand gravel layers, the insitu generation and dissipation process of the excess pore water pressure was reproduced. In the present analyses, those values are introduced as references. The deˆnite numerical values for the equivalent coe‹cient of permeability as input parameters for the Pleistocene sand gravel layers were adjusted to reproduce the measured results of the individual layers over 14 years as shown in Table 1. It is noteworthy to assume that the equivalents of coe‹cient for Ds6 and Ds7 evaluated poorly permeable were decreased drastically while ordinary values were set for other sand gravel layers. The other soil parameters for the constitutive model are rationally determined based on the prescribed determination methods (Mimura et al., 1990; Mimura and Jang, 2004). The determination of principal soil parameters for analysis with proposed procedure is explained as follows: (a) Compression index l in the normally consolidated region. The deˆnition of compression index l in the NC region is. l=0.434Cc. (5). Here, Cc is a compression index in terms of the common logarithms of consolidation pressure, which can be derived by conventional oedometer test. In general, the value of Cc is not constant, but non-linear against consolidation pressure particularly for clays with developed structure. (b) Recompression index k The deˆnition of recompression index k. k=0.434Cs. (6). Here, Cs is a recompression index in terms of the common logarithms of consolidation pressure, which can be also derived by conventional step loading consolidation test. Based of the fact that most values of the ratio Cs/Cc (k/l) are in the range of 0.02 to 0.2 (Terzaghi et al., 1996), it is assumed that Cs is one-tenth of Cc as a representative in the present study. (c) Compression index lQOC and recompression index kQOC in the quasi-overconsolidation region In the present analysis, the above-mentioned procedure is adopted, namely, the compression curve in the quasioverconsolidated region with inclination of k is assumed to have elasto-viscoplastic component the same as in the NC region. As e-log p relations are adopted as reference consolidation curves for clays, the recompression index,.
(7) NUMERICAL ANALYSIS OF MARINE FOUNDATIONS Table 1.. Principal soil parameters for the foundation of Kansai International Airport. Quasi-OC region MTYP. 1121. NC region. n?. k. aNC. ·n0 NC (day-1). M. l. K0. p0 (kPa). pc (kPa). e0. k0 (m/day). lk. Name of layers. 0.5093 0.5321 0.5316 0.5178 0.4927 0.5097 0.4184 0.4889 0.4046 — — 0.2392 0.2182 0.3406 — 0.6840 0.6907 0.5997 0.6129 0.4985 0.5106 0.5227 — 0.4376 0.4605 0.3063 0.1024 — 0.6095 0.3105 0.4507 — 0.3935 0.5177 0.5779 0.7538 0.7859 0.5621 — 0.5625 0.6383 0.7216 0.7646 0.6591 0.5125 —. 0.0509 0.0532 0.0532 0.0518 0.0493 0.0510 0.0418 0.0489 0.0405 — — 0.0239 0.0218 0.0341 — 0.0684 0.0691 0.0600 0.0613 0.0499 0.0511 0.0523 — 0.0438 0.0460 0.0306 0.0102 — 0.0610 0.0311 0.0451 — 0.0393 0.0518 0.0578 0.0754 0.0786 0.0562 — 0.0563 0.0638 0.0722 0.0765 0.0659 0.0512 —. 6.06E-03 6.65E-03 6.99E-03 7.09E-03 7.14E-03 7.61E-03 6.86E-03 8.02E-03 6.98E-03 — — 5.53E-03 5.04E-03 6.69E-03 — 1.07E-02 1.11E-02 1.02E-02 1.11E-02 9.63E-03 9.87E-03 1.01E-02 — 8.90E-03 9.16E-03 6.80E-03 2.57E-03 — 1.20E-02 6.67E-03 9.83E-03 — 9.14E-03 1.06E-02 1.14E-02 1.35E-02 1.42E-02 1.17E-02 — 1.17E-02 1.28E-02 1.40E-02 1.48E-02 1.37E-02 1.13E-02 —. 6.06E-06 6.65E-06 6.99E-06 7.09E-06 7.14E-06 7.61E-06 6.86E-06 8.02E-06 6.98E-06 — — 4.12E-06 3.76E-06 4.99E-06 — 1.75E-06 1.83E-06 1.68E-06 1.83E-06 1.58E-06 1.62E-06 1.66E-06 — 9.51E-06 9.79E-06 7.27E-06 2.75E-06 — 5.65E-05 3.15E-05 4.64E-05 — 2.55E-06 2.97E-06 3.17E-06 3.76E-06 3.97E-06 3.27E-06 — 3.18E-06 3.48E-06 3.79E-06 4.02E-06 3.71E-06 3.07E-06 —. 1.40 1.40 1.40 1.40 1.40 1.40 1.40 1.40 1.40 — — 1.10 1.10 1.10 — 1.30 1.30 1.30 1.30 1.25 1.25 1.25 — 1.20 1.20 1.20 1.20 — 1.25 1.25 1.25 — 1.25 1.25 1.25 1.25 1.25 1.25 — 1.25 1.25 1.25 1.25 1.25 1.25 —. 0.35 0.35 0.35 0.35 0.35 0.35 0.35 0.35 0.35 0.33 0.33 0.38 0.38 0.38 0.33 0.36 0.36 0.36 0.36 0.36 0.36 0.36 0.33 0.37 0.37 0.37 0.37 0.33 0.36 0.36 0.36 0.33 0.36 0.36 0.36 0.36 0.36 0.36 0.33 0.36 0.36 0.36 0.36 0.36 0.36 0.33. 3.20 3.00 2.80 2.65 2.45 2.35 2.05 2.05 1.90 — — 1.16 1.16 1.55 — 2.21 2.10 1.94 1.76 1.59 1.59 1.59 — 1.46 1.51 1.25 0.99 — 1.54 1.33 1.29 — 1.15 1.44 1.54 1.80 1.76 1.40 — 1.40 1.49 1.58 1.58 1.41 1.27 —. 8.64E-04 8.64E-04 8.64E-04 8.64E-04 8.64E-04 8.64E-04 8.64E-04 8.64E-04 8.64E-04 2.16E+01 2.16E+01 1.73E-04 2.07E-04 1.81E-04 1.30E+00 1.90E-04 1.47E-04 9.07E-05 9.50E-05 5.62E-05 5.62E-05 5.62E-05 1.08E+01 9.50E-05 9.07E-05 7.08E-05 5.27E-05 3.89E+00 5.88E-05 6.05E-05 6.48E-05 3.89E+00 3.80E-05 4.49E-05 7.60E-05 6.13E-05 5.23E-05 5.18E-05 2.59E-01 9.50E-05 9.07E-05 9.50E-05 9.07E-05 7.34E-05 6.91E-05 8.64E-02. 0.509 0.532 0.532 0.518 0.493 0.510 0.418 0.489 0.405 — — 0.239 0.218 0.341 — 0.684 0.691 0.600 0.613 0.499 0.511 0.523 — 0.438 0.460 0.306 0.102 — 0.610 0.311 0.451 — 0.393 0.518 0.578 0.754 0.786 0.562 — 0.563 0.638 0.722 0.765 0.659 0.512 —. Ma13U–1 Ma13U–2 Ma13U–3 Ma13U–4 Ma13U–5 Ma13U–6 Ma13L–1 Ma13L–2 Ma13L–3 Ds1–1 Ds1–2 Dtc–1 Dtc–2 Dtc–3 Ds2 Ma12U–1 Ma12U–2 Ma12U–3 Ma12U–4 Ma12L–1 Ma12L–2 Ma12L–3 Ds3 Ma11U–1 Ma11U–2 Ma11U–3 Ma11U–4 Ds4 Ma11L–1 Ma11L–2 Ma11L–3 Ds5 Ma10–1 Ma10–2 Ma10–3 Ma10–4 Ma10–5 Ma10–6 Ds6 Ma9–1 Ma9–2 Ma9–3 Ma9–4 Ma9–5 Ma9–6 Ds7 Doc5 & Ma8–1 Doc5 & Ma8–2 Doc5 & Ma8–3 Ds8 Ma7–1 Ma7–2 Ma7–3 Ds9 Ma6–1 Ma6–2 Ma6–3 Ds10–1 Ds10–2. lQOC. kQOC. aQOC. ·n0 QOC (day-1). 1 2 3 4 5 6 7 8 9 10 11 12 13 14 15 16 17 18 19 20 21 22 23 24 25 26 27 28 29 30 31 32 33 34 35 36 37 38 39 40 41 42 43 44 45 46. 0.0509 0.0532 0.0532 0.0518 0.0493 0.0510 0.0418 0.0489 0.0405 — — 0.0239 0.0218 0.0341 — 0.0684 0.0691 0.0600 0.0613 0.0499 0.0511 0.0523 — 0.0438 0.0460 0.0306 0.0102 — 0.0610 0.0311 0.0451 — 0.0393 0.0518 0.0578 0.0754 0.0786 0.0562 — 0.0563 0.0638 0.0722 0.0765 0.0659 0.0512 —. 0.0051 0.0053 0.0053 0.0052 0.0049 0.0051 0.0042 0.0049 0.0040 — — 0.0024 0.0022 0.0034 — 0.0068 0.0069 0.0060 0.0061 0.0050 0.0051 0.0052 — 0.0044 0.0046 0.0031 0.0010 — 0.0061 0.0031 0.0045 — 0.0039 0.0052 0.0058 0.0075 0.0079 0.0056 — 0.0056 0.0064 0.0072 0.0076 0.0066 0.0051 —. 6.06E-04 6.65E-04 6.99E-04 7.09E-04 7.14E-04 7.61E-04 6.86E-04 8.02E-04 6.98E-04 — — 5.53E-04 5.04E-04 6.69E-04 — 1.07E-03 1.11E-03 1.02E-03 1.11E-03 9.63E-04 9.87E-04 1.01E-03 — 8.90E-04 9.16E-04 6.80E-04 2.57E-04 — 1.20E-03 6.67E-04 9.83E-04 — 9.14E-04 1.06E-03 1.14E-03 1.35E-03 1.42E-03 1.17E-03 — 1.17E-03 1.28E-03 1.40E-03 1.48E-03 1.37E-03 1.13E-03 —. 6.06E-07 6.65E-07 6.99E-07 7.09E-07 7.14E-07 7.61E-07 6.86E-07 8.02E-07 6.98E-07 — — 4.12E-07 3.76E-07 4.99E-07 — 1.75E-07 1.83E-07 1.68E-07 1.83E-07 1.58E-07 1.62E-07 1.66E-07 — 9.51E-07 9.79E-07 7.27E-07 2.75E-07 — 5.65E-06 3.15E-06 4.64E-06 — 2.55E-07 2.97E-07 3.17E-07 3.76E-07 3.97E-07 3.27E-07 — 3.18E-07 3.48E-07 3.79E-07 4.02E-07 3.71E-07 3.07E-07 —. 0.540 0.540 0.540 0.540 0.540 0.540 0.540 0.540 0.540 0.540 0.500 0.607 0.607 0.607 0.500 0.561 0.561 0.561 0.561 0.572 0.572 0.572 0.500 0.583 0.583 0.583 0.583 0.500 0.572 0.572 0.572 0.500 0.572 0.572 0.572 0.572 0.572 0.572 0.500 0.572 0.572 0.572 0.572 0.572 0.572 0.500. 4.0 12.3 20.8 29.6 38.9 48.7 57.7 65.9 76.2 99.6 133.9 156.8 167.9 178.4 188.5 198.3 208.3 218.9 230.3 239.8 246.9 254.1 284.1 315.4 326.6 340.0 353.6 384.6 412.3 418.8 425.8 453.9 489.9 508.3 521.3 533.1 544.6 557.1 583.4 611.4 627.7 643.4 658.9 675.1 690.5 712.3. 19.1 25.3 31.6 39.2 47.9 57.6 66.9 80.5 91.7 — — 250.9 268.7 285.5 — 297.5 312.5 328.4 345.4 359.6 370.4 381.1 — 425.8 440.9 459.0 477.3 — 556.6 565.4 574.8 — 612.4 635.3 651.6 666.3 680.7 696.4 — 764.2 784.6 804.2 823.7 843.9 863.2 —. 47. 0.1590 0.0159 2.24E-03 1.58E-06 1.5904 0.1590 2.24E-02 1.58E-05 1.25 0.36 0.572. 733.6. 880.4 2.55 2.85E-05 1.590. 48. 0.0541 0.0054 1.11E-03 7.86E-07 0.5407 0.0541 1.11E-02 7.86E-06 1.25 0.36 0.572. 750.3. 900.3 1.43 7.78E-05 0.541. 49. 0.0368 0.0037 8.81E-04 6.23E-07 0.3678 0.0368 8.81E-03 6.23E-06 1.25 0.36 0.572. 775.0. 930.0 1.09 1.30E-05 0.368. 50 51 52 53 54 55 56 57 58 59. — 0.0408 0.0584 0.0343 — 0.0442 0.0387 0.0663 — —. — 0.0041 0.0058 0.0034 — 0.0044 0.0039 0.0066 — —. — 9.41E-04 1.16E-03 8.42E-04 — 9.91E-04 8.99E-04 1.49E-03 — —. — 1.36E-06 1.67E-06 1.22E-06 — 1.25E-06 1.13E-06 1.87E-06 — —. — 0.4077 0.5840 0.3430 — 0.4415 0.3869 0.6633 — —. — 0.0408 0.0584 0.0343 — 0.0442 0.0387 0.0663 — —. — 9.41E-03 1.16E-02 8.42E-03 — 9.91E-03 8.99E-03 1.49E-02 — —. — 1.36E-05 1.67E-05 1.22E-05 — 1.25E-05 1.13E-05 1.87E-05 — —. k is assumed to be the compression index in the quasioverconsolidated region (p0ÃpÃpc). Here, p0, pc and p denote the initial vertical stress, the consolidation yield stress and the current stress respectively. Therefore, the compression index in the quasi-overconsolidated region, lQOC is introduced in the present study as follows:. — 1.25 1.25 1.25 — 1.25 1.25 1.25 — —. 0.33 0.36 0.36 0.36 0.33 0.36 0.36 0.36 0.33 0.33. 0.500 804.4 0.572 828.3 0.572 845.5 0.572 861.3 0.500 910.9 0.572 961.4 0.572 979.4 0.572 997.4 0.500 1035.9 0.500 1095.3. — 994.0 1014.6 1033.6 — 1153.7 1175.3 1196.9 — —. — 1.17 1.52 1.04 — 1.23 1.15 1.23 — —. lQOC=k. 2.16E+00 1.30E-05 2.42E-05 3.02E-05 2.16E+00 3.54E-05 4.49E-05 2.59E-05 6.92E+00 6.92E+00. — 0.408 0.584 0.343 — 0.442 0.387 0.663 — —. (7). Calladaine (1971) showed that the ratio k/l is directly related to a coe‹cient of friction m(=tan q?) that is constant irrespective of a consolidation state. Here, q? denotes an angle of shear resistance. Karube (1975) also.
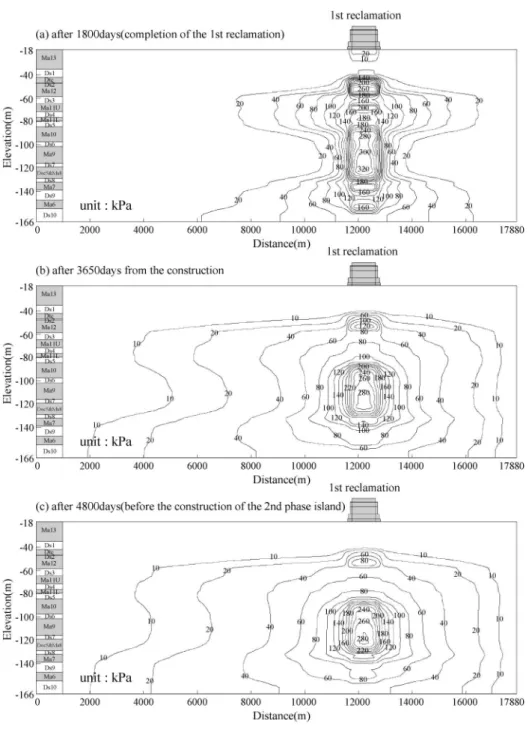
(8) MIMURA AND JEON. 1122. conˆrmed that the relation of the ratio L(=1-k/l) and slope of critical state line M is constant for some clays. As M is constant irrespective of the stress state, the ratio k/l is constant for the speciˆc clay. Based on those ˆndings, kQOC is deˆned in the following relation as is already discussed in the previous section (b):. kQOC=. k lQOC l. (8). (d) Secondary compression index a Secondary compression index aNC governing the timedependant behavior is determined in the NC region using the relationship between Cae and Cc for Osaka Pleistocene clays (Ishii et al., 1984), that is,. Cae=0.05Cc. Fig. 8.. Assumed model for secondary compression index. (9). Here, Cae denotes the secondary compression index in terms of void ratio. A similar relation between Cae and Cc was reported by Marques et al. (2004). The value of aNC then can be determined as follows:. aNC=0.434. Cae 1 + e0. (10). Mesri and Godlewski (1977) showed that the value of a was small at eŠective stresses less than the consolidation yield stress, and it increased as the consolidation yield stress was approached. Murayama and Shibata (1966) explained that Cae for the Pleistocene clays increased linearly with consolidation pressure in the quasi-overconsolidated region, but which became to be constant in the NC region. In the present analysis, it is assumed that aQOC at p0 is one-tenth of the prescribed value in the NC region on the basis of the fact that the adopted ratio of Cs and Cc is 0.1 in this particular case and the adopted relationship between Cc and a (Eq. (9)). Figure 8 shows the assumed modeling for the secondary compression index together with the co-ordinates of the modeling curve based on the experimental ˆndings in terms of relative yield stress index deˆned by ( p-p0)/( pc-p0). It is set up that a increases gradually with the relative yield stress index in the quasi-overconsolidated region thereafter remains constant irrespective of the stress level in the NC region. (e) Reference volumetric strain rate ·vo The rate of consolidation is another signiˆcant factor which controls the process of deformation. The ratio of secondary compression index a to the reference volumetric strain rate ·vo(a/ ·vo) refers to the characteristic time related to the completion of the primary consolidation. The characteristic time tc in the constitutive model is closely related to a coe‹cient of consolidation cv. The value of tc is determined both for the quasi-overconsolidated region and the NC region as a dissipation time of excess pore water pressure, which is calculated using cv in the NC region obtained from conventional oedometer test. It is because of the fact that cv in the quasi-overconsolidated region approaches that of the NC region, although cv in the OC ( pÃp0) region is su‹ciently large compared to that in the NC region (Research Committee on Ground in Osaka Bay, 2002). Based on these ˆndings,. Fig. 9. Relationship between the reference volume strain rate and the relative yield stress. the same values for tc are introduced for both in quasioverconsolidated and NC region in the present study. Based on the parameters, a and tc, the reference volumetric strain rate, ·vo becomes a constant maximum value in the NC region. In the quasi-overconsolidated region, ·vo decreases with the decrease in the relative yield stress index, and at p=p0 the value becomes one-tenth of that in the NC region as schematically shown in Fig. 9. The values of the principal soil parameters both for the Pleistocene clays and sand gravel layers are summarized in Table 1. RESULTS AND DISCUSSIONS. Performance of Excess Pore Water Pressure Calculated distribution of excess pore water pressure is shown in Fig. 10. As shown in Fig. 10(a), at the completion of the 1st reclamation (1800 days from the start of reclamation), little amount of excess pore water pressure remains in the Holocene clay layer because of the eŠect of sand drains. In contrast, a large amount of excess pore water pressure remains not only in the clay layers but also in the permeable sand gravel layers in the Pleistocene deposits. In particular, more than 200 kPa of excess pore water pressure is kept in the middle Pleistocene clay layers, Ma10 and Ma9 as well as sand gravel layers, Ds6 and Ds7. It should also be noted that excess pore water pressure propagates through the sand gravel layers outward from the loaded area even at the completion of reclama-.
(9) NUMERICAL ANALYSIS OF MARINE FOUNDATIONS. Fig. 10.. 1123. Contours of the calculated distribution of excess pore water pressure. tion. A remarkable decrease in eŠective stress hence takes place in the foundation where there is no reclamation load at the time. Here, due attention should be paid to the fact that a slight propagation of excess pore water pressure takes place in Ds6 and Ds7 because the very low permeability of these sand gravel layers functions to obstruct the su‹cient propagation of excess pore water pressure. On the contrary, in the upper and lower Pleistocene deposits where the permeability of sand gravel layers is better than Ds6 and Ds7, a serious propagation of excess pore water pressure can be seen. The propagation of excess pore water pressure in the Pleistocene sand gravel layers of the KIX foundations is associated with the insu‹cient dissipation of excess pore water pressure in these layers. The phenomenon is caused by insu‹cient. capability of permeability in the Pleistocene sand gravel layers with insu‹cient thickness for the full dissipation of excess pore water pressure due to the vastness of the reclamation load. In fact, almost full dissipation is achieved without any signiˆcant propagation of excess pore water pressure both in Ds1 and Ds10, both of which have su‹cient thickness and permeability. With the lapse of time, the excess pore water pressure in the upper Pleistocene clay layers such as Ma12 and 11 monotonically dissipates, whereas it remains unchanged in the middle Pleistocene layers ( see Fig. 10(b)). As is explained in the previous section, low values of the coe‹cient of permeability are set for Ds6 and Ds7 because they are thin, have poorly consistency and are rich in ˆne contents. This low permeability of Ds6 and Ds7 causes the.
(10) 1124. MIMURA AND JEON. Fig. 11. Calculated distribution of the excess pore water pressure with depth at the monitoring point 1. remarkable undissipated excess pore water pressure in those layers. It is noteworthy in Fig. 10(c) that the excess pore water pressure in those layers is found not to dissipate even before the construction of the 2nd phase island (after 4800 days since the start of reclamation). It clearly means that the primary consolidation in terms of the process of excess pore water pressure dissipation was not completed in the Pleistocene deposits before the construction of the 2nd phase island. The distribution of the excess pore water pressure with depth at the monitoring point 1 that is located at the center of the 1st phase island ( see Figs. 3, 4) is shown in Fig. 11. Here, the solid line, dotted line and thin solid line denote the distribution at the completion of the reclamation of the 1st phase island, after 3650 days and after 4800 days (before the start of reclamation of the 2nd phase island) respectively. Because the upper Pleistocene clays such as Ma12 and Ma11 have undergone plastic yielding due to reclaimed load, a large amount of excess pore water pressure generates at the completion of reclamation of the 1st phase island. Then, it dissipates steadily because of the high permeability of the sand gravel layers, Ds1and Ds3 above and below Ma12. Since Ma11 is relatively silty with high permeability, and is divided into 2 layers by the sand intrusion, not only is the generated excess pore water pressure not so large compared to Ma12, but it dissipates faster with time. On the other hand, the mode of excess pore water pressure in the middle Pleistocene layers is diŠerent. Because of the poor quality of mass permeability of the sand gravel layers (Ds6, 7), Ma10, 9 and Doc5 and Ma8 behave as if they are one continuous clay layer. Here, Ds6 and 7 do not seem to function as permeable layers at all. The rate of excess pore water pressure dissipation is very low in those layers, which results in that a large amount of undissipated excess pore water pressure remains in the middle Pleisto-. Fig. 12.. Stress condition with depth at the monitoring point 1. cene layers for a long time. The calculated performance provides that even before the construction of the 2nd phase island, more than 200 kPa of excess pore water pressure remains. In the lower Pleistocene layers such as Ma7, Ma6, the generated excess pore water pressure is not so large compared to the other layers and dissipates faster with time because of the high permeability of the thick sand gravel layer, Ds10 situated below Ma6. The stress condition with depth at the monitoring point 1 is shown in Fig. 12. In Fig. 12(a), p0 denotes the initial vertical eŠective stress, pc is the consolidation yield stress, pf means the ˆnal total vertical stress due to the reclamation of the 1st phase island and p? denotes the eŠective vertical stress at the completion of the reclamation of the 1st phase island. The hatched area exhibits the undissipated excess pore water pressure. The eŠective stresses already surpass pc for the Pleistocene clay layers above Ma10, while those still remain below pc for the middle to lower Pleistocene clay layers such as Ma10, 9, Doc5 and Ma8. Then, the upper Pleistocene clay layers behave as.
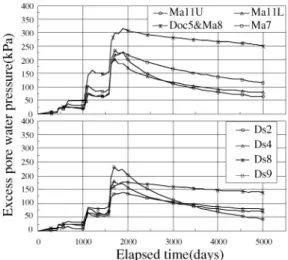
(11) NUMERICAL ANALYSIS OF MARINE FOUNDATIONS. Fig. 13. Comparison of the calculated and measured excess pore water pressure distribution with depth at the monitoring point 1. normally consolidated and the middle to lower Pleistocene clay layers behave as overconsolidated at the completion of the reclamation of the 1st phase island. It is interesting that the stress condition of the airport foundations is not so diŠerent even before the start of the reclamation of the 2nd phase island as shown in Fig. 12(b). It is true that the excess pore water pressure at the upper Pleistocene layers is almost dissipated before the construction of the 2nd phase island, but the one at the middle Pleistocene clay layers scarcely dissipates during the period. The one reason of this behavior is that the mass permeability of permeable sand gravel layers, such as Ds6 and 7 is insu‹cient to promote dissipation of excess pore water pressure and another is that the rate of consolidation for those layers becomes lower because the consolidation coe‹cients, cv for Ma10 become much lower due to plastic yielding. From the results shown in Fig. 12, the advance in settlement due to consolidation for the middle Pleistocene clay layers is not expected in this period. At the monitoring point 1, the excess pore water pressure has been measured at various layers. The calculated performance can be validated by comparing it with the measured data. Figure 13 shows the comparison of the excess pore water pressure distribution with depth. The calculated values were compared with the measured values at three diŠerent times. The solid line and , the dotted line and #, thin solid line and are the calculated and measured results at the completion of the reclamation of the 1st phase island, after 3650 days and after 4800 days (before the start of the construction of the 2nd phase island) respectively. Although the calculated performance at the completion of the reclamation of the 1st phase island slightly underestimates the measured excess pore water pressure at the layers such as Ma12, 9 and 7,. 1125. the overall mode of distribution can well be described. With the lapse of time, the discrepancy between the calculated and measured results decreases and both show a good match at after 3650 days from the start of reclamation as well as at after 4800 days (before the start of the reclamation of the 2nd phase island). Long-term behavior of the excess pore water pressure in the Pleistocene deposits is found to be simulated with the present analyses. Calculated excess pore water pressure-time relations are shown in Fig. 14(a) together with the measured results for the individual Pleistocene clay layers. Note that the comparison is shown for the Pleistocene clay layers where the pore pressure cells have survived. For the selected Pleistocene clay layers, the process of generation and dissipation of excess pore water pressure is well described by the present numerical procedure. Calculated excess pore water pressure-time relations are shown in Fig. 14(b) together with the measured results for the individual Pleistocene sand gravel layers. It is clear that little excess pore water pressure is generated in Ds1 and Ds10, whereas a large amount of excess pore water pressure is generated and kept undissipated in the middle Pleistocene sand gravel layers, such as Ds6 and Ds7. The phenomenon of undissipation in Ds6 and Ds7 causes the delay of consolidation for Ma10 and Ma9 associated with undissipation of excess pore water pressure ( see Fig. 14(a)). This diŠerence re‰ects the mass permeability of the Pleistocene sand gravel layers remarkably well. The calculated performance can well predict the actual behavior of excess pore water pressure in the all the Pleistocene sand gravel layers. Figure 14(c) shows the calculated performance of the excess pore water pressure of the Pleistocene clay and sand gravel layers where there is no measured information due to damage of the pressure cells. As seen from Figs. 14, the behavior of excess water pressure can be well predicted by the proposed procedure. It is hence conˆrmed that the adopted procedure in terms of elasto-viscoplastic ˆnite element analysis associated with a compression modeling works well to assess the stress condition of the reclaimed Pleistocene deposits at KIX.. Settlement The calculated and measured settlement-time relations for the individual Pleistocene clay layers are shown in Fig. 15. As seen from Fig. 11, the excess pore water pressure in the upper Pleistocene layers from Dtc to Ds5 has steadily dissipated with time. This steady dissipation has resulted in the remarkable advance in the compression of the Dtc, Ma12 and 11 clay layers, in particular. On the other hand, in the middle and lower Pleistocene layers such as Ma10 to Ds10, the rate of dissipation of excess pore water pressure is much lower than in the upper Pleistocene layers ( see Fig. 14) because of the poor permeability of the sand gravel layers in this region. It means that the primary consolidation associated with the dissipation of excess pore water pressure is not predominant in the middle to lower Pleistocene clay layers. Delayed compression, however, occurs during the.
(12) 1126. MIMURA AND JEON. Fig. 14(c). Calculated performance of excess pore water pressure with time for the Pleistocene clay layers. Fig. 14(a). Comparison of measured and calculated excess pore water pressure with time for the Pleistocene clay layers. Fig. 15. Comparison of measured and predicted settlement in the Pleistocene clay layers. Fig. 14(b). Comparison of measured and calculated excess pore water pressure with time for the Pleistocene sand gravel layers. process of excess pore water pressure dissipation under the condition of insu‹cient advance in primary consolidation. In all the Pleistocene clay layers in the KIX foundation ground, considerable time dependent compression.
(13) NUMERICAL ANALYSIS OF MARINE FOUNDATIONS. has hence continued with insu‹cient dissipation of excess pore water pressure. The comparison between the calculated and measured settlement is also shown to conˆrm the validity of the proposed procedure in Fig. 15. In the upper Pleistocene clay layers such as Dtc, Ma12 and 11, the clays undergo plastic yielding due to the reclamation load in a short time because of their relatively small initial stresses, po. Because the stress surpasses pc so rapidly due to the reclamation load, the time dependent behavior in the overconsolidated region can be ruled out, and then as a typical behavior for normally consolidated clay, the hyperbolic shape for settlement—time relations—is exhibited for Dtc, Ma12 and 11. The calculated performance can well describe the whole process of compression. On the contrary, in the middle Pleistocene clay layers such as Ma10, 9 and Doc5 and Ma8, the stress remains within pc at the completion of the reclamation of the 1st phase island. However, as shown in Fig. 12, it takes a long time for these layers to become gradually normally consolidated by undergoing plastic yielding due to the dissipation of excess pore water pressure. During this process, time dependent compression takes place with the insu‹cient dissipation of excess pore water pressure. The calculated performance can also well describe the whole process of deformation. In the lower Pleistocene clay layers such as Ma7 and 6, the mode of settlement with time is hyperbolic because of the su‹cient permeability of Ds10. DiŠerent from the case for the middle Pleistocene clay layers, the dissipation of excess pore water pressure has advanced steadily with time. The calculated performance can well describe the measured settlement of Ma7 and 6. CONCLUSIONS The time dependent behavior of the reclaimed Pleistocene deposits of KIX due to the construction of the 1st phase island was numerically evaluated using the elastoviscoplastic ˆnite element method in which a compression model for the quasi-overconsolidated Pleistocene clays and the concept of mass permeability for the sand gravel deposits have been implemented. Because of the existence of the poorly permeable sand gravel layers in the Pleistocene deposits, excess pore water pressure does not dissipate well. The packed excess pore water pressure propagates through the Pleistocene sand gravel layers horizontally. The eŠect of the propagation of excess pore water pressure on the adjacent foundation ground should be considered to assess the control and maintenance of the oŠshore twin-islands airport in future. Due to large reclamation load up to about 430 kPa, the upper Pleistocene clay layers underwent the plastic yielding in a short time, the excess pore water pressure however dissipated steadily in these layers because of the existence of highly permeable sand gravel layers (Ds1 and 3) in the vicinity. The state of stresses of the middle Pleistocene clays remains in the overconsolidated region at the completion of the construction of the 1st phase island. Due to the in-. 1127. su‹cient dissipation of pore water pressure caused by the poor permeability of sand gravel layers in this region, it takes a long time for middle Pleistocene clays to become normally consolidated with dissipation of excess pore water pressure. The time dependent compression hence takes place without the remarkable dissipation of pore water pressure in the middle Pleistocene clay layers. In the lower Pleistocene clay layers such as Ma7 and 6, high permeability of Ds10 overlain by Ma6 promotes the dissipation of excess pore water pressure in the clay layers. The calculated performance for excess pore water pressure in the Pleistocene deposits is found to well describe the in-situ measured results by introducing the concept of mass permeability of the sand gravel layers together with the structural eŠect for the Pleistocene clays. Long-term settlement is the biggest cause for concern. The highly developed structure of the quasi-overconsolidated Pleistocene clays in Osaka Bay has large room for compression. The authors have adopted the compression model for quasi-overconsolidated Pleistocene clays which was found to be versatile to explain the long-term settlement taken place in the Pleistocene clay deposits in Osaka Port. It is found that the numerical analyses with the adopted procedure in terms of the elasto-viscoplastic ˆnite element method functions well to explain the high compressibility associated with insu‹cient dissipation of excess pore water pressure that has taken place in the Pleistocene clays of the foundation of Kansai International Airport. The calculated performance can quantitatively describe the time-compression relations for the upper Pleistocene clay layers, such as Dtc, Ma12 and Ma11, that underwent plastic yielding due to the reclamation load. It is natural that the behavior of these clay layers can well be described with the applied constitutive model that was originally developed for normally consolidated clays. It is also found that the calculated results can predict the settlement with time for Ma10, 9 and Doc5 and Ma8, which remain in quasi-overconsolidated region even after the completion of reclamation. The behavior of long-term settlement of the lower Pleistocene clays, such as Ma7 and Ma6, is similar to the one for the upper Pleistocene clays because of the advance in consolidation due to high permeability of Ds10. Then, it can be summarized that the calculated performance can well describe the compression of the Pleistocene clay layers together with the generation/dissipation process of excess pore water pressure in the permeable Pleistocene sand gravel as well as the Pleistocene clay layers. It is noteworthy that the proposed procedure with the elasto-viscoplastic ˆnite element method supported by the compression model for quasi-overconsolidated Pleistocene clays and the concept of ``mass permeability'' for the Pleistocene sand gravel layers is versatile and capable of explaining the high compressibility associated with the insu‹cient dissipation of excess pore water pressure that has taken place in the Pleistocene clays of the foundation of Kansai International Airport..
(14) 1128. MIMURA AND JEON. ACKNOWLEDGMENTS The authors would like to express their sincere gratitude to the o‹cers of Kansai International Airport Co. Ltd. for their support in providing information, in-situ measured data and technical advice. Thanks is also extended to the technical staŠ of the Geo-Research Institute for their earnest cooperation. REFERENCES 1) Akai, K. and Sano, I. (1981): Long-term consolidation of Osaka upper diluvial clay, Tsuchi-To-Kiso, 29(3), 43–47 (in Japanese). 2) Akai, K. and Tamura, T. (1976): An application of nonlinear stress-strain relations to multi-dimensional consolidation problems, Annuals DPRI, Kyoto University, 21(B-2), 19–35 (in Japanese). 3) Akai, K. and Tanaka, Y. (1999): Settlement behaviour of an oŠshore Airport KIA, Proc. 12th ECSMGE, 2, 1041–1046. 4) Calladaine, C. R. (1971): A microstructural view of the mechanical properties of saturated clay, Geotechnique, 15(4), 345–415. 5) Christian, J. T. (1968): Undrained stress distribution by numerical method. Journal of Soil Mech. and Foundation Div., ASCE, 94(SM6), 1333–1345. 6) Ishii, I., Ogawa, F. and Zen, K. (1984): Engineering properties of marine clays in Osaka Bay (Part 2) physical properties, consolidation characteristics and permeability, Technical Note of the Port and Harbour Resarch Institute Ministry of Transport, 498, 47–86 (in Japanese). 7) Itoh, Y., Takemura, K., Kawabata, D., Tanaka, Y. and Nakaseko, K. (2001): Quaternary tectonic warping and strata formation in the southern Osaka basin inferred from re‰ection seismic interpretation and borehole sequences, Journal of Asian Earth Science, 20, 45–58. 8) Jang, W. Y. and Mimura, M. (2005): EŠect of permeability and compressibility of sandwiched gravelly sand layers on subsequent settlement of Pleistocene deposits, Soils and Foundations, 45(6), 111–119. 9) Kansai International Co. Ltd. (2002): Committee Report on Investigation of the Behavior of the Reclamation Foundation at Kansai International Airport–2nd Phase Island (in Japanese). 10) Karube, D. (1975): Procedure and problems of non-standard triaxial test, Proc. 20th JSSMFE Symposium, 45–60 (in Japanese). 11) Kitada, N., Takemura. K., Inoue, N., Itoh, H., Masuda, F., Hayashida, A., Emura, T. and Fukuda, K. (2009): Stratigraphy of the drilling cores in Kansai International Airport (KIX18–1), Programme and Abstract, 39 Japan Association for Quaternary Research Meeting, 104–105 (in Japanese). 12) Leroueil, S., Kabbaj, M., Tavenas, F. and Bouchard, R. (1985): Stress-strain-strain rate relation for the compressibility of sensitive natural clays, Geotechnique, 35(2), 159–180. 13) Marques, M. E. S., Leroueil, S. and Almeida, M. S. S. (2004): Viscous behaviour of St-Roch-de-I'Achigan clay, Quebec, Can. Geotech. J., 41(1), 25–38. 14) Mesri, G. and Godlewski, P. M. (1977): Time and stress compressibility interrelationship, Journal of the Geotechnical Engineering Division, ASCE, 103(GT5), 417–430.. 15) Mimura, M. and Jang, W. Y. (2004): Description of time-dependent behavior of quasi-overconsolidated Osaka Pleistocene clays using elasto-viscoplastic ˆnite element analyses, Soils and Foundations, 44(4), 41–52. 16) Mimura, M. and Jang, W. Y. (2005a): Veriˆcation of the elasto-viscoplastic approach assessing the long-term deformation of the quasi-overconsolidated Pleistocene clay deposits, Soils and Foundations, 45(1), 37–49. 17) Mimura, M. and Jang, W. Y. (2005b): Long-term settlement of the Pleistocene deposits due to construction of KIA, Proceedings of the Symposium on Geotechnical Aspects of Kansai International Airport, 77–85. 18) Mimura, M., Ohshima, A., Takeda, K., Yoshikawa, M., Suwa, S. and Nagaya, J. (2001): Settlement behavior of Pleistocene deposits due to reclamation in Osaka Port, Proc. National Conf., JGS, 1007–1008 (in Japanese). 19) Mimura, M. and Sekiguchi, H. (1986): Bearing capacity and plastic ‰ow of A rate-sensitive clay under strip loading, Bulletin of DPRI, 36(2), 99–111. 20) Mimura, M., Shibata, T., Nozu, M. and Kitazawa, M. (1990): Deformation analysis of a reclaimed marine foundation subjected to land construction, Soils and Foundations, 30(4), 119–133. 21) Mimura, M., Shibata, T. and Watanabe, K. (1994): Post yield modeling of compression for Pleistocene clays and its application to ˆnite element analysis, Proc. Pre-failure Deformation of Geomaterials, 1, 517–522. 22) Mimura, M. and Sumikura, Y. (2000): Deformation and excess pore water pressure of the Pleistocene marine deposits due to oŠshore reclamation, Proc. Int. Symp. on Coastal Geotechnical Engineering in Practice, 1, 339–344. 23) Mimura, M., Takeda, K., Yamamoto, K., Fujiwara, T. and Jang, W. Y. (2003): Long-term settlement of the reclaimed quasi-overconsolidated Pleistocene clay deposits in Osaka Bay, Soils and Foundations, 43(6), 141–153. 24) Murayama, S. and Shibata, T. (1966): Flow and stress relaxation of clays, I.U.T.A.M., Symposium on Rheology and Soil Mechanics, Springer–Verlag, Grenoble, 99–129. 25) Nishigaki, M. and Imai, T. (2005): A new method for predicting three dimensional (3-D) settlement using groundwater ˆow analysis, Proceedings of the Symposium on Geotechnical Aspects of Kansai International Airport, 23–29. 26) Research Committee on Ground in Osaka Bay (2002): Ground and construction of bay area, Association of Research on Geotechnical Information in Osaka Bay, 660 (in Japanese). 27) Sekiguchi, H. (1977): Rheological characteristics of clays, Proc. 9th ICSMFE, 1, 289–292. 28) Sekiguchi, H., Nishida, Y. and Kanai, F. (1982): A Plane-strain viscoplastic constitutive model for clay, Proc. 37th Natl. Conf., JSCE, 181–182 (in Japanese). 29) Sekiguchi, H., Shibata, T., Fujimoto, A. and Yamaguchi, H. (1986): A macro-element approach to analyzing the plane-strain behaviour of soft oundation with vertical drains, Proc. 31st Symp., JSSMFE, 111–120 (in Japanese). 30) Takemura, K. and Nakaseko, K. (2005): Subsurface geology of Kansai International Airport, proceedings of the Symposium on Geotechnical Aspects of Kansai International Airport, 17–22. 31) Terzaghi, K., Peck, R. B. and Mesri, G. (1996): Soil Mechanics in Engineering Practic, 3rd ed., John Wiley and Sons, Inc. NY..
(15)
図


+7


関連したドキュメント
The inclusion of the cell shedding mechanism leads to modification of the boundary conditions employed in the model of Ward and King (199910) and it will be
We study existence of solutions with singular limits for a two-dimensional semilinear elliptic problem with exponential dominated nonlinearity and a quadratic convection non
It is suggested by our method that most of the quadratic algebras for all St¨ ackel equivalence classes of 3D second order quantum superintegrable systems on conformally flat
[11] Karsai J., On the asymptotic behaviour of solution of second order linear differential equations with small damping, Acta Math. 61
Keywords: continuous time random walk, Brownian motion, collision time, skew Young tableaux, tandem queue.. AMS 2000 Subject Classification: Primary:
Answering a question of de la Harpe and Bridson in the Kourovka Notebook, we build the explicit embeddings of the additive group of rational numbers Q in a finitely generated group
Proof.. One can choose Z such that is has contractible connected components. This simply follows from the general fact that under the assumption that the functor i : Gr // T is
Next, we prove bounds for the dimensions of p-adic MLV-spaces in Section 3, assuming results in Section 4, and make a conjecture about a special element in the motivic Galois group
