Model for Computational and Predictive Analysis of Dried Length during Initial Air-Drying of Wet Clay Products
Chukwuka I. Nwoye1* and Ihuoma E. Mbuka2
*1 Department of Materials and Metallurgical Engineering, Nnamdi Azikiwe University, Awka, Nigeria.
2 Department of Materials and Metallurgical Engineering, Federal University of Technology. Owerri, Nigeria.
Abstract: A model for computational and predictive analysis of dried length during initial air-drying of wet clay products has been derived. Three clay types were mined, sorted, prepared, molded into shape and dried in air to reduce the moisture content. Initial and dried lengths measured were used for calculating the resultant fractional volume shrinkage (using conventional equation). Values of the fractional linear shrinkage (due to drying) were used for calculating the fractional volume shrinkage. The derived model;
L1 = L [- γ3+3γ2 -3γ + 1]1/3
was found to be made up of three parameters, initial length, L dried length L1 and fractional linear shrinkage γ. The model-predicted dried length L1 was found to depend on the values of the initial length and fractional linear shrinkage. The validity of the model was found to be rooted directly on the expression (L1/L) 3 = [- γ3+3γ2 -3γ + 1]
where both sides of the expression are correspondingly almost equal to 0.8. The maximum deviation of the model- predicted dried length L1 from the corresponding experimental values is less than 2% which is within the acceptable range of deviation limit for experimental results. It was also found that the cube of the ratio of dried length to initial length is equal to 1-fractional volume shrinkage due to drying. [Academia Arena, 2010;2(7):1-6] (ISSN 1553- 992X).
Keywords: Model, Computational and Predictive Analysis, Dried Length, Clay.
1. Introduction
Several studies (Barsoum,1997; Viewey and Larrly,1978;Keey, 1978) carried out on shrinkage of clay during drying indicate that porosity influences the swelling and shrinkage behaviour of clay products of different geometry. Reed (1988) has shown that firing proceed in three stages; preliminary reactions which include binder burnout, elimination of gaseous product of decomposition and oxidation, sintering as well as cooling which may include thermal and chemical annealing.. It has been reported (Reed, 1988) that drying occurs in three stages;
increasing rate, constant and decreasing rate. He pointed out that during the increasing rate;
evaporation rate is higher than evaporating surface hence more water is lost. At constant rate, the evaporation rate and evaporation surface are constant.
The researcher posited that shrinkage occurs at this stage. Keey (1978) also in a similar study suggested that at this stage, free water is removed between the particles and the inter-particle separation decreases, resulting in shrinkage. During the decreasing rate, particles make contacts as water is removed, which causes shrinkage to cease.
Model for calculating the volume shrinkage resulting from the initial air-drying of wet clay has been derived by Nwoye (2008). The model;
θ = 3–3γ2 +3 (1) calculates the volume shrinkage when the value of dried shrinkage , experienced during air-drying of wet clays is known. The model was found to be third- order polynomial in nature. Olokoro clay was found to have the highest shrinkage during the air drying condition, followed by Ukpor clay while Otamiri clay has the lowest shrinkage. Volume shrinkage was discovered to increase with increase in dried shrinkage until maximum volume shrinkage was reached, hence a direct relationship.
Nwoye et al. (2008) derived a model for the evaluation of overall volume shrinkage in molded clay products (from initial air-drying stage to completion of firing at a temperature of 12000C). It was observed that the overall volume shrinkage values predicted by the model were in agreement with those calculated using conventional equations.
The model;
ST = 3+3-3(2+γ2)+3(+) (2)
http://www.sciencepub.net/academia [email protected]1
http://www.sciencepub.net/academia [email protected]2
depends on direct values of the dried and fired shrinkage for its precision. Overall volume shrinkage was found to increase with increase in dried and fired shrinkages until overall volume shrinkage reaches maximum.
Nwoye (2009a) derived a model for calculating the quantity of water lost by evaporation during oven drying of clay at 900C. The model;
γ = exp[(lnt)1.0638- 2.9206] (3) indicated that the quantity of evaporated water, γ during the drying process is dependent on the drying time t, the evaporating surface being constant. The validity of the model was found to be rooted in the expression (Logβ + lnγ)N = lnt.
Model for predictive analysis of the quantity of water evaporated during the primary-stage processing of a bioceramic material sourced from kaolin has
been derived by Nwoye (2009b). The model;
indicates that the quantity of evaporated water during the drying process is dependent on the drying temperature, the evaporating surface being constant.
The validity of the model is rooted in the expression (lnE x Log β)N = Log T since both sides of the expression are correspondingly approximately equal to 2. The respective deviation of the model-predicted quantity of evaporated water from the corresponding experimental value is less than 20% which is quite within the acceptable deviation range of experimental results, hence depicting the usefulness of the model.
Water evaporation per unit rise in the drying temperature evaluated from experimental and model- predicted results are 0.078 and 0.0502g/0C respectively, indicating proximate agreement. The present work is to derive a model for mathematical analysis and predicting of the shrinkage-induced final length of fired clay products.
α = e(lnt/2.1992) (4) shows that the quantity of water α, evaporated at 1100C, during the drying process is also dependent on the drying time t, where the evaporating surface is constant. It was found that the validity of the model is rooted on the expression (lnt/lnα)N = Logβ where both sides of the expression are correspondingly approximately equal to 3. The respective deviation of the model-predicted quantity of evaporated water from the corresponding experimental value was found to be less than 22% which is quite within the acceptable deviation range of experimental results.
Model for quantifying the extent and magnitude of water evaporated during time dependent drying of clay has been derived (Nwoye et al.,2009). The model;
γ = exp((lnt/2.9206)1.4) (5)
indicates that the quantity of evaporated water γ during the drying process (at 900C) is dependent on the drying time, t the evaporating surface being constant. It was found that the validity of the model is rooted in the expression lnγ = (lnt/Logβ)N where both sides of the expression are correspondingly almost equal.
Nwoye and Mbuka (2009) derived a model for prediction of the quantity of absorbed water in clay materials exposed to hot-humid environment. These clay materials were prepared using different grain sizes; <100μm, 100-300μm, 300-1000 μm and their
respective mixtures. The derived model; θ = 3–3γ2 +3 (8) γ
β = α (S)0.995 (6) was found to be dependent on the bulk density,
apparent porosity and the shrinkage sustained on the clay body at any point in time under the hot-humid condition. The validity of the model is rooted on the expression; S = (γ/αβ)1.005 where both sides of the expression are correspondingly almost equal. The maximum deviation of the model-predicted quantity of absorbed water from the corresponding experimental values is 8% which is within the acceptable range of deviation limit for experimental results.
Nwoye [10] derived a model for predicting the quantity of water evaporated during drying of clay at a temperature range 80-1100C. The model;
E= exp[0.3424(LogT)2.3529] (7)
2. Materials and Methods
Experimental processes and the respective methodologies involving the clay preparation, molding and drying are detailed in previous report (Nwoye,2008). The volume shrinkages based on length were evaluated using the conventional equation (Cooke,1988) while volume shrinkages based on dried shrinkage were evaluated using model from Nwoye (2008).
2. 1 Model Formulation
Results of the experiment previously carried out (Nwoye,2008) were used for the model derivation.
VD = 1- 1 - L– L1 3 (9)
L
http://www.sciencepub.net/academia [email protected]3
Studies carried out on equation (8) (Nwoye,2008) and the conventional equation (Cooke,1988) in equation (9) indicates that;
VD = θ (10) Results from equation (10) as shown in Tables 1, 2 and 3 indicate that;
1- 1- L– L1 3 = γ3–3γ2 +3γ (11) Table 1: Variation of shrinkages with initial and dried lengths (Olokoro Clay)
L Where
L1 = Dried length of sample after air-drying (mm)
VD = Fractional volume shrinkage due to drying And
θ = Fractional volume shrinkage in terms of dried shrinkage during drying (just before firing)
γ =Fractional linear shrinkage during drying (just firing)
1- 1- L– L1 3 = γ3–3γ2 +3γ (12)
L
- 1- L– L1 3 = γ3–3γ2 +3γ - 1 (13)
L
1- L– L1 3 = - [γ3–3γ2 +3γ - 1] (14)
L
1- L– L1 3 = - γ3+3γ2 -3γ + 1 (15)
L
1- L– L1 = [- γ3+3γ2 -3γ + 1]1/3 (16)
L1
- L– L1 = [- γ3+3γ2 -3γ + 1]1/3 - 1 (17)
L
L1 – L = [- γ3+3γ2 -3γ + 1]1/3 - 1 (18)
L
L1 – L = [- γ3+3γ2 -3γ + 1]1/3 - 1 (19)
L L
L1 – 1 = [- γ3+3γ2 -3γ + 1]1/3 - 1 (20)
L
L1 = [- γ3+3γ2 -3γ + 1]1/3 (21)
L
L1 = L [- γ3+3γ2 -3γ + 1]1/3 (22)
Equation (22) is the derived model.
L(exp) L1(exp) (γ) θ = VD
70 70 70 70 70
64.40 64.52 64.63 64.38 64.49
0.0660 0.0662 0.0660 0.0658 0.0648
0.1852 0.1857 0.1852 0.1847 0.1821
Table 2: Variation of shrinkages with initial and dried lengths (Ukpor Clay)
L(exp) L1(exp) (γ) θ = VD
70 70 70 70 70
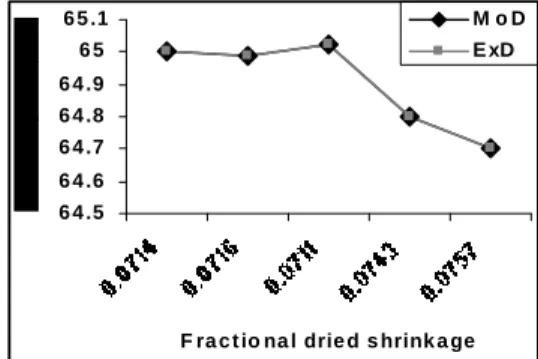
65.00 64.99 65.02 64.80 64.70
0.0714 0.0716 0.0711 0.0743 0.0757
0.1993 0.1998 0.1985 0.2067 0.2103
Table 3: Variation of shrinkages with initial and dried lengths (Otamiri Clay)
L(exp) L1(exp) (γ) θ = VD
70 70 70 70 70
65.80 65.08 65.60 65.99 65.82
0.0600 0.0617 0.0629 0.0673 0.0697
0.1694 0.1739 0.1771 0.1886 0.1946 3. Boundary and initial conditions
Consider a rectangular shaped clay product of length 70mm and width 30mm, exposed to air for drying, while it was in wet condition and thereafter fired to a temperature of 12000C. Initially atmospheric levels of oxygen are assumed. Atmospheric pressure was assumed to be acting on the clay samples during air-drying and firing. The grain size of clay particles used is 100µm, and air-drying duration; 48hours.
The boundary conditions were therefore the atmospheric levels of oxygen at the top and bottom of the clay samples, since they were dried under the atmospheric condition. No external force due to compression or tension was applied to the drying and fired clays. Clay products were air-dried during which shrinkage sets in.
Dried linear shrinkage was assumed to be dried shrinkage.
The sides of the particles and the rectangular shaped clay products were taken to be symmetries.
http://www.sciencepub.net/academia 4. Model validation
5. Results and Discussion In order to establish the validity and precision of
the derived model, clay samples from three clay deposits (Olokoro, Ukpor and Otamiri) in south-eastern Nigeria were obtained, prepared and molded into rectangular shaped solids. The solids were air-dried at room temperature for 48hrs. Furthermore, the lengths L1
obtained directly from experiment were compared with L1
from the derived model and extent of deviation determined.
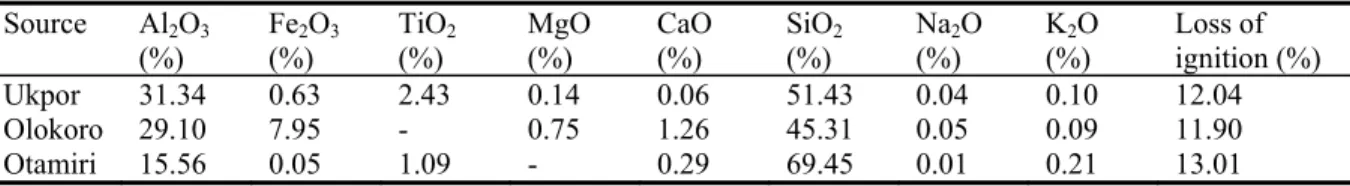
Result of chemical analysis of the clay materials used as presented in Table 4 shows variations in the Al2O3 and SiO2 content, which affected shrinkage significantly. There are unquantifiable percent concentrations of TiO2 and MgO in Olokoro and Otamiri clays respectively.
Table 4: Result of chemical analysis of clay materials used Source Al2O3
(%) Fe2O3
(%) TiO2
(%) MgO
(%) CaO
(%) SiO2
(%) Na2O
(%) K2O
(%) Loss of ignition (%)
Ukpor 31.34 0.63 2.43 0.14 0.06 51.43 0.04 0.10 12.04
Olokoro 29.10 7.95 - 0.75 1.26 45.31 0.05 0.09 11.90
Otamiri 15.56 0.05 1.09 - 0.29 69.45 0.01 0.21 13.01
Comparison of equations (8) and (22) shows that the model in equation (22) is mathematically the same as L1 = L[ (1- θ)1/3] since θ = γ3–3γ2 +3γ. It was found that on re-arranging equation (22) for the value of L1, the model becomes; L= L1 [- γ3+3γ2 -3γ + 1]-
1/3. Furthermore equation (22) shows that the ratio (L1/L)3 = - α3+3α2 -3α + 1.This invariably means that the cube of the ratio of dried length to initial length is equal to 1-fractional volume shrinkage due to drying.
The validity of the model was found to be rooted on equation (22) where (L1/L) 3 = - γ3+3γ2 -3γ + 1. Since θ = γ3–3γ2 +3γ, (L1/L)3 = - γ3+3γ2 -3γ + 1 is equivalent to (L1/L) 3 = [(1-θ)1/3]. Based on this mathematical analysis, the validity of the model directly stems on (L1/L) 3 = [(1-θ)1/3] where both sides of the expression are correspondingly almost equal to 0.8. Tables 5, 6 and 7 also agree with this equation following the values of (L1/L)3 and [(1-θ)1/3] evaluated from Tables 1, 2 and 3 as a result of corresponding computational analysis.
Table 5: Variation of (L1/L) 3 with [(1-θ)1/3] (Olokoro Clay)
6 1.6 6 3 .7 6 5 .8
F ra c t io na l drie d s hrink a ge M o D E xD
L1/ L (L1/L)3 (1-θ) 0.9200
0.9217 0.9233 0.9197 0.9213
0.7787 0.7830 0.7871 0.7779 0.7820
0.8148 0.8143 0.8148 0.8153 0.8179 Table 6: Variation of (L1/L) 3 with [(1-θ)1/3] (Ukpor Clay)
L1/ L (L1/L)3 (1-θ) 0.9286
0.9284 0.9289 0.9257 0.9243
0.8007 0.8002 0.8015 0.7933 0.7897
0.8007 0.8002 0.8015 0.7933 0.7897
Figure 1: Comparison of the dried lengths L1 as obtained from experiment (Nwoye,2009) and derived model. (Olokoro clay)
Figures 1, 2 and 3 show a comparison of the dried length L1 in relation to the fractional dried shrinkage as obtained from experiment(Nwoye,2009) and as predicted by derived model. These figures show very close alignment of the curves from model- predicted values of dried length (line MoD) and that from the corresponding experimental values (line ExD).The degree of alignment of these curves is indicative of the proximate agreement between both experimental and model-predicted dried length.
Table 7: Variation of (L1/L) 3 with [(1-θ)1/3] (Otamiri Clay)
L1/ L (L1/L)3 (1-θ) 0.9400
0.9383 0.9371 0.9427 0.9403
0.8306 0.8261 0.8229 0.8378 0.8314
0.8306 0.8261 0.8229 0.8114 0.8054
6 4 .5 6 4 .6 6 4 .7 6 4 .8 6 4 .9 6 5 6 5 .1
F ra c t io na l drie d s hrink a ge M o D E xD
Figure 2: Comparison of the dried lengths L1 as obtained from experiment (Nwoye,2009) and derived model. (Ukpor clay)
6 4 6 6 6 8
0 .0 6 0 .0 6 17 0 .0 6 2 9 0 .0 6 7 3 0 .0 6 9 7 F ra c t io na l drie d s hrink a ge
M o D E xD
Figure 3: Comparison of the dried lengths L1 as obtained from experiment (Nwoye,2009) and derived model. (Otamiri clay)
Table 8: Variation of model-predicted L1 with its associated deviation and correction factor (Olokoro Clay)
Table 9: Variation of model-predicted L1 with its associated deviation and correction factor (Ukpor Clay)
Table 10: Variation of model-predicted L1 with its associated deviation and correction factor (Otamiri Clay)
Analysis and comparison between the L1
values reveal deviations of model-predicted L1 from those of the experimental values. This is believed to be due to the fact that the surface properties of the clay and the physiochemical interactions between the clay and binder, which were expected to have played vital role during the evaporation of water were not considered during the model formulation. This necessitated the introduction of correction factor, to bring the model-predicted L1 value to that of the corresponding experimental value.
Deviation (Dv) (%) of model-predicted values of L1 from the experimental values is given by
Dv = L1M – L1exp x 100 (23) L1exp
Correction factor (Cf) is the negative of the deviation i.e
Cf = -Dv (24) Therefore
Cf = -100 L1M – L1exp (25) L1exp
Where
L1M = Model-Predicted dried length (mm) L1exp= Dried length obtained from experiment (Nwoye, 2009) (mm)
Introduction of the value of Cf from equation (25) into the model gives exactly the corresponding experimental L1 value.
Tables 8, 9 and 10 show that the maximum deviation of the model-predicted dried length L1 from the corresponding experimental values is less than 2% which is within the acceptable range of deviation limit for experimental results.
Conclusion
The model computes and predicts the dried length L1 during drying of clay. The model-predicted dried length L1 is dependent on the values of the initial length and dried shrinkage. The validity of the L1M Dv (%) Cf (%)
65.38 65.37 65.38 65.39 65.46
+1.52 +1.32 +1.16 +1.57 +1.50
-1.52 -1.32 -1.16 -1.57 -1.50
L1M Dv (%) Cf (%) 65.0012
64.9877 65.0228 64.8003 64.7022
+0.0018 -0.0035 +0.0043 +0.0005 +0.0034
-0.0018 +0.0035 -0.0043 -0.0005 -0.0034
L1M Dv (%) Cf (%) 65.8004
65.6814 65.5965 65.2895 65.1281
+0.0060 +0.0021 -0.0053 -1.0615 -1.0512
-0.0060 -0.0021 +0.0053 +1.0615 +1.0512
http://www.sciencepub.net/academia [email protected]5
http://www.sciencepub.net/academia [email protected]6
model was found to be rooted on the expression (L1/L) 3 = [- γ3+3γ2 -3γ + 1] where both sides of the expression are correspondingly almost equal to 0.8.
The maximum deviation of the model-predicted dried length L1 from the corresponding experimental values is less than 2% which is within the acceptable range of deviation limit for experimental results. The cube of the ratio of dried length to initial length is equal to 1-fractional volume shrinkage due to drying.
Correspondence to:
Dr. Chukwuka Ikechukwu Nwoye
Department of Materials and Metallurgical Engineering, Nnamdi Azikiwe University P.M.B 5025, Awka, Anambra State, Nigeria.
Cellular phone: +234 0806 800 6092 Email: [email protected]
References
[1]Reed J. Principles of Ceramic Processing, Wiley Interscience Publication, Canada 1988; 470-478.
[2]Barsoum M. Fundamentals of Ceramics. McGraw Hill Incorporated, Singapore 1997; 410
[3]Viewey F, Larrly P. Ceramic Processing Before Firing, John-Wiley and Sons, New York 1978;p3-8.
[4]Keey RB. Introduction to Industrial Drying Operations, Pergamon Press, Elmsford, New York 1978;132-157.
[5]Nwoye CI. Mathematical Model for Computational Analysis of Volume Shrinkage Resulting from I Air-Drying of Wet Clay Products.
International Research Journal of Engineering Science and Technology 2008; 5(1):82-85.
[6]Nwoye CI, Iheanacho IO, Onyemaobi OO. Model for the Evaluation of Overall Volume Shrinkage in Molded Clay Products from Initial Air-Drying Stage to Completion of Firing. International Journal of Natural & Applied Science 2008; 4(2):234-238.
[7]Nwoye CI. Model for Calculating the Quantity of Water Lost by Evaporation during
Oven Drying of Clay. Researcher Journal 2009; 1(3):
8-13.
[8]Nwoye CI, Okeke K, Obi M, Nwanyanwu U, Ofoegbu S. Model for Predictive Analysis of the Quantity of Water Evaporated during the Primary- Stage Processing of Bioceramic Material Sourced from Kaolin. Journal of Nature and Science 2009;7(4):79-84.
[9]Nwoye CI, Nwakwuo CC, Obi MC, Obasi GC, Onyemaobi OO. Model for Quantifying the Extent and Magnitude of Water Evaporated during Time Dependent Drying of Clay. New York Journal of Science 2009; 2(3):55-58.
[10]Nwoye CI and Mbuka IE. Model for Prediction of the
Quantity of Absorbed Water In Clay Materials Exposed To Hot-Humid Environment. Researcher. 2009;1(6):33-
37.
[11]Nwoye CI. Model for Predicting the Quantity of Water Evaporated during Initial Stage Drying of Wet Clay Designated for Production of Bricks. J. Min., Mat., Characterization & Eng. 2009: 8(8):647-658.
[12]Cooke T. Industrial ceramics processing. Wiley Inter Science Publication,Canada 1988;456.
5/5/2010