• 検索結果がありません。

A model for the estimation of the blast wave pressure resulting from a gas explosion has been proposed by Thomas and Williams

N/A
N/A
Protected

Academic year: 2021

シェア "A model for the estimation of the blast wave pressure resulting from a gas explosion has been proposed by Thomas and Williams"

Copied!
3
0
0

読み込み中.... (全文を見る)

全文

(1)

1. Introduction

A gas explosion is a potentially serious hazard in chemical process industries such as storage facilities for hydrogen, which is becoming a new source of clean energy for the next generation. Gas explosions occur occasionally and, when they do, they tend to be very destructive. The blast wave generated from such an explosion can cause serious damage over a considerable area. Thus, the ability to estimate blast wave pressure is a prerequisite for providing a higher degree of safety.

A model for the estimation of the blast wave pressure resulting from a gas explosion has been proposed by Thomas and Williams

1)

.This model assumes that an increase in overpressure is generated by the volume variation of gas expansion and that the propagation of the flame front behaves like an equivalent piston. This model has been adopted for use in many studies, and the validity of the model has been confirmed

2)-7)

in cases where the flame propagation velocity is much lower than the sound velocity. A recent study
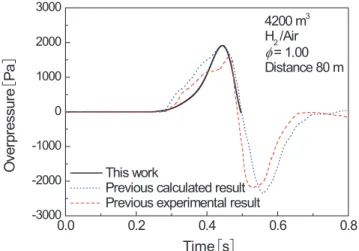
7)

also shows that this model can estimate peak overpressure quantitatively, regardless of the kind, amount, and equivalence ratio of gas mixtures, under a condition where a blast wave is not converted into a shock wave.

Although many studies have used this model, most of them focused on peak overpressure, which is one of the

parameters for blast wave pressure. However, information on not only peak overpressure but also on specific impulse̶that is the time-integral of overpressure during the positive pressure phase̶is important in providing a higher degree of safety in chemical process industries.

Therefore, in this study, the validity of the model in predicting specific impulse was investigated.

2. Blast model

When a flame propagates at a variable flame velocity ($&

%

" $' ) through an infinite uniform medium, the generated pressure (# # ) at any distance (" ) from the center of the explosion is given by the following expression

1)

,

# #! " ! ' " # %

#

!$ ! $

!$

"

" % &

%

! & " $&

%

! & "

$ &

! "

%

" &

%%

! & " $

%

&

%

! & "

$ &

%

! "

# $,

& #' ! "" !

#

(1)

where, ' , $ , &

%

, and !

#

are time, expansion ratio (unburnt gas density/burnt gas density), the flame position from the explosion center, and sound velocity of the atmosphere, respectively. In this calculation, $&

%

" $' and $ for different gas mixtures were obtained from Figure 1 and Table 1 published in a previous study

7)

. As shown in this previous study

1)

, %

#

is the density of the medium through which the sound is propagating. It should be noted that the initial density of ambient air outside of the

Estimation of impulse of blast wave by flame propagation velocities for premixed gases

Dongjoon Kim

*†

Research Institute of Science for Safety and Sustainability, National Institute of Advanced Industrial Science and Technology, 1­1­1 Higashi, Tsukuba, Ibaraki 305­8565, Japan

Phone : +81­29­861­4788

Corresponding address : blastwaves@hotmail.com

Received : October 19, 2012 Accepted : November 26, 2012

Abstract

This study investigates the impulses of blast wave generated from explosions of premixed gases using a blast model that utilizes the volume variations of a burnt gas as a pressure source. A previous study showed that the blast model can estimate peak overpressure̶regardless of the kind, amount, and equivalence ratio of a gas mixture. This study examines positive impulses, and since the calculation results of this model are in agreement with previous experimental results, it is concluded that this model can be used to estimate not only peak overpressure but also positive impulse.

Keywords : gas explosion, flame propagation, blast wave, impulse, blast model

Letter

Dongjoon Kim

50

(2)

0.00 0.01 0.02 0.03 0.04 0.05 -1500

-1000 -500 0 500 1000 1500

This work

Previous experimental result 0.125 m

3

H

2

/Air

= 1.00 Distance 2.3 m

Ov er p re ssu re[P a]

Time [s]

0.0 0.2 0.4 0.6 0.8

-3000 -2000 -1000 0 1000 2000 3000

4200 m

3

H

2

/Air

= 1.00 Distance 80 m

Ov er pr essu re [ Pa ]

Time [s]

This work

Previous calculated result Previous experimental result

gas mixture is usually given as $

!

under the condition that the flame propagation velocities are continually accelerated by the generation of turbulent flow in the flame, which results in an increase in the energy release rate

8)-10)

. However, another study

11)

shows that the flame acceleration for an experiment involving a hydrogen/air mixture of a volume of 4200 m

is not constant, but varies positively or negatively because the polyethylene balloon membrane containing the gas mixture prevented the movement of unburnt gas by a pressure wave. Therefore, in our current study $

!

is defined as the initial density outside the flame front at the moment !#

"

" !$reaches maximum.

3. Results and discussions

3.1 Comparison of blast wave histories

Figures 1 and 2 show blast wave histories for different hydrogen/air mixtures when the equivalent ratio (# ) is 1.00. The black solid line shows the calculated results obtained in this study, while the data obtained in the previous study

11),12)

as dashed and dotted lines̶the red dash line shows the experimental results, and the blue dotted line is the numerical calculation results of the previous study.

Figure 1 shows that for a small-scale experiment

11)

, both histories are in good agreement even if there is a difference of around 0.025 ms. The reason for this is considered to be that this calculation assumed that !#

"

" !$

was accelerated continuously until the flame front reached the maximum flame radius. This means that the expansion of burnt gas stops discontinuously under the assumption that the duration time when flame acceleration varies negatively would be quite shorter than the duration time when flame acceleration varies positively.

Figure 2 shows that for a big-scale experiment, neither one of the histories is in good agreement even though the impulse values appear to be similar. The reason for this is considered to be that the experimental results for the previous study were used for the average flame front radius over time

12)

. There were some directions in which

!#

"

" !$ in the horizontal direction was faster than that in

the vertical direction, with the result that the increase in pressure in the previous study was faster than that in this study.

3.2 Comparison of impulse data values

Figure 3 shows the calculated results of this study as straight lines, and the experimental results of the previous study are shown as symbols.

Figure 3 (A) shows the results for a methane/oxygen mixture of # !" ! !! . Attenuation behavior with respect to distance shows good agreement, and as the volume of the gas mixture increases, the impulses increase. It appears that the results for this model agree well with the experimental results. However, as the volume increases, the difference in the impulse values increases. Therefore, it is considered that this model cannot be used to estimate impulse in a large-volume explosion. The reason is considered that the impulses of the experimental results were attenuated due to an increase in entropy while the shock wave propagated. A previous report

13)

shows that in the case of a large-volume explosion, the blast wave is converted into a shock wave.

On the other hand, when # !! ! #! , the results of this model show good agreement with the experimental results, as shown in Figure 3 (B). The blast wave histories show that the blast wave was not converted into a shock wave

13)

.

This paper does not take into account impulse data near the explosion source because the volume of the burnt gas expands several times, thus the data are not able to define the blast wave pressure outside the burnt-gas zone.

As for different kinds of gas mixtures, the results for a hydrogen/air mixture of 0.125 m

are shown in Figure 3 (C). The results of this model agree well with the data from previous reports

11)

. It is considered that this model can estimate impulse of blast wave regardless of the equivalence ratio.

Finally, the impulse of blast wave for a large-scale experiment of 4200 m

was also estimated, as shown in Figure 3 (C). Even though only a small amount of data was collected, there is no reason to assume that this model Figure1 Comparison of blast wave histories between the

previous experimental results and the calculated result in this study for a small­scale experiment.

Figure2 Comparison of blast wave histories between the previous experimental results and the calculated result in this study for a large­scale experiment.

Sci. Tech. Energetic Materials, Vol. 74, No. 2,2013 51

(3)

1 10 100 1

10 100 0.1 1 10 100

1 10 100

(C)

4200 m

3

, φ = 1.00

φ = 0.42 φ = 0.60 φ = 1.00

0.125 m

3

Experiment

Calculation

Distance [m]

H

2

/Air 0.259 m3 0.102 m3 0.0329 m3 0.00677 m3

CH

4

/O

2

φ = 1.00

(A)

(B)

0.256 m

3

Po si tive im pul se [P a. s] CH

4

/O

2

φ = 0.60

would be inadequate for different scale experiments. It should be noted that the blast wave histories for all the data in Figure 3 (C) show that pressures rose continuously such as that of sound waves

12)

.

Looking at all the results, it is concluded that this model can be used to estimate not only peak overpressure but also positive impulse̶regardless of the kind, amount, and equivalence ratio of gas mixtures.

4. Conclusions

This study investigated the relation between positive impulse and flame front radius over time using a simple blast model. The results showed that the impulse can be estimated quantitatively using flame propagation velocities regardless of the kind or amount, under the condition that a blast wave is not converted into a shock wave, and that the equivalent ratio of gases is less than or equal to 1.00.

References

1) A. Thomas and G. T. Williams, Proc. R. Soc. A 294, 449­466 (1966).

2) B. Deshaies and J. C. Leyer, Combustion and Flame, 40, 141

­153 (1981).

3) J. C. Leyer, Combustion and Flame, 48, 251­263 (1982).

4) W. E. Baker, P. A. Cox, P. S. Westine, J. J. Kulesz, and R. A.

Strehlow, Explosion Hazards and Evaluation, 167, Elsevier, Amsterdam, Oxford, New York (1983).

5) M. S. Raju and R. A. Strehlow, Journal of Hazardous Materials, 9, 265­290 (1984).

6) J. C. Leyer, D. Desbordes, J. P. Saint-Cloud and A. Lannoy, Journal of hazardous Materials, 34, 123­150 (1993).

7) D. Kim, Sci. and Tech. Energetic Materials, 73, 20­22 (2012).

8) Y. A. Gostintsev, A. G. Istratov, and Y. V. Shulenin, Combustion, Explosion and Shock Waves, 24, 563­569 (1988).

9) A. Gaydon and H. Wolfhard, “Flames : Their Structure, Radiation and Temperature,” 4, Chapman and Hall (1979).

10) K. Mukaiyama, K. Kuwana, Journal of Loss Prevention in the Process Industries, 26, 387­391 (2013).

11) H. Shiina, D. Kim, M. Oya, and S. Fujiwara, 44

th

Combustion Symposium of Japan, 275­276, Combustion Society of Japan, Hiroshima (2006) (In Japanese).

12) V. V. Molkov, D. V. Makarov, and H. Schneider, International Journal of Hydrogen Energy, 32, 2198­2205 (2007).

13) D. Kim, S. Usuba, Y. Watanabe, T. Nario, and Y. Kakudate, Sci. and Tech. Energetic Materials, 73, 47­52 (2012).

Figure3 Comparison of impulse by this model this model and previous experimental or calculated results.

Dongjoon Kim

52

Figure 1 shows that for a small-scale experiment 11) , both histories are in good agreement even if there is a difference of around 0.025 ms

参照

関連したドキュメント

From a theoretical point of view, an advantage resulting from the addition of the diffuse area compared to the sharp interface approximation is that the system now has a

Differential equations with delayed and advanced argument (also called mixed differential equations) occur in many problems of economy, biology and physics (see for example [8, 12,

In this paper, for the first time an economic production quantity model for deteriorating items has been considered under inflation and time discounting over a stochastic time

All (4 × 4) rank one solutions of the Yang equation with rational vacuum curve with ordinary double point are gauge equivalent to the Cherednik solution.. The Cherednik and the

It is suggested by our method that most of the quadratic algebras for all St¨ ackel equivalence classes of 3D second order quantum superintegrable systems on conformally flat

The analysis presented in this article has been motivated by numerical studies obtained by the model both for the case of curve dynamics in the plane (see [8], and [10]), and for

At the same time, a new multiplicative noise removal algorithm based on fourth-order PDE model is proposed for the restoration of noisy image.. To apply the proposed model for

Here we continue this line of research and study a quasistatic frictionless contact problem for an electro-viscoelastic material, in the framework of the MTCM, when the foundation