Distribution and Sources of Organochlorine Pesticides (OCPs) in Karst Cave, Guilin, China
Annette Sylvie Muhayimana
1* , Qi Shihua
1* , Wang Yinghui
1, Kong Xiangsheng
1, Odhiambo Joshua Owago
1, Zhang Junpeng
1(1) Department of Environmental Engineering, Faculty of Environmental Studies, Key Laboratory of Bio and Environmental Geology of Ministry of Education, China University of
Geosciences, Wuhan, Hubei 430074, China
Abstract: Despite the numerous researches done on Organochlorine pesticides (OCPs) in China and in the world, information regarding emissions and concentrations of OCPs in Karst caves is extremely limited.
Karst areas have much higher ecological vulnerability and are so easy to be contaminated. This paper presents results of a monitoring program conducted in Dayan cave, Guilin, China that was designed to characterize levels, trends and sources of pesticides in soil (sediment) samples. Thirteen soil samples were collected and OCPs were analysed. Inside the cave a total concentration of OCPs (∑OCPs) detected was 29.659 ng /g with a mean value of 3.295 ng /g and ∑OCPs detected outside the cave was 74.108 ng /g with a mean value of 18.527ng/g. ∑OCPs outside the cave was higher than ∑OCPs outside the cave. The concentration of Chlordane in OCPs was highest among all the OCPs detected with range of 0.12─13.253ng/g and mean value of 3.93 ng /g. The next compound with high level of concentration was Heptachlor which ranged from Non-detected (ND) to 2.465 ng/g with a mean value of 1.4 ng/g. The pollution of OCPs in soil comparing with other countries and other areas in China was light. The analysis of Dichlorodiphenyltrichloroethane (DDT) and Hexachlorocyclohexane (HCH) isomers showed that there was fresh input of Dicofol and Lindane in the study area. By calculating the ratios of Dichlorodiphenyldichloroethane (DDD) to Dichlorodiphenyldichloroethylene (DDE), it was found that the degradation of DDT outside the cave was aerobic and the degradation of DDT inside the cave was anaerobic. [Academia Arena, 2009;1(1):47-56. ISSN 1553-992X].
Key words: Organochlorine pesticides, Karst cave, Soil, Guilin, China.
1. Introduction
Organochlorine pesticides are a group of persistent organic pollutants (POPs) which are to be eliminated or reduced on their release into the environment in many countries. Because of their persistence in the environment, and biological accumulation through the food web, OCPs can cause environmental damage, and affect human health (Colborn et al, 1996) .Due to their volatility and persistence in the air;
OCPs are subjected to long-range atmospheric transport (LRAT). Therefore, OCPs released in the tropical and subtropical environments could be dispersed rapidly through air and water, and tend to be redistributed on a global scale (Tanabe, 1991) .The origin and fate of OCPs in soils with different land use have been extensively studied in many countries. Although the usage of OCPs was phased out for decades, the elevated concentrations were still observed in many agricultural soils (Harris et al., 2000) and the relationship between sites of greatest application and current residue levels was found strong (Shivaramaiah et al., 2002). The release of OCPs from soils continues to be a source of OCPs pollution to the environment (Meijer et al., 2001).
China is a large producer and consumer of Pesticides in the world (Rongbing et al., 2006). Large
amount of OCPs were used in past decades to sustain over population in China. HCH and DDT were
widely used in China from 1952-1983. Although their use had been discontinued in China since 1983, their
persistence has left residual amounts in the soil in many areas (Zhao Ling and Ma Yongjun, 2001). At
present the use of DDT is still allowed to control mosquitoes, particularly in the malarial transmission
zones in China (Zhang et al., 2005). Accordingly, China still produces a small amount of DDT and China
is also allowed to export DDT to other countries for the same purpose. This paper presents the current
status of OCPs residues in Dayan cave (Karst cave).
2. Materials and Methods 2.1 Study Area
Region of research was in Guilin located in Guangxi Zhuang Autonomous Region in southeast China.Guangxi province (Southeast of China). The Geographical coordinates are 25° 40' 25" North, 108°
44' 0" East and has an altitude of 150m. It is bounded to the north-east by Hunan province, to the south-east by Hezhou town and it is next to Guangdong province. It has a surface area of 27, 800 square kilometers and a population of 4.76 million.
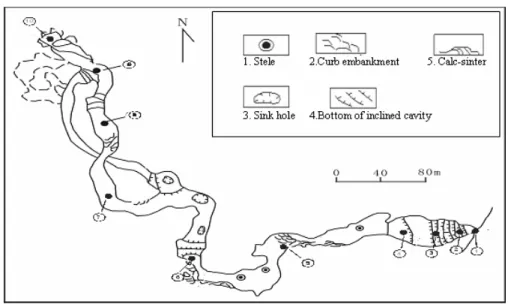
Dayan is an intermediate upper layer cave of Guilin Maomoatou cave system, located in the middle part of Guangming Mountain at right side of Taohua River in the north-west of Guilin. Guangming Mountain is a large peak cluster in Fenglin Plain, with an area of 0.92km
2, the highest peak altitude of 404.4m and the plain altitude of 151 m.The outcrop is a thick limestone layer of the Devonian system with a high intensity of Karst process. Dayan is a noncommercial karst cave located northeast to Ludiyan cave. The map of Guangxi showing Guilin and plane diagram of Dayan cave are shown in Fig 1 and Fig 2 respectively.
Gua n gx i Zh u ang Aut on o mo us Re gion
G uilin Ch ina
Fig 1: Map of Guangxi province showing Guilin
Fig 2: Map of Dayan Cave showing sampling locations (1 to 10) are sampling locations
2.2 Soil sampling
Ten sampling locations were chosen inside the cave that followed the horizontal section from the east gate as shown in Fig 2. Sampling location 1 was at the east gate (outside the cave) and the serial number was from 1 to10. Three samples (1’, 2’, and 3’) were also taken outside the east gate. Nine samples were obtained inside the cave (2 to10) and 4 samples outside the cave (1, 1’, 2’, and 3’). Sampling was done with the use of a hand shovel. The weight of each sample collected was 500g. After the collection of samples, they were kept frozen prior to the commencement of the laboratory analysis.
2.3 Analysis
2.3.1 Experimental procedures
Before analyising the samples (before experiment) all glass wares were acid washed and cleansed with distilled water before they were dried in the oven at 200
oC for about four hours. Reagents used for the experiment included: dichloromethane (DCM), hexane, acetone, sodium sulfate, alumina gel (100-200 mesh), silica gel (100-200 mesh), mesh hydrochloric acid and vitriol. Filter paper, aluminium foil, absorbent cotton and active copper were also used as materials.
Mixed standard sample of OCPs [2,4,5,6-tetrachloro-m-xylene (TCMX) and decachlorobiphenyl (PCB 209)] were used as surrogate standards and were added to all the samples before the extraction. The whole process of pretreatment was based on US EPA SW-8080A method as reference. 20 g of the sample were weighed with electronic balance and injected with the surrogate (using a syringe) before the sample was Soxhlet-extracted for 48 hours with redistilled Dichloromethane (DCM). Active copper slices were added to the conical flask containing DCM to eliminate the influence of sulphur contained in the sample.
After 48 hrs in the soxhlet extractor, the extracted samples were added with Sodium sulphate (NaSO
4) to remove unwanted water. After that, the solvents were concentrated to about 5 ml and then passed though a mixture of silica gel and alumina gel (10/3, V/V) for purification and it was rinsed by a mixture of DCM and hexane (2/3,V/V). The solvent was then condensed with high purity Nitrogen. 4 ml of the hexamethyl- benzene and PCNB (5ppb) were added as internal standards to help in quantifying the amount of OCPs present in the samples. Finally samples were stored and kept in the refrigerator until next analysis (Analysis by HP 6890 GC).
2.3.2 Analysis by HP 6890 GC
HP 6890 GC (Gas Chromatography) was equipped with a
63Ni electron capture detector and a 30 m x 0.32 mm i.d (0.25 lm film thickness) DB-5 fused silica capillary column. Nitrogen was added as a carrier gas at 1.2ml/min. the oven temperature was kept at 40
oC for 5 minutes and increased to 290
oC at a rate of 4
oC/min. Injector and detector temperatures were maintained at 250 and 300
oC respectively. 2 Microliters (µl) of each sample was injected for analysis.
2.3.3 Quality control and Quality assurance (QC/QA)
Quality control and Quality assurance was made by the use of the US EPA method in the process of the experiment. Method blanks (solvents), duplicate samples, and spiked blanks (standards spiked into solvent) were analyzed. In addition, surrogate standards were added to each of the samples to monitor procedural performance and matrix effects. The concentrations of OCPs were corrected for the recovery ratios for the surrogates. The recovery ratios for the surrogates in the samples conform to the reported ranges by US EPA. The recovery rates and standard deviation of OCPs during separation and testing are within the limiting value of the US EPA 610 method. Recovery rates of TCMX and PCB209 are 69±6%
and 76±7% respectively.
3. Results and Discussions
3.1 Concentration and distribution of OCPs
A summary of concentrations of OCPs detected in soil samples of Dayan cave is shown in Table1.
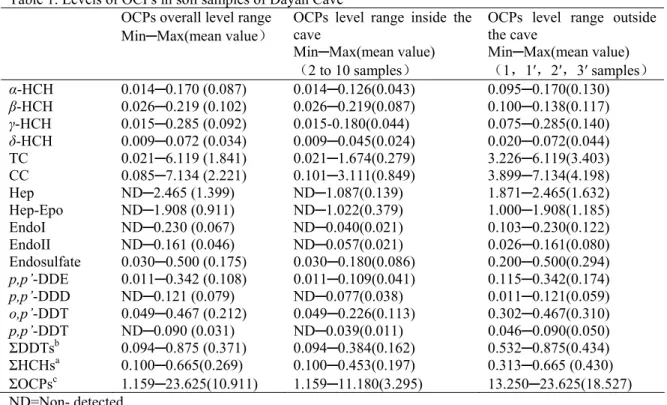
Inside the cave ∑OCPs detected was 29.659 ng /g with a mean value of 3.295 ng /g and ∑OCPs detected
outside the cave was 74.108 ng /g with a mean value of 18.527ng/g. ∑OCPs outside the cave is higher than
the total concentration outside the cave (Fig 3).
The levels of OCPs outside the cave compared to the levels inside indicated that despite the relatively closed environmental system of the cave and less human interference inside the cave, it still had OCPs contamination due to air transfer, rain water filtration and other processes, but the degree of contamination was not high.
Table 1. Levels of OCPs in soil samples of Dayan Cave OCPs overall level range
Min─Max(mean value)
OCPs level range inside the cave
Min─Max(mean value)
( 2 to 10 samples )
OCPs level range outside the cave
Min─Max(mean value)
( 1 , 1′ , 2′ , 3′ samples ) α-HCH 0.014─0.170 (0.087) 0.014─0.126(0.043) 0.095─0.170(0.130) β-HCH 0.026─0.219 (0.102) 0.026─0.219(0.087) 0.100─0.138(0.117) γ-HCH 0.015─0.285 (0.092) 0.015-0.180(0.044) 0.075─0.285(0.140) δ-HCH 0.009─0.072 (0.034) 0.009─0.045(0.024) 0.020─0.072(0.044) TC 0.021─6.119 (1.841) 0.021─1.674(0.279) 3.226─6.119(3.403) CC 0.085─7.134 (2.221) 0.101─3.111(0.849) 3.899─7.134(4.198)
Hep ND─2.465 (1.399) ND─1.087(0.139) 1.871─2.465(1.632)
Hep-Epo ND─1.908 (0.911) ND─1.022(0.379) 1.000─1.908(1.185)
EndoI ND─0.230 (0.067) ND─0.040(0.021) 0.103─0.230(0.122)
EndoII ND─0.161 (0.046) ND─0.057(0.021) 0.026─0.161(0.080)
Endosulfate 0.030─0.500 (0.175) 0.030─0.180(0.086) 0.200─0.500(0.294) p,p’-DDE 0.011─0.342 (0.108) 0.011─0.109(0.041) 0.115─0.342(0.174)
p,p’-DDD ND─0.121 (0.079) ND─0.077(0.038) 0.011─0.121(0.059)
o,p’-DDT 0.049─0.467 (0.212) 0.049─0.226(0.113) 0.302─0.467(0.310)
p,p’-DDT ND─0.090 (0.031) ND─0.039(0.011) 0.046─0.090(0.050)
ΣDDTs
b0.094─0.875 (0.371) 0.094─0.384(0.162) 0.532─0.875(0.434) ΣHCHs
a0.100─0.665(0.269) 0.100─0.453(0.197) 0.313─0.665 (0.430) ΣOCPs
c1.159─23.625(10.911) 1.159─11.180(3.295) 13.250─23.625(18.527) ND=Non- detected
ΣHCHs
a= α-HCH + β-HCH + δ-HCH + γ-HCH.
ΣDDTs
b= p, p’-DDE + p, p’-DDD + o, p’-DDT + p, p’-DDT.
ΣOCPs
c=ΣHCHs+ΣDDsT+Σother OCPs.
Σother OCPs = Heptachlor (Hep) + Heptachlor epoxide (Hep-Epo) + TC (Trans-Chlordane) + CC (Cis- Chlordane) +EndoI (α- Endosulfan) +EndoII (β-Endosulfan) +Endosulfate.
The concentration of Chlordane (TC+CC) in OCPs was highest among all the OCPs detected inside and outside the cave with a total concentration of 39.689ng/g and mean value of 9.92 ng /g inside the cave and a total concentration of 4.52 ng/g outside the cave with a mean value of 1.13 ng /g.
This is because South china have been using Chlordane to kill termites, so the high concentration of Chlordane observed may be predominantly due to the use of technical Chlordane as a termiticide in this area in previous years . In China, technical chlordane is still being extensively used against termites in buildings, with an estimated amount of over 200 tons year
−1in recent years (Xu et al., 2004).
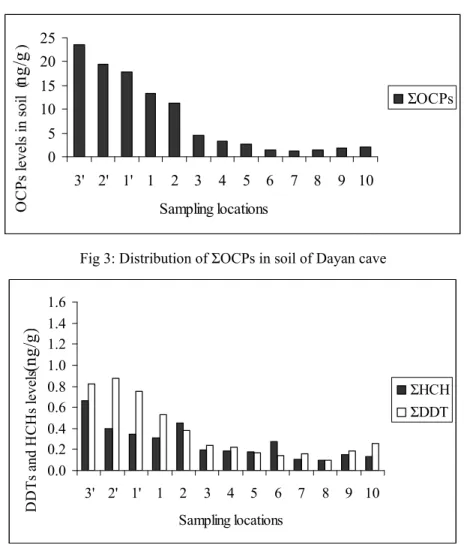
The next compounds with highest levels of concentration were Heptachlor (Hep) and Heptachlor epoxide (Hep-Epo.) Heptachlor (Hep) was also used and produced in large quantity in China. From 1967 to 1969 the amount of Heptachlor produced was 17 tons, to kill the termites and other insects in the soil. It is shown in Fig 4 that the majors parts of OCPs (HCHs and DDTs) at the cave’s innermost sampling locations 9 and 10 did not show the lowest values, but rather slightly greater than the values of sampling locations 7 and 8 at the middle of the cave. This suggests that there may be a fracture pore near the north mouth that allows some air to come in.
Fig 4 shows that the total concentration of DDTs (∑DDTs) in soil samples was higher than the
total concentration of HCHs (ΣHCHs). This trend is consistent with the previous observations on the
contamination of OCPs in soil in China (Zhou et al., 2001). A most likely explanation for the current low
concentration of HCHs in soil is due to the difference in the physicochemical and biochemical properties,
wherein HCHs have higher water solubility, vapor pressure and biodegradability, and lower lipophicility
and particle affinity compared to the DDTs (Rui et al., 2005). DDTs tend to remain in the particulate phase longer than HCHs. (Nhan et al., 2001).
In comparison with recent research reports, the concentrations of ∑DDTs and ∑HCHs measured in the study area were in the same low range with other pristine areas such as Tibet plateau where the concentration of ∑DDTs ranged from ND to 2.83 ng/g and ∑HCHs ranged from 0.18 to 5.38 ng/g (Fu et al., 2001), and European high altitude mountains that had ∑DDTs and ∑HCHs residual level in the range of 1.7-13 ng/g and 0.08-0.49 ng/g respectively (Grimalt et al., 2004).
0 5 10 15 20 25
3' 2' 1' 1 2 3 4 5 6 7 8 9 10 Sampling locations
O C P s le ve ls in s oil ( ng/ g )
ΣOCPs
Fig 3: Distribution of ΣOCPs in soil of Dayan cave
0.0 0.2 0.4 0.6 0.8 1.0 1.2 1.4 1.6
3' 2' 1' 1 2 3 4 5 6 7 8 9 10 Sampling locations
DDTs and HCHs levels
(n g/ g)
ΣHCH ΣDDT
Fig 4: Distribution of ΣHCHs and ΣDDTs in soil of Dayan cave
The average concentration outside the cave and inside the cave of ∑DDTs and ∑HCHs was lower than the average concentration of ∑DDTs and ∑HCHs in Hong Kong soils which was 0.52 ng/g and 6.19ng/g respectively (Zhang et al, 2006), and they were much lower than the average concentrations of
∑DDTs (37.6 ng/g) and ∑HCHs (12.2 ng/g) found in soils of Pearl River Delta Region (Fu et al., 2003).
Some other studies reported around China, had higher residual levels of OCPs such as Beijing (Zhu et al,
2005), Tianjin (Tao et al., 2005), Nanjing (An et al., 2005). In Europe, ΣDDTs and ΣHCHs levels were in
the range of 4.3-2400 ng/g and 0.36-110 ng/g in Poland soils (Falandysz et al., 2001). In comparison with
similar research the levels of OCPs in Guilin were low and the reason is because there are mainly rice
farms in the vicinity of Guilin city in which small amounts of OCPs were used with the rotary method of
planting rice. The existence of alternating wet and dry conditions was beneficial to the aerobic and
anaerobic degradation of OCPs, leading to a reduced amount of soil OCPs.
3.1.1 Distribution and degradation of HCH isomers
It has been widely recognized that HCH is available in two formulations: technical HCH and lindane. Technical HCH contains isomers in the following percentages: α, 55–80%; β, 5–14%; γ, 8–15%; δ, 2–16%; ε, 3–5% (Qiu et al., 2004), and Lindane contains > 90% of γ-HCH. The ratio of α- to γ-HCH has been used to identify the possible HCH source. If the source of HCH comes from fresh input of technical HCH, the ratio of α - to γ -HCH is between 3 and 7 (Yang et al., 2008). However, a lindane source will reduce the ratio to close or <1 (Willet et al., 1998). A higher ratio of α - to γ -HCH than 7 can be explained by long-range transport or re-cycling of technical HCH, because α -HCH has a longer atmospheric lifetime than γ isomer by about 25% (Willet et al., 1998). As shown in Fig 6, the ratios of α-HCH/γ-HCH in all soil sampling locations were lower than 3. Accordingly, the contamination of HCHs in this region probably came from local use of lindane and also indicated Lindane inputs in the past several years.
By analyzing the individual HCH isomers (Fig 5), it was found that β-HCH had the highest level of concentration among all the samples and it accounted from 20.03-79.13 %, especially in sample 3 to 7 where it accounted from 23-79% of the total HCHs detected. The β-HCH was higher because of its persistence in soil. The persistence of β-HCH in soils is mainly due to the higher K
ow(log K
ow=3.78) and lower vapor pressure value (3.6x10
-7mmHg, 20
oC) (Zhang et al., 2006). These will make β-HCH easier to be absorbed to the soil organic matter and less evaporative loss from soils (Mackay et al., 1997).
Furthermore, the spatial arrangement of Chlorine atoms in the molecular structure of β-HCH was supposed to be more resistant to microbial degradation in soils (Middeldorp et al., 1996).
0.0 0.1 0.2 0.3
3' 2' 1' 1 2 3 4 5 6 7 8 9 10 Sampling locations
HC H i so m er s ( ng /g )
a-HCH b-HCH g-HCH d-HCH
Fig 5: HCH isomers in soil of Dayan cave
0 0.5 1 1.5 2 2.5
3' 2' 1' 1 2 3 4 5 6 7 8 9 10 Sampling locations
a-H C H /r-H C H αHCH/γHCH
Fig 6: Ratios of α-HCH to γ-HCH in soil of Dayan cave
3.1.2 Distribution and degradation of DDT isomers
Commercial DDT generally contains 75% p,p’-DDT, 15% o,p’-DDT, 5% p,p’-DDE, <0.5% p,p’- DDD, <0.5 o,p’-DDE and <0.5% of unidentified compounds (WHO, 1979), but in Dicofol, the concentration of o,p’-DDT is more than p,p’-DDT (Qiu et al., 2005). DDTs isomers have a long persistence in the environment and their levels of concentrations in this study are shown in Fig.7. DDT can be biodegraded under aerobic conditions to DDE and under anaerobic conditions to DDD (Bossi et al., 1992).
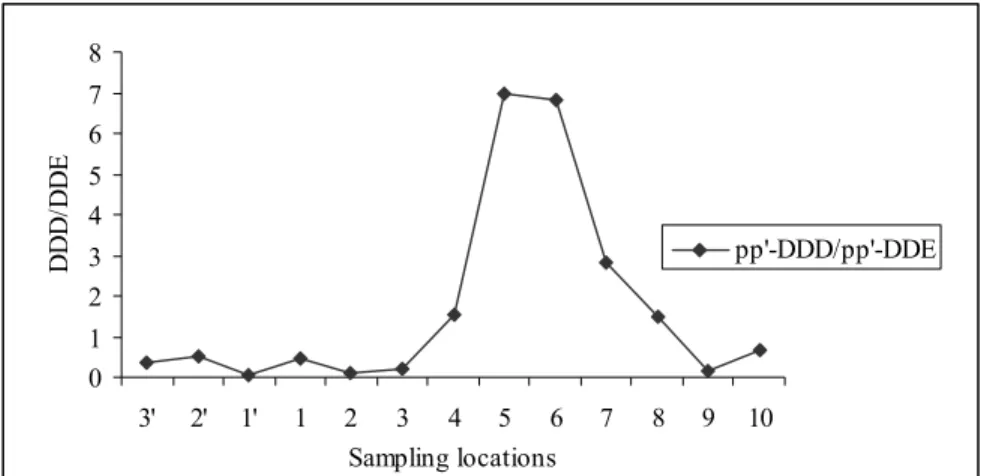
The ratio of DDD/DDE greater than 1 indicates that the soil was dominated by DDD, the product of anaerobic degradation of DDT, and the ratio lesser than 1 indicates that the soil was dominated by DDE, the product of aerobic degradation of DDT (Zhou et al., 2006). DDE and DDD Changes in the ratio of DDE and DDD to ΣDDTs has been regarded as an indication of either no or decreasing inputs to the environment. The ratio of (DDE+DDD)/ΣDDTs greater than 0.5 can be thought to be subjected to a long term weathering (Dong et al, 2002) and More o, p′-DDT than p, p′-DDT in the environment can demonstrate the Dicofol type DDT usage (Qiu et al., 2004 ).
The ratios of (DDE+DDD)/ ΣDDTs are shown in Fig.9. The ratios were in the range of 0.26-0.61 with most values being less than 0.5 (mean value is 0.4) and in Fig.7 it is shown that the concentration of o,p’-DDT was more than the concentration of p,p’-DDT as in Dicofol, this suggests that there was fresh input of Dicofol in the study area. Also, most values of DDD/DDE ratios as shown in Fig. 8 were greater than 1 inside the cave and ranged from 0.092 to 7 with an average value of 2.31, and the ratios of DDD/DDE outside the cave ranged from 0.052 to 0.53 with an average value of 0.35.
0.0 0.1 0.2 0.3 0.4 0.5
3' 2' 1' 1 2 3 4 5 6 7 8 9 10
Sampling locations
DDT isomers levers
( n g/ g)
p,p’-DDEp,p’-DDD o,p’-DDT p,p’-DDT
Fig 7: Distribution of DDT isomers in soil of Dayan Cave
The results obtained clearly indicated that DDT in soil inside and outside of the Dayan cave may be derived from Dicofol and DDT was retained under anaerobic conditions inside the cave and under aerobic condition outside the cave.
The use of Dicofol in China is mainly in the southern and eastern provinces, mostly on litchi, longan, citrus crops and cotton (Yang et al., 2008).
0 1 2 3 4 5 6 7 8
3' 2' 1' 1 2 3 4 5 6 7 8 9 10
Sampling locations
DDD/DDE
pp'-DDD/pp'-DDE
Fig 8: Ratios of DDD/DDE in soil of Dayan Cave
0.0 0.2 0.4 0.6 0.8 1.0
3' 2' 1' 1 2 3 4 5 6 7 8 9 10
Sampling locations
(DDD+DDE)/DDTs
( DDD+DDE) /ΣDDTs