INTRODUCTION
Surgical orthodontic treatment emphasizes not only the improvement of morphological and functional problems resulting from problems with mastication and articulation, but also the achievement of an aesthetic facial appearance. Predicting pretreat
ment to posttreatment changes in the soft tissue profile as accurately as possible based on an un
derstanding of the association between changes in the hard and soft tissues provides information that is essential for devising a suitable therapeutic strat
egy and selecting a surgical method. This informa
tion is also useful in explanations to patients, in
formed consent, and patient satisfaction.
There have been many studies on the associa
tion between changes in hard and soft tissues fol
lowing surgical orthodontic treatment for skeletal Class III cases.
16There has also been a compari
son of soft tissue changes in twojaw surgery ver
sus sagittal split ramus osteotomy (SSRO) alone,
1as well as a comparison of soft tissue changes in orthodontic treatment alone versus surgical ortho
dontic treatment.
2However, these studies calcu
lated distances from coordinate axes and reference lines based on fixed points on the soft tissue. There have been no studies on changes in the soft tissue thickness of the upper and lower lips. Also, while there are studies that have used materials from be
fore the initial orthodontic treatment and after com
pletion of all treatment,
2, 79as well as studies using materials from before and after the operation,
1, 35no study has compared values before the initial ortho
dontic treatment, after the initial orthodontic treat
ment and before the operation, and after comple
tion of all treatment. In addition, there have been no comparisons of soft tissue changes based on differences in mandibular plane angle.
Therefore, in the present study, we analyzed maxillofacial morphology before the initial orthodon
Changes in soft tissue structures around the lips associated with sagittal split ramus osteotomy in skeletal Class Ⅲ female patients
──Differences in mandibular plane angle──
Mika Kojo, Aki Nishiura and Naoyuki Matsumoto
Department of Orthodontics, Osaka Dental University, 8-1 Kuzuhahanazono-cho, Hirakata-shi, Osaka 573-1121, Japan
We analyzed the craniofacial morphology in 25 skeletal Class Ⅲ female patients with sagittal split ramus osteotomy (1) before the initial orthodontic treatment, (2) after the in
itial orthodontic treatment and before the operation, and (3) after completion of all teat
ment. We examined the relationship of hard and soft tissue changes with differences in mandibular plane angle. In particular, we focused on lip soft tissue changes. We classi
fied the patients based on FMA of 30 degrees or less (L group) and of 34 degrees or more (H group). Arnett analysis showed a significant change in upper lip thickness, lower lip thickness, and upper lip height between the two groups. The mandibular plane af
fected the contact relationship between the upper and lower lips, and the muscles around the lips, resulting in changes in the lip soft tissues. In planning surgical ortho
dontic treatment, we should take into consideration how the soft tissues will change de
pending on the mandibular plane angle. (J Osaka Dent Univ 2018 ; 52 : 107122)
Key words : Lip soft tissue changes ; Surgical orthodontic treatment ; Sagittal split ra
mus osteotomy ; Mandibular plane angle
tic treatment, after the initial orthodontic treatment and before the operation, and after completion of all treatment in female skeletal Class III patients who had undergone SSRO as surgical orthodontic treatment. In addition, we examined soft tissue changes, particularly changes in lip thickness, based on differences in mandibular plane angle.
We adopted the Steiner
10and Tweed
11analyses for the hard tissues, while using the Ricketts
12, 13and Arnett
14analyses for the soft tissues.
MATERIALS AND METHODS Subjects
The subjects were 25 women who were diagnosed with skeletal Class III and underwent SSRO alone as surgical orthodontic treatment at Osaka Dental University Hospital. These 25 women consisted of 15 with a mandibular plane angle (Frankfort mandi
bular plane angle ; hereafter FMA) less than or equal to 30° (hereafter the L group) and 10 women with an FMA greater than or equal to 34° (hereafter the H group). Based on analysis of frontal cephalo
grams, patients with prominent facial asymmetry (defined as a chin deviation greater than or equal to 10 mm relative to the facial midline according to Ricketts analysis) were excluded, as were patients who also underwent genioplasty. The patients had been diagnosed with skeletal Class III based on Angle Class III malocclusion and, before treatment, had an overjet less than or equal to 0 mm, demon
strated maxillary and mandibular crowding of at least −7 mm, and had their maxillary premolars extracted. Before initial orthodontic treatment, the mean ages of the L and the H groups were 24 years 8 months (between 16 years 4 months and 36 years 1 month) and 20 years 9 months (be
tween 18 years 3 months and 30 years 1 month), respectively. The mean durations of treatment in the L and the H groups were 3 years 6 months, and 4 years 4 months, respectively.
Cephalometric analysis
The materials consisted of lateral cephalograms taken before the initial orthodontic treatment, after the initial orthodontic treatment and before the op
eration, and after completion of all treatment (here
after T1, T2 and T3, respectively). All lateral cepha
lograms were traced by a single orthodontist who does cephalometric analysis daily. Hard tissue was analyzed with Steiner
10and Tweed
11analyses, while soft tissue was analyzed with Ricketts analysis E
line
12, 13and Arnett’s soft tissue cephalometric analy
sis (STCA).
14The following items were calculated.
Steiner
10and Tweed
11analyses (Fig. 1)
SNA angle : Angle formed by the SN line and the NA line
SNB angle : Angle formed by the SN line and the NB line
ANB angle : Angle formed by the NA line and the NB line
U1 to NA (mm) : Shortest distance from the edge of the maxillary central incisor to the NA line
∠U1 to NA (° ) : Angle formed by the NA line and the axis of the maxillary central incisor
L1 to NB (mm) : Shortest distance from the edge of the mandibular central incisor to the NB line
∠L1 to NB (° ) : Angle formed by the NB line and the axis of the mandibular central incisor
Interincisal angle : Angle formed by the axis of the maxillary and mandibular central incisors
Fig. 1 Steiner and Tweed analyses.
① ∠SNA (°),② ∠SNB (°),③ ∠ANB (°),④ ∠U1 to NA (mm),
⑤U1 to NA (°),⑥L1 to NB (mm),⑦∠L1 to NB (°),
⑧ ∠Interincisal (°),⑨ ∠GoGn to SN (°),⑩FMA (°).
∠GoGn to SN (° ) : Angle formed by the GoGn line and the SN line
FMA : Frankfort mandibular plane angle Ricketts analysis
12, 13(Fig. 2)
Eline : Esthetic plane drawn between Nt (tip of the nose) and Pg’ (softtissue pogonion).
Ls to Eline : Distance (mm) from labrale superior to the Eline
Li to Eline : Distance (mm) from labrale inferior to the Eline
Arnett analysis
14(Figs. 35)
A true vertical line (TVL) was drawn through the subnasale (Sn) parallel to the vertical line and per
pendicular to the natural head position.
Soft tissue structures
Upper lip thickness : Upper vermilion thickness Lower lip thickness : Lower vermilion thickness Nasolabial angle : Angle formed by the nasal base and the upper lip
Upper lip angle : Angle formed by the line connect
ing Sn, the upper lip anterior (ULA) and TVL
Fig. 2 Ricketts analysis.
①Ls to Eline,②Li to Eline.
Fig. 3 Arnett analysis (soft tissue structures).
①Upper lip thickness,②Lower lip thickness,
③Nasolabial angle,④Upper lip angle.
Fig. 4 Arnett analysis (facial lengths).
①Upper lip length,②Lower lip length,
③Mx height,④Md height.
Fig. 5 Arnett analysis (TVL projections).
①Upper lip anterior,②Mx1,③Md1,④Lower lip anterior,
⑤Soft tissue B point,⑥Soft tissue pogonion.
Facial lengths
Upper lip length : Vertical distance from the Sn to the inferior border of the upper lip
Lower lip length : Vertical distance from the supe
rior border of the lower lip to Me’ (softtissue men
ton)
Mx height : Distance from Sn to the incisal edge of the maxillary central incisor
Md height : Distance from the incisal edge of the maxillary central incisor to Me’
TVL projections
TVL projections were anteroposterior measure
ments to the TVL. The horizontal distances meas
ured from these landmarks to the TVL were given negative values when located posterior to the TVL, and positive values when located anterior.
Upper lip anterior : ULA to TVL Mx1 : Maxillary incisor tip to TVL Md1 : Mandibular incisor tip to TVL
Lower lip anterior : Most prominent point of the lower lip contour (LLA) to TVL
Soft tissue B point : B’ to TVL Soft tissue Pogonion : Pog’ to TVL
Using calculations for the items above, we deter
mined the means and standard deviations of all measurements in the L and the H groups at T1, T2 and T3. After testing for significant differences at T1, T2 and T3 using oneway ANOVA (StatPlus ; AnalystSoft, Washington, DC, USA), the Bonferroni multiple comparisons test was applied, with p<0.05 considered significant. We also compared the L and the H groups at T1, T2 and T3 to test for sig
nificant differences. Also, the mean and standard deviation were calculated for changes in all items from T1 to T2, T2 to T3, and T1 to T3. All calcu
lated values were compared between the L and H groups to test for significant differences. Spear
man’s rank correlation coefficient was done to ab
stract vertical and horizontal items in the maxillary and mandibular incisor hard tissue changes and lip soft tissue changes, and to determine the correla
tions between them. The correlation coefficients in the L and H groups were ≥ 0.52 and ≥ 0.7, respec
tively, indicating strong correlation.
15Normality was
also investigated for the significant difference tests above. For items which demonstrated normality, a t
test was performed. For items which did not dem
onstrate normality, a Wilcoxon rank sum test was performed.
RESULTS
Hard and soft tissue changes in the L and H groups (Tables 13)
Hard tissue changes were as follows. In skeletal re
lationships, there were no significant differences in SNA angle in either group at any point in time (T1, T2 or T3). Significant differences were observed in the SNB and ANB angles in both groups at all points in time. Significant differences were ob
served in the SNB and ANB angles between T2 and T3, and between T1 and T3 (SNB : T2>T3, T1>T3 ; ANB : T2<T3, T1<T3). No significant differences were observed in FMA or GoGn to SN in either group at any point in time. In dental rela
tionships, there were no significant differences in U1 to NA (mm), ∠U1 to NA, or in the interincisal angle in either group at any point in time. Signifi
cant differences were observed in L1 to NB (mm) and ∠L1 to NB (° ) in both groups at all points in time. For L1 to NB (mm), a significant difference was observed between T2 and T3 (T2>T3). For ∠ L1 to NB (° ) in the L group, significant differences were observed between T1 and T2 and between T2 and T3 (T1<T2, T2>T3). In the H group, a sig
nificant difference was observed only between T2 and T3 (T2>T3) (Table 1).
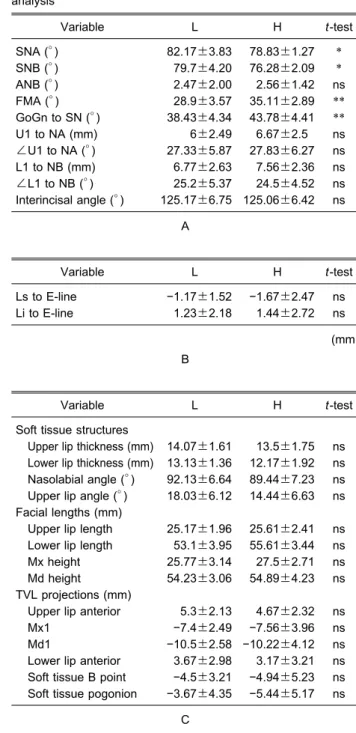
Soft tissue analysis was as follows. In Ricketts analysis, although the L group did not demonstrate significant differences in Ls to Eline at any point in time, there were significant differences in Li to E
line. Significant differences were observed between T2 and T3, and between T1 and T3 (T2>T3, T1>
T3). The H group did not demonstrate significant
differences in Ls to Eline or Li to Eline at any
point in time (Table 2). In the Arnett analysis for
soft tissue structures, the L group demonstrated
significant differences in upper lip thickness, lower
lip thickness, and upper lip angle at all points in
time. Upper lip thickness significantly differed be
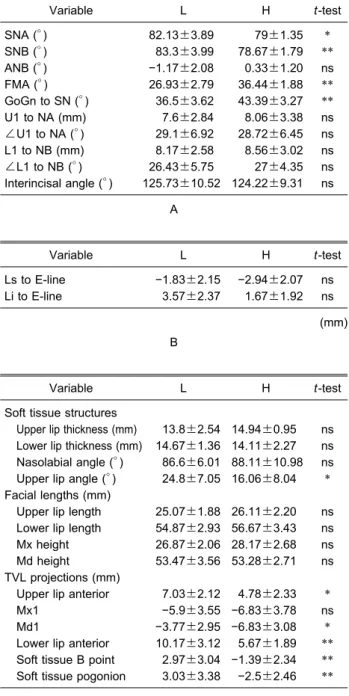
Table 1 Comparison between T1, T2 and T3 in hard tissue changes by Steiner and Tweed analyses for a) the L group, and b) the H group
Variable T1 T2 T3 ANOVA Bonferroni correction
pvalue T1 vs T2 T2 vs T3 T1 vs T3 SNA (°)
SNB (°) ANB (°) FMA (°) GoGn to SN (°) U1 to NA (mm)
∠U1 to NA (°) L1 to NB (mm)
∠L1 to NB (°) Interincisal angle (°)
82.13±3.89 83.3±3.99
−1.17±2.08 26.93±2.79 36.5±3.62 7.6±2.84 29.1±6.92 8.17±2.58 26.43±5.75 125.73±10.52
82.17±3.96 83.7±4.25
−1.53±2.09 27.13±3.58 36.1±3.70 5.43±2.19 24.93±7.04 9.2±2.10 31.83±3.33 124.76±8.11
82.17±3.83 79.7±4.20 2.47±2.00 28.9±3.57 38.43±4.34 6±2.49 27.33±5.87 6.77±2.63 25.2±5.37 125.17±6.75
ns
*
**
ns ns ns ns
*
**
ns
− ns ns
−
−
−
− ns
*
−
−
*
**
−
−
−
−
*
**
−
−
*
**
−
−
−
− ns ns
− Mean±standard deviation, ns : Not significant,−Not recorded,
*p<0.05,**p<0.01.
A
Variable T1 T2 T3 ANOVA Bonferroni correction
pvalue T1 vs T2 T2 vs T3 T1 vs T3 SNA (°)
SNB (°) ANB (°) FMA (°) GoGn to SN (°) U1 to NA (mm)
∠U1 to NA (°) L1 to NB (mm)
∠L1 to NB (°) Interincisal angle (°)
79±1.35 78.67±1.79 0.33±1.20 36.44±1.88 43.39±3.27 8.06±3.38 28.72±6.45 8.56±3.02 27±4.35 124.22±9.31
79±1.35 78.83±1.85 0.17±1.56 34.89±2.26 42.72±3.59 6.11±3.38 24.56±8.19 10.11±2.36 32.22±4.21 123±10.15
78.83±1.27 76.28±2.09 2.56±1.42 35.11±2.89 43.78±4.41 6.67±2.5 27.83±6.27
7.56±2.36 24.5±4.52 125.06±6.42
ns
*
**
ns ns ns ns
*
**
ns
− ns ns
−
−
−
− ns ns
−
−
*
**
−
−
−
−
*
**
−
−
*
**
−
−
−
− ns ns
− B
Table 2 Comparison between T1, T2 and T3 in soft tissue changes by Ricketts analysis for a) the L group, and b) the H group
Variable T1 T2 T3 ANOVA Bonferroni correction
pvalue T1 vs T2 T2 vs T3 T1 vs T3 Ls to Eline
Li to Eline
−1.83±2.15 3.57±2.37
−2.77±2.06 3.57±2.04
−1.17±1.52 1.23±2.18
ns
**
− ns
−
*
−
* (mm) A
Variable T1 T2 T3 ANOVA Bonferroni correction
pvalue T1 vs T2 T2 vs T3 T1 vs T3 Ls to Eline
Li to Eline
−2.94±2.07 1.67±1.92
−3.61±2.53 3.89±1.75
−1.67±2.47 1.44±2.72
ns ns
−
−
−
−
−
− (mm) B
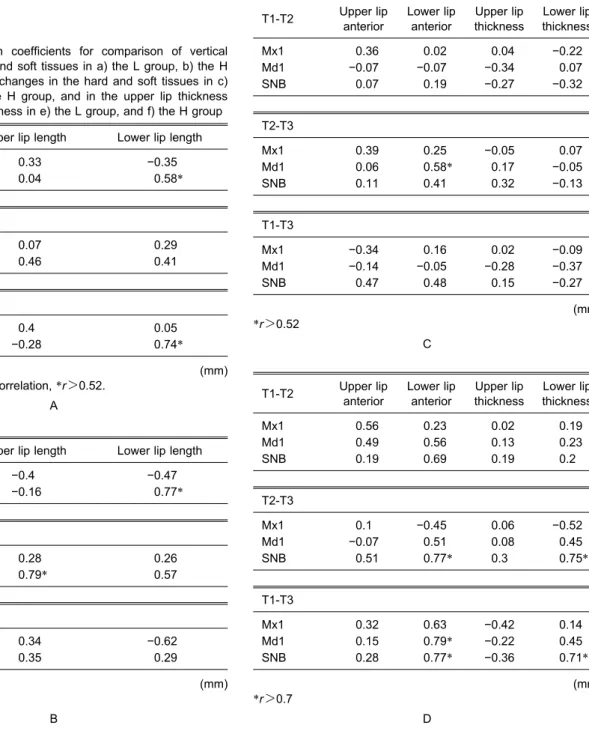
tween T2 and T3 (T2<T3), lower lip thickness sig
nificantly differed between T2 and T3, and between T1 and T3 (T2>T3, T1>T3), and upper lip angle significantly differed between T1 and T3 (T1>T3).
The H group did not demonstrate any significant differences in soft tissue structures at any point in time.
As for facial lengths, the L group demonstrated significant differences in upper lip length and lower lip length at all points in time. Upper lip length sig
nificantly differed between T1 and T2, and between T2 and T3 (T1>T2, T2<T3). Lower lip length sig
nificantly differed between T2 and T3 (T2>T3).
Significant differences in the Mx and Md heights
Table 3 Comparison between T1, T2 and T3 in soft tissue changes by Arnett analysis for a) the L group, and b) the H group
Variable T1 T2 T3 ANOVA Bonferroni correction
pvalue T1 vs T2 T2 vs T3 T1 vs T3 Soft tissue structures
Upper lip thickness (mm) Lower lip thickness (mm) Nasolabial angle (°) Upper lip angle (°) Facial lengths (mm)
Upper lip length Lower lip length Mx height Md height
TVL projections (mm) Upper lip anterior Mx1
Md1
Lower lip anterior Soft tissue B point Soft tissue pogonion
13.8±2.54 14.67±1.36 86.6±6.01 24.8±7.05 25.07±1.88 54.87±2.93 26.87±2.06 53.47±3.56 7.03±2.12
−5.9±3.55
−3.77±2.95 10.17±3.12 2.97±3.04 3.03±3.38
12.1±1.74 14.93±1.13 88.1±11.08 23.4±7.00 22.83±1.74 56.67±3.84 26±2.01 53.5±3.42 6.53±2.26
−8.03±2.67
−1.9±2.97 11±3.18 2.7±3.22 3.17±3.91
14.07±1.61 13.13±1.36 92.13±6.64 18.03±6.12 25.17±1.96 53.1±3.95 25.77±3.14 54.23±3.06 5.3±2.13
−7.4±2.49
−10.5±2.58 3.67±2.98
−4.5±3.21
−3.67±4.35
*
**
ns
*
*
* ns ns ns ns
**
**
**
**
ns ns
− ns
* ns
−
−
−
− ns ns ns ns
*
**
− ns
*
*
−
−
−
−
**
**
**
**
ns
*
−
* ns ns
−
−
−
−
**
**
**
**
A
Variable T1 T2 T3 ANOVA Bonferroni correction
pvalue T1 vs T2 T2 vs T3 T1 vs T3 Soft tissue structures
Upper lip thickness (mm) Lower lip thickness (mm) Nasolabial angle (°) Upper lip angle (°) Facial lengths (mm)
Upper lip length Lower lip length Mx height Md height
TVL projections (mm) Upper lip anterior Mx1
Md1
Lower lip anterior Soft tissue B point Soft tissue pogonion
14.94±0.95 14.11±2.27 88.11±10.98 16.06±8.04 25.07±1.88 56.67±3.43 28.17±2.68 53.28±2.71 4.78±2.33
−6.83±3.78
−6.83±3.08 5.67±1.89
−1.39±2.34
−2.5±2.46
13.17±2.45 14.22±1.56 88.06±11.09 16.17±8.53 22.83±1.74 56.33±3.74 27.83±2.84 52.56±3.34 5.11±2.84
−8.17±4.80
−4.28±3.63 8.11±2.22
−0.22±3.01
−1.39±3.25
13.5±1.75 12.17±1.92 89.44±7.23 14.44±6.63 25.17±1.96 55.61±3.44 27.5±2.71 54.89±4.23 4.67±2.32
−7.56±3.96
−10.22±4.12 3.17±3.21
−4.94±5.23
−5.44±5.17 ns ns ns ns ns ns ns ns ns ns
**
**
*
*
−
−
−
−
−
−
−
−
−
− ns ns ns ns
−
−
−
−
−
−
−
−
−
−
**
**
*
*
−
−
−
−
−
−
−
−
−
− ns ns ns ns B
were not observed at any point in time. The H group did not demonstrate significant differences in any facial length at any point in time. As for TVL projections, both groups demonstrated significant differences in Md1, lower lip anterior, soft tissue B point, and soft tissue pogonion at all points in time.
The L group demonstrated significant differences between T2 and T3 and between T1 and T3 (T2>
T3, T1>T3), while the H group demonstrated sig
nificant differences between T2 and T3 (T2>T3) (Table 3).
Comparisons of the L and H groups at all points in time (Tables 46)
Comparisons at T1
Hard tissue analysis was as follows. In skeletal re
lationships, the SNA and SNB angles were both significantly larger in the L group. No significant dif
ference was observed between groups in ANB an
gle. FMA was significantly larger in the H group. As for dental relationships, no significant differences were observed between the groups in any item (Ta
ble 4 A). Soft tissue analysis was as follows. In Ricketts analysis, there was no significant differ
ence between groups in the distance from the labrale superior or the labrale inferior to the Eline (Table 4 B). In Arnett soft tissue analysis, among soft tissue structures, no significant differences were observed in upper lip thickness, lower lip thickness, or nasolabial angle, while upper lip angle was significantly larger in the L group. As for facial lengths, no significant differences were observed between groups in any item. As for TVL projec
tions, significant differences were observed be
tween groups in all items except Mx1, with all items being significantly larger in the L group.
Comparisons at T2
Hard tissue analysis was as follows. In skeletal re
lationships, SNA angle and SNB angle were both significantly larger in the L group. There was no significant difference in ANB angle between the groups. FMA was significantly larger in the H group. As for dental relationships, no significant dif
ferences were observed between the groups in any
item (Table 5 A). Soft tissue analysis was as fol
lows. In Ricketts analysis, there was no significant difference between groups in the distance from the labrale superior or the labrale inferior to the Eline (Table 5 B). In Arnett soft tissue analysis, among soft tissue structures, no significant differences
Table 4 Comparison between the L and H groups at T1 for a) hard tissue items by Steiner and Tweed analyses, for b) soft tis
sue items by Ricketts analysis, and for c) soft tissue items by Arnett analysis
Variable L H ttest
SNA (°) SNB (°) ANB (°) FMA (°) GoGn to SN (°) U1 to NA (mm)
∠U1 to NA (°) L1 to NB (mm)
∠L1 to NB (°) Interincisal angle (°)
82.13±3.89 83.3±3.99
−1.17±2.08 26.93±2.79 36.5±3.62 7.6±2.84 29.1±6.92 8.17±2.58 26.43±5.75 125.73±10.52
79±1.35 78.67±1.79 0.33±1.20 36.44±1.88 43.39±3.27 8.06±3.38 28.72±6.45 8.56±3.02 27±4.35 124.22±9.31
*
**
ns
**
**
ns ns ns ns ns A
Variable L H ttest
Ls to Eline Li to Eline
−1.83±2.15 3.57±2.37
−2.94±2.07 1.67±1.92
ns ns (mm) B
Variable L H ttest
Soft tissue structures Upper lip thickness (mm) Lower lip thickness (mm) Nasolabial angle (°) Upper lip angle (°) Facial lengths (mm)
Upper lip length Lower lip length Mx height Md height
TVL projections (mm) Upper lip anterior Mx1
Md1
Lower lip anterior Soft tissue B point Soft tissue pogonion
13.8±2.54 14.67±1.36 86.6±6.01 24.8±7.05 25.07±1.88 54.87±2.93 26.87±2.06 53.47±3.56 7.03±2.12
−5.9±3.55
−3.77±2.95 10.17±3.12 2.97±3.04 3.03±3.38
14.94±0.95 14.11±2.27 88.11±10.98 16.06±8.04 26.11±2.20 56.67±3.43 28.17±2.68 53.28±2.71 4.78±2.33
−6.83±3.78
−6.83±3.08 5.67±1.89
−1.39±2.34
−2.5±2.46 ns ns ns
* ns ns ns ns
* ns
*
**
**
**
C
were observed in the upper lip thickness, lower lip thickness, or nasolabial angle, while the upper lip angle was significantly larger in the L group. As for facial lengths, a significant difference was observed between groups only in upper lip length, which was significantly shorter in the L group. As for TVL pro
jections, significant differences were observed be
tween groups in the anterior of the lower lip, the soft tissue B point, and the soft tissue pogonion, all of which were significantly larger in the L group (Table 5 C).
Table 5 Comparison between the L and H groups at T2 for a) hard tissue items by Steiner and Tweed analyses, for b) soft tis
sue items by Ricketts analysis, and for c) soft tissue items by Arnett analysis
Variable L H ttest
SNA (°) SNB (°) ANB (°) FMA (°) GoGn to SN (°) U1 to NA (mm)
∠U1 to NA (°) L1 to NB (mm)
∠L1 to NB (°) Interincisal angle (°)
82.17±3.96 83.7±4.25
−1.53±2.09 27.13±3.58 36.1±3.70 5.43±2.19 24.93±7.04 9.2±2.10 31.83±3.33 124.76±8.11
79±1.35 78.83±1.85 0.17±1.56 34.89±2.26 42.72±3.59 6.11±3.38 24.56±8.19 10.11±2.36 32.22±4.21 123±10.15
*
**
ns
**
**
ns ns ns ns ns A
Variable L H ttest
Ls to Eline Li to Eline
−2.77±2.06 3.57±2.04
−3.61±2.53 3.89±1.75
ns ns (mm) B
Variable L H ttest
Soft tissue structures Upper lip thickness (mm) Lower lip thickness (mm) Nasolabial angle (°) Upper lip angle (°) Facial lengths (mm)
Upper lip length Lower lip length Mx height Md height
TVL projections (mm) Upper lip anterior Mx1
Md1
Lower lip anterior Soft tissue B point Soft tissue pogonion
12.1±1.74 14.93±1.13 88.1±11.08 23.4±7.00 22.83±1.74 56.67±3.84 26±2.01 53.5±3.42 6.53±2.26
−8.03±2.67
−1.9±2.97 11±3.18 2.7±3.22 3.17±3.91
13.17±2.45 14.22±1.56 88.06±11.09 16.17±8.53 24.78±1.80 56.33±3.74 27.83±2.84 52.56±3.34 5.11±2.84
−8.17±4.80
−4.28±3.63 8.11±2.22
−0.22±3.01
−1.39±3.25 ns ns ns
*
* ns ns ns ns ns ns
*
*
**
C
Table 6 Comparison between L and H groups at T3 for a) hard tissue items by Steiner and Tweed analyses, for b) soft tissue items by Ricketts analysis, and for c) soft tissue items by Arnett analysis
Variable L H ttest
SNA (°) SNB (°) ANB (°) FMA (°) GoGn to SN (°) U1 to NA (mm)
∠U1 to NA (°) L1 to NB (mm)
∠L1 to NB (°) Interincisal angle (°)
82.17±3.83 79.7±4.20 2.47±2.00 28.9±3.57 38.43±4.34 6±2.49 27.33±5.87 6.77±2.63 25.2±5.37 125.17±6.75
78.83±1.27 76.28±2.09 2.56±1.42 35.11±2.89 43.78±4.41 6.67±2.5 27.83±6.27
7.56±2.36 24.5±4.52 125.06±6.42
*
* ns
**
**
ns ns ns ns ns A
Variable L H ttest
Ls to Eline Li to Eline
−1.17±1.52 1.23±2.18
−1.67±2.47 1.44±2.72
ns ns (mm) B
Variable L H ttest
Soft tissue structures Upper lip thickness (mm) Lower lip thickness (mm) Nasolabial angle (°) Upper lip angle (°) Facial lengths (mm)
Upper lip length Lower lip length Mx height Md height
TVL projections (mm) Upper lip anterior Mx1
Md1
Lower lip anterior Soft tissue B point Soft tissue pogonion
14.07±1.61 13.13±1.36 92.13±6.64 18.03±6.12 25.17±1.96 53.1±3.95 25.77±3.14 54.23±3.06 5.3±2.13
−7.4±2.49
−10.5±2.58 3.67±2.98
−4.5±3.21
−3.67±4.35
13.5±1.75 12.17±1.92 89.44±7.23 14.44±6.63 25.61±2.41 55.61±3.44 27.5±2.71 54.89±4.23 4.67±2.32
−7.56±3.96
−10.22±4.12 3.17±3.21
−4.94±5.23
−5.44±5.17 ns ns ns ns ns ns ns ns ns ns ns ns ns ns C
Comparisons at T3
Hard tissue analysis was as follows. In skeletal re
lationships, the SNA and SNB angles were both significantly larger in the L group. There was no significant difference in ANB angle between the groups. FMA was significantly larger in the H group. As for dental relationships, no significant dif
ferences were observed between groups in any item (Table 6 A). Soft tissue analysis was as fol
lows. In Ricketts analysis, there was no significant difference between groups in the distance from the labrale superior or the labrale inferior to the Eline (Table 6 B). In Arnett soft tissue analysis, no signifi
cant differences were observed between the groups in any item (Table 6 C).
Comparisons of changes between all pairs of time points between the L and the H groups (Tables 79)
Steiner analysis and Tweed analysis of hard tis- sue changes
There were no significant differences between the groups in the skeletal relationships between T1 and T2 with respect to changes in the SNA, SNB or ANB angles. Although FMA increased in the L group, it decreased in the H group, thus showing a significant difference. There were no significant dif
ferences in changes in the dental relationships (Ta
ble 7 A). Although there was no significant differ
ence between groups between T2 and T3 with re
spect to changes in SNA angle, the L group dem
onstrated a significant decrease in SNB angle.
Consequently, the ANB angle significantly in
creased in the L group. As for FMA, no significant differences were observed between the groups. As for changes in dental relationships, there were no significant differences between groups (Table 7 B).
Although there was no significant difference be
tween groups between T1 and T3 with respect to changes in SNA angle, the L group demonstrated a significant decrease in SNB angle. The L group also demonstrated a significant increase in ANB angle. Although FMA increased in the L group, it decreased in the H group, thus showing a signifi
cant difference. As for changes in dental relation
ships, there were no significant differences between the groups (Table 7 C).
Ricketts analysis of soft tissue
There was no significant difference between groups in changes in Ls to Eline or Li to Eline between
Table 7 Comparison between the L and H groups of hard tis
sue changes by Steiner and Tweed analyses from a) T1 to T2, b) T2 to T3, and c) T1 to T3
Variable L H ttest
SNA (°) SNB (°) ANB (°) FMA (°) GoGn to SN (°) U1 to NA (mm)
∠U1 to NA (°) L1 to NB (mm)
∠L1 to NB (°) Interincisal angle (°)
0.03±0.12 0.4±0.66
−0.37±0.62 0.2±1.68
−0.4±0.95
−2.17±1.68
−4.17±5.32 1.03±1.68 5.4±5.50
−0.97±8.40
0 0.17±0.71
−0.17±0.71
−1.56±1.01
−0.67±1.11
−1.94±2.65
−4.17±9.10 1.56±1.44 5.22±4.44
−1.22±11.41 ns ns ns
* ns ns ns ns ns ns A
Variable L H ttest
SNA (°) SNB (°) ANB (°) FMA (°) GoGn to SN (°) U1 to NA (mm)
∠U1 to NA (°) L1 to NB (mm)
∠L1 to NB (°) Interincisal angle (°)
0±0.26
−4±1.26 4±1.11 1.77±1.80 2.33±2.08 0.57±1.45 2.4±5.63
−2.43±1.67
−6.63±3.73 0.4±5.97
−0.17±0.33
−2.56±1.32 2.39±1.26 0.22±2.51 1.06±2.18 0.56±1.36 3.28±3.90
−2.56±1.48
−7.72±4.20 2.06±6.44
ns
*
**
ns ns ns ns ns ns ns B
Variable L H ttest
SNA (°) SNB (°) ANB (°) FMA (°) GoGn to SN (°) U1 to NA (mm)
∠U1 to NA (°) L1 to NB (mm)
∠L1 to NB (°) Interincisal angle (°)
0.03±0.29
−3.6±1.34 3.63±1.19 1.97±2.58 1.93±1.97
−1.6±1.64
−1.77±3.61
−1.4±2.08
−1.23±5.70 1.97±2.58
−0.17±0.33
−2.39±1.05 2.22±1.06
−1.33±1.97 0.39±1.91
−1.39±2.62
−0.89±7.67
−1±1.90
−2.5±5.25
−1.33±1.97 ns
*
*
**
ns ns ns ns ns
**
C
T1 and T2 or between T2 and T3 (Table 8 AB).
Between T1 and T3, although there was no signifi
cant difference between groups in change in Ls to
Eline, the L group demonstrated a significant re
duction in Li to Eline (Table 8 C).
Arnett soft tissue analysis
Between T1 and T2, there were no significant dif
ferences between groups in any item (Table 9 A).
Between T2 and T3, among soft tissue structures, the L group demonstrated a significant increase in upper lip thickness and a significant decrease in upper lip angle. As for facial lengths, the L group
Table 8 Comparison between the L and H groups in soft tissue changes by Ricketts analysis from a) T1 to T2, b) T2 to T3, and c) T1 to T3
Variable L H ttest
Ls to Eline Li to Eline
−0.93±1.39 0±2.05
−0.67±1.65 1.72±1.31
ns ns (mm) A
Variable L H ttest
Ls to Eline Li to Eline
1.6±1.36
−2.33±1.98
1.94±1.55
−1.94±1.94 ns ns (mm) B
Variable L H ttest
Ls to Eline Li to Eline
0.67±1.62
−2.33±1.64
1.28±1.83
−0.22±1.93 ns
* (mm) C
Table 9 Comparison between the L and H groups of soft tis
sue changes by Arnett analysis from a) T1 to T2, b) T2 to T3, and c) T1 to T3
Variable L H ttest
Soft tissue structures Upper lip thickness (mm) Lower lip thickness (mm) Nasolabial angle (°) Upper lip angle (°) Facial lengths (mm)
Upper lip length Lower lip length Mx height Md height
TVL projections (mm) Upper lip anterior Mx1
Md1
Lower lip anterior Soft tissue B point Soft tissue pogonion
−1.7±2.59 0.27±1,41 1.5±10.93
−1.4±6.95
−2.23±1.57 1.8±2.6
−0.87±1.38 0.03±4.01
−0.5±1.88
−2.1±2.27 1.87±1.04 0.83±2.34
−0.27±2.21 0.13±1.92
−1.78±2.27 0.11±1.29
−0.06±5.25 0.11±5.07
−1.33±1.18
−0.33±3.23
−0.33±1.89
−0.72±2.19 0.33±1.60
−1.33±3.02 2.56±3.03 2.44±2.41 1.17±2.05 1.11±2.05
ns ns ns ns ns ns ns ns ns ns ns ns ns ns A
Variable L H ttest
Soft tissue structures Upper lip thickness (mm) Lower lip thickness (mm) Nasolabial angle (°) Upper lip angle (°) Facial lengths (mm)
Upper lip length Lower lip length Mx height Md height
TVL projections (mm) Upper lip anterior Mx1
Md1
Lower lip anterior Soft tissue B point Soft tissue pogonion
1.97±1.60
−1.8±1.49 4.03±8.56
−5.37±5.24 2.33±1.11
−3.57±3.43
−0.23±1.80 0.73±3.37
−1.23±1.59 0.63±1.67
−8.6±1.8
−7.33±2.47
−7.2±2.09
−6.83±2.02
0.33±1.81
−2.06±1.67 1.39±8.06
−1.72±4.87 0.83±1.37
−0.72±3.30
−0.33±0.91 2.33±2.49
−0.44±1.71 0.61±1.95
−5.94±2.70
−4.94±3.02
−4.72±3.04
−4.06±2.94
* ns ns
*
* ns ns ns ns ns
* ns
*
* B
Variable L H ttest
Soft tissue structures Upper lip thickness (mm) Lower lip thickness (mm) Nasolabial angle (°) Upper lip angle (°) Facial lengths (mm)
Upper lip length Lower lip length Mx height Md height
TVL projections (mm) Upper lip anterior Mx1
Md1
Lower lip anterior Soft tissue B point Soft tissue pogonion
0.27±2.24
−1.53±1.43 5.53±6.54
−6.77±6.36 0.1±1.92
−1.77±3.41
−1.1±1.96 0.77±3.28
−1.73±1.70
−1.47±2.47
−6.73±1.96
−6.5±1.79
−7.47±2.15
−6.7±2.74
−1.14±1.62
−1.94±1.88 1.33±8.60
−1.61±6.15
−0.5±1.45
−1.06±1.46
−0.67±1.86 1.61±2.61
−0.11±1.68
−0.72±1.40
−3.39±3.45
−2.5±2.85
−3.56±3.55
−2.94±3.47 ns ns ns
* ns ns ns ns
* ns
**
**
**
* C
demonstrated a significant increase in upper lip length. Among TVL projections, the L group dem
onstrated significant reductions in soft tissue B point and soft tissue pogonion (Table 9 B). Between T1 and T3, among soft tissue structures, the L group demonstrated a significant reduction in upper lip angle. As for facial lengths, no significant differ
ences were observed between groups at any time.
Among TVL projections, the L group demonstrated significant reductions in all items except for Mx1 (Table 9 C).
Correlations between hard tissue and lip soft tissue
Table 10 A shows correlations between maxillary and mandibular incisor vertical positions (Mx height, Md height) and upper and lower lip vertical posi
tions (U lip length, L lip length). Between T1 and T2, a strong positive correlation between Md height and L lip length was observed in both groups. Be
tween T2 and T3, Md height was positively corre
Table 10 Correlation coefficients for comparison of vertical changes in the hard and soft tissues in a) the L group, b) the H group, and horizontal changes in the hard and soft tissues in c) the L group, in d) the H group, and in the upper lip thickness and the lower lip thickness in e) the L group, and f) the H group
T1T2 Upper lip length Lower lip length Mx height
Md height
0.33 0.04
−0.35 0.58*
T2T3 Mx height Md height
0.07 0.46
0.29 0.41
T1T3 Mx height Md height
0.4
−0.28
0.05 0.74*
(mm) r: Spearman’s rank correlation,*r>0.52.
A
T1T2 Upper lip length Lower lip length Mx height
Md height
−0.4
−0.16
−0.47 0.77*
T2T3 Mx height Md height
0.28 0.79*
0.26 0.57
T1T3 Mx height Md height
0.34 0.35
−0.62 0.29
(mm)
*r>0.7
B
T1T2 Upper lip anterior
Lower lip anterior
Upper lip thickness
Lower lip thickness Mx1
Md1 SNB
0.36
−0.07 0.07
0.02
−0.07 0.19
0.04
−0.34
−0.27
−0.22 0.07
−0.32
T2T3 Mx1 Md1 SNB
0.39 0.06 0.11
0.25 0.58*
0.41
−0.05 0.17 0.32
0.07
−0.05
−0.13
T1T3 Mx1 Md1 SNB
−0.34
−0.14 0.47
0.16
−0.05 0.48
0.02
−0.28 0.15
−0.09
−0.37
−0.27 (mm)
*r>0.52
C
T1T2 Upper lip anterior
Lower lip anterior
Upper lip thickness
Lower lip thickness Mx1
Md1 SNB
0.56 0.49 0.19
0.23 0.56 0.69
0.02 0.13 0.19
0.19 0.23 0.2
T2T3 Mx1 Md1 SNB
0.1
−0.07 0.51
−0.45 0.51 0.77*
0.06 0.08 0.3
−0.52 0.45 0.75*
T1T3 Mx1 Md1 SNB
0.32 0.15 0.28
0.63 0.79*
0.77*
−0.42
−0.22
−0.36
0.14 0.45 0.71*
(mm)
*r>0.7
D
lated with U lip length and L lip length in both groups. A particularly strong positive correlation was observed between Md height and U lip length in the H group. Between T1 and T3, the L group demonstrated a strong positive correlation between Md height and L lip length. Table 10 B shows the correlations of maxillary and mandibular incisor horizontal position (Mx1, Md1) and mandibular an
teroposterior position (SNB) with the upper and lower lip horizontal position (U lip anterior, L lip an
terior) and upper and lower lip thickness (U lip thickness, L lip thickness).
The L group demonstrated a strong positive cor
relation between Md1 and L lip anterior between T2 and T3. In the H group, SNB was strongly posi
tively correlated with L lip anterior and L lip thick
ness between T2 and T3. Between T1 and T3, the H group also demonstrated strong positive correla
tions between Md1 and L lip anterior, between SNB
and L lip anterior, and between SNB and L lip thickness. Table 10 C shows correlations between upper lip thickness (U lip thickness) and lower lip thickness (L lip thickness). The L group demon
strated strong positive correlations between T1 and T2, and between T2 and T3.
DISCUSSION
Materials and methods
For skeletal class III patients who require surgical orthodontic treatment, it is important to predict post
treatment changes in the soft tissue profile before the initial orthodontic treatment. Previous studies have shown that postoperative soft tissue changes are affected by differences in surgical method
3, 5, 9and in pretreatment maxillofacial morphology.
8, 16To learn whether differences in FMA lead to differ
ences in soft tissue changes in surgical orthodontic treatment with SSRO, we assembled patients who were as similar in maxillofacial morphology as pos
sible aside from FMA, divided these patients into two groups based on the size of their FMA, and ex
amined their hard and soft tissue changes. Accord
ing to Tweed,
11the mean FMA in adult women is 28.81°±5.23° . Therefore, the present study classi
fied patients with an average FMA (defined as less than 30°to establish a distinction) as the L group and patients with an FMA greater than or equal to 34° as the H group. The range of FMA in our study in the L and H groups was 23.5° 30°and 34° 39° , respectively. Also, because many skeletal class III patients have labial inclination of the maxillary inci
sors as dental compensation, we selected patients whose maxillary premolars had been extracted.
To eliminate differences in soft tissue profile changes associated with differences in surgical method, we selected patients who had undergone SSRO alone. We also excluded patients with prominent lateral mandibular deviation and those with cleft lip and palate because it is difficult to ac
curately grasp their soft tissue changes associated with hard tissue changes. For example, in patients with lateral mandibular deviation, hard tissue changes associated with surgery cannot be deter
mined from lateral morphology alone ; while cleft lip
T1T2 Lower lip thickness
Upper lip thickness 0.51
T2T3
Upper lip thickness 0.53*
T1T3
Upper lip thickness 0.02
(mm)
*r>0.52
E
T1T2 Lower lip thickness
Upper lip thickness −0.06
T2T3
Upper lip thickness 0.44
T1T3
Upper lip thickness −0.22
(mm)
*r>0.7
F
and palate patients often present with scarring and deformation of the ala of the nose, the lips, and other soft tissue, which limit soft tissue changes.
In analysis, lateral cephalograms from before the initial orthodontic treatment, after the initial ortho
dontic treatment and before the operation, and after completion of all treatment were traced by a single orthodontist who does cephalometric analysis daily.
Regarding error in the time of designation of ana
tomical landmarks in cephalograms, when cephalo
gram landmark designation was conducted 10 times, the standard error of measurements at all landmarks was within 0.5 mm (minimum 0 mm, maximum 1.0 mm). Hard tissues were analyzed us
ing Steiner
10and Tweed
11analyses, while soft tis
sues were analyzed using Ricketts analysis,
12, 13E
line and STCA.
14Steiner analysis, which uses the cranial base SN plane as a reference, focuses on ANB angle, U1 to NA angle and distance, and L1 to NB angle and distance, as a specialized analysis for determining hard tissue characteristics.
We used nine items that illustrate skeletal and lip changes. From Tweed analysis, we used the man
dibular plane angle, with which the characteristics of the jaw can be grasped. In Ricketts soft tissue analysis, profile balance can be grasped easily based on two items that assess the distances of the labrale superior and labrale inferior from a refer
ence line called the Eline. Arnett’s STCA has a to
tal of 45 items for assessing soft tissue, which is more than other soft tissue analyses. Of the items listed by John C. Bennett and Richard P. McLaugh
lin,
17we abstracted 14 dedicated soft tissue analy
sis items that affect facial appearance and are nec
essary when drafting a profile treatment plan.
These items included lip thickness, horizontal and vertical positions of the lips, nasal angle, and lower facial length.
Using these 14 items, which are thought to change as a result of surgical orthodontic treatment with SSRO alone, the present study combined the above four analyses to analyze hard and soft tissue in detail. Values in STCA are taken from adult ra
diographs in a natural head position with the upper and lower lips in a resting position. Although meas
urements were taken with the head in a fixed posi
tion, the conditions for radiography before and after treatment were identical. Therefore, we used STCA values for comparisons.
Hard tissue changes
In skeletal relationships, the SNB angle greatly de
creased in the L group between T2 and T3. Conse
quently, the ANB angle in the L group significantly increased. In skeletal Class III patients who re
quired surgery, ANB angles after completion of all treatment of −0.5°±1.6° ,
18−0.5°±2.4° ,
19and
−0.2°±1.5°
2have been reported. However, in the present study, ANB angles after completion of all treatment in both groups were standard values
10that were larger than the above values. Before the initial orthodontic treatment, ANB angles in the L and H groups were −1.17°±2.08° , and 0.33°±
1.20° , respectively. Because these values were not small, it is conceivable that ANB angles after com
pletion of all treatment improved due to retrusion of the mandible as a result of the operation. Also, the H group demonstrated a significant decrease in FMA from T1 to T2. In a comparison of T1 and T3, the L group demonstrated an increase in FMA, sig
nifying clockwise rotation ; while the H group dem
onstrated a decrease in FMA, signifying counter
clockwise rotation. This may be why the L group demonstrated a greater decrease in SNB angle be
tween T2 and T3, and between T1 and T3.
As for dental relationships, both groups demon
strated labial tilt of the maxillary incisors, protrusion of the maxillary incisors, and protrusion of the man
dibular incisors at T1. Both groups demonstrated lingual tilt of the maxillary incisors between T1 and T2, and labial tilt between T2 and T3. However, there were no significant differences in changes or between groups at any point in time. As for the mandibular incisors, both groups demonstrated la
bial tilt between T1 and T2, and lingual tilt between T2 and T3. However, there were no significant dif
ferences in changes or between groups at any
point in time. Therefore, in the present study, there
were no significant differences between groups in
changes in dental relationships.
Soft tissue changes
Comparisons of soft tissue changes between groups showed the L group had more items with significant differences. The L group showed signifi
cant differences in upper and lower lip thickness at all points in time, as well as a significant difference between T2 and T3. The H group did not demon
strate significant differences in upper or lower lip thickness at any point in time. Consequently, the L group showed greater change in lip thickness in re
lation to movement of the teeth and the mandible.
The upper lip angle was larger in the L group at T1 and T2, thus indicating that the L group demon
strated greater eversion of the upper lip. Also, be
tween T2 and T3, the L group showed a significant decrease in upper lip angle, thus demonstrating that upper lip eversion was lower in the L group from before to after the operation than in the H group.
As for facial lengths, the L group showed a sig
nificant reduction in lower lip length from T2 to T3.
Upper lip length at T2 was lower in the L group, and a significant difference was observed between groups. The change in upper lip length from T2 to T3 was significantly larger in the L group. These re
sults indicate that from T1 to T2, the upper lip moved in superiorly, and that as a result of mandi
bular retrusion associated with the subsequent op
eration, incisor overlap improved, and the upper lip descended. This is consistent with a report by Hida et al.
7in which the upper lip, which had been pushed up by the mandibular incisors before the operation, moved downward and covered the lower lip while being restored to its original length in as
sociation with improvement in incisor overlap.
Despite the absence of changes in the vertical and horizontal positions of the maxillary incisors, the vertical position and the thickness of the upper lip did change. Lip thickness is believed to be af
fected by the teeth beneath the lip, the muscles around the lip, and contact between the lips.
20, 21It is conceivable that in the L group of our study, the muscles around the lips and the contact between the upper and lower lips exerted a greater effect, which was responsible for the change in lip thick
ness. As for the lower lip, Sakai et al.
8reported that a smaller FMA caused actual posteroinferior dis
placement of the lower lip landmark to be greater than predicted due to excessive eversion of the lower lip before the operation. Although we found that both groups demonstrated decreased lower lip thickness from T2 to T3, thus signifying posteroinfe
rior movement, there were no significant differences between groups in thickness or vertical change.
In both Ricketts and Arnett analyses, horizontal lower lip change between T1 and T3 was signifi
cantly different between groups, with the L group showing significant reduction. All TVL projections among the patients in the present study at all points in time were more anterior than the refer
ence values for Japanese women
22(Table 11). At T1 and T2, there were significant differences in most items between the groups, with the L group demonstrating more anterior positions. From T2 to T3, the L group showed significant decreases in lower lip anterior, soft tissue B point, and soft tissue pogonion. Consequently, there were no significant differences between groups in any items at T3. Al
though there was improvement in protrusion of the lower face, the values calculated for the anterior of the lower lip, soft tissue B point, and soft tissue po
Table 11 Means values for facial features of female adult Japanese with normal occlusion from a previous study using the Arnett analysis
Variable Mean
Soft tissue structures Upper lip thickness (mm) Lower lip thickness (mm) Nasolabial angle (°) Upper lip angle (°) Facial lengths (mm)
Upper lip length Lower lip length Mx height Md height
TVL projections (mm) Upper lip anterior Mx1
Md1
Lower lip anterior Soft tissue B point Soft tissue pogonion
13.0±1.8 13.3±1.4 100.1±6.9 11.5±5.3 23.6±1.8 47.3±3.6 26.2±2.7 49.5±3.5 3.1±1.6
−9.9±2.7
−12.7±2.8
−0.2±2.4
−8.8±3.2
−9.1±3.9
gonion were more protruded than reference values for Japanese women,
22thus signifying a residual tendency towards mandibular prognathism.
Relationships between hard tissue and soft tis- sue changes
We found no significant vertical or horizontal corre
lations between the maxillary incisors and the up
per lip in either group. A past study stated that the postoperative horizontal and vertical positions of the upper lip are correlated with the maxillary inci
sors.
7In our study, neither group demonstrated sig
nificant differences in maxillary incisor changes at any time, which may have been why no correla
tions were observed. Both groups demonstrated strong positive vertical and horizontal correlations between the mandibular incisors and the lower lip, thus demonstrating that the mandibular incisors and the lower lip are directly related to each other.
Therefore, we examined the ratio of change in the lower lip (lower lip anterior) before and after treat
ment in relation to changes in the mandibular inci
sors (Md1) from before and after treatment.
The ratios of Md1 to the lower lip anterior in the L and H groups were 0.96 and 0.74, respectively.
Thus, the H group showed smaller change in the lower lip relative to change in the mandibular inci
sors. Highangle cases have been reported to fea
ture a great deal of activity in the mentalis, the or
bicularis oris, and other muscles around the lips during lip closure.
8In the H group, contraction of muscles around the lips may have affected lower lip changes. The L group demonstrated a strong correlation between upper lip thickness and lower lip thickness. The H group demonstrated a strong positive correlation between lower lip thickness and SNB angle, which suggests that mandibular posi
tion changes directly affect lower lip thickness.
CONCLUSION
We found that although there were no significant differences between groups in hard tissue changes, there were some significant differences between the groups in labial soft tissue changes. This sug
gests that differences in FMA lead to differences in
soft tissue changes. These differences in soft tissue changes may originate from the effects of contact with the upper and lower lips, and differences in muscle activity surrounding the lips. Conceivable factors in upper lip changes include not only changes in the maxillary incisors beneath the lips, but also the state of contact with the mandibular in
cisors or the lower lip. This tendency is stronger when FMA is smaller. It was also learned that when FMA is large, lower lip changes relative to changes in the mandibular incisors are small. These findings suggest that when predicting soft tissue changes in surgical orthodontic treatment, it is important to ac
count for the effects of FMA on lip soft tissue changes when drafting a treatment plan.
REFERENCES
1. Kanda T. Hard and soft tissue changes following orthog
nathic surgery in mandibular prognathic patients with open bite −Comparison between two jaw surgery and one jaw surgery−.Jpn J Jaw Deform2005; 15: 105113.
2. Kusakabe T. Profile changes in skeletal Class Ⅲ patients
−A comparison between sagittal split ramus osteotomy and orthodontic treatment−.Jpn J Jaw Deform2006; 16: 17.
3. Hasegawa S. Soft tissue changes associated with twojaw surgery in skeletal Class Ⅲ patients −Changes in the cheek line−.Jpn J Jaw Deform2003; 13: 8391.
4. Inami Y, Hoshi T, Nakagawa K. Facial changes in skeletal ClassⅢpatients following orthognathic surgery.J Kou-Shin Orthod Soc2001; 9: 4350.
5. Tsuchiya M, Yoshida K, Adachi S, Sakuda M. Softtissue profile changes associated with the orthognathic surgery of mandibular prognathism. Changes before and after surgery.
Orthod Waves1983; 42: 168177.
6. Kawauchi M, Matsuo K, Sugawara J, Kawamura H, Mitani H. Prediction of soft tissue profile in nose and upper lip re
gion following orthognathic surgery−Classified by directions of surgical displacement of maxilla and evaluated with multi
variate analysis−.Jpn J Jaw Deform1998; 8: 170185.
7. Hida K. Prediction of lateral soft tissue profile following or
thognathic surgery for mandibular prognathism. Orthod Waves2007; 66: 7280.
8. Sakai M, Tamaoki S, Ishikawa H. Influence of profile pat
terns on the prediction of soft tissue profile after orthodontic treatment in mandibular prognathism. Jpn J Jaw Deform 2014; 24: 305317.
9. Yamada A. Relationships between hard tissue and soft tis
sue changes in surgical orthodontic treatment. Orthod Waves2004; 63: 8594.
10. Steiner CC. Cephalometrics for you and me. Am J Orthod 1953; 39: 729755.
11. Tweed CH. The Frankfortmandibular incisor angle (FMIA) in orthodontic diagnosis, treatment planning and prognosis.
Angle Orthod 1954; 24: 121169.
12. Ricketts RM. Cephalometric synthesisAn exercise in stating objectives and planning treatment with tracings of the head
roentogenogram.Am J Orthod 1960; 46: 647673.
13. Ricketts RM. A foundation for cephalometric communication.
Am J Orthod 1960; 46: 331357.
14. Arnett GW, Jelic JS, Kim J, Cummings DR, Beress A, Wor
ley CM, Chung B, Bergman R. Soft tissue cephalometric analysis : Diagnosis and treatment planning of dentofacial deformity.Am J Orthod Dentofac Orthop 1999; 116: 239
253.
15. Noto H. EBM : How to read and use evidence. 1st ed. To
kyo : Nankodo, 2010 : 99. (Japanese)
16. Anthony T, Antoine E. Comparisons of soft tissue chin thick
ness in adult patients with various mandibular divergence patterns.Angle Orthod 2014; 84: 708714.
17. Bennett JC, McLaughlin RP. Fundamentals of orthodontic treatment mechanics. 1st ed. Kyoto : Nagasue, 2015 : 18
21. (Japanese)
18. Matsui S, Yamamoto Y. Soft tissue profile of cervicomental region after orthognathic surgery.Jpn J Jaw Deform 2000; 10: 15.
19. Ishizaki T. Morphological changes during treatment for skeletal ClassⅢmalocclusion−Comparison between surgi
cal and orthodontic cases−.Jpn J Jaw Deform2001; 11: 167174.
20. Burstone CJ. Lip posture and its significance in treatment planning.Am J Orthod1967; 53: 262284.
21. Burstone CJ. Integumental contour and extension patterns.
Angle Orthod 1959; 29: 93104.
22. Watanabe K, Shimojima R, Mizoguchi R, Kawamura M, Koga M. Arnett soft tissue cephalometric norms for Japa
nese adults.Orthodontic Waves 2014; 73: 6979.