IRUCAA@TDC : A study of the harmonious profile in facial esthetics. Part 1. Descriptive statistics
13
0
0
全文
(2) Bull. Tokyo dent. Coll., Vol. 40, No. 1, pp. 35⬃46, February 1999. Original Article. A STUDY OF THE HARMONIOUS PROFILE IN FACIAL ESTHETICS PART 1. DESCRIPTIVE STATISTICS MAYUMI NOMURA, MAYUMI TOCHIKURA, HARUMI KONISHI, TOSHIMASA SUZUKI, MASAYUKI SEBATA and YASUSHIGE ISSHIKI Department of Orthodontics, Tokyo Dental College, 1-2-2 Masago, Mihama-ku, Chiba 261-8502, Japan. Received 6 November, 1998/Accepted for Publication 8 January, 1999. Abstract The purpose of this study was to investigate the relationship between a harmonious profile and normal occlusion, differences between good and poor groups, and the characteristics of a good group from normal occlusion group and after orthodontic treatment groups. The sample included 60 subjects with normal occlusion (normal subjects) and 88 after orthodontic treatment subjects (orthodontic subjects). Evaluators were 20 students and 20 orthodontists from Tokyo Dental College. For the purpose of profile evaluation, normal and orthodontic subjects were classified into 3 groups (good, mediocre, and poor) based in their external profile lines. Lateral Roentgen-cephalograms were used to measure hard and soft tissues. Mean values and Student’s t-test were calculated statistically. Results 1. The frequencies of the good and poor subjects were similar in both normal subjects and orthodontic subjects. When considering the mediocre group, however, the normal subjects were more likely to have a better profile than the other subjects. 2. There were differences in hard tissues between the good group and the poor group in both the normal subjects and the orthodontic subjects, but only slight differences in soft tissues. 3. In the good groups of both normal and orthodontic subjects (all subjects), the edges of the upper and lower central incisors and upper and lower lips retruded, the ratio of upper facial height to total facial height was greater and the chin region was thicker than in the poor group. Additionally, in the good group of normal subjects, the maxilla protruded and the anteroposterior difference between the maxilla and mandible was larger. Key words:. Facial esthetics —External profile —Roentgen-cephalograms — Normal occlusion —After orthodontic treatment. This study is part of a dissertation submitted by M. Nomura to Graduate School of Tokyo Dental College for the degree of Doctor of Philosophy. Shikwa Gakuho (88: 1557–1602, 1988).. 35.
(3) 36. M. NOMURA et al.. INTRODUCTION The purpose of orthodontics is to improve the form and function of malocclusions and obtain a harmonious profile in facial esthetics. Thus, the harmonious profile is based on normal function and structure, which are closely related to each other. Orthodontic studies regarding the harmonious profile in facial esthetics have evaluated it quantitatively by means of lateral cephalogram, facial photographs and silhouette, etc. Previous studies have suggested that harmonious profile in facial esthetics differs in the nose, lip and chin from the disharmonious one17,27–29). However, they also suggested that the characteristics of facial esthetics may vary depending on age, sex, and race of the subjects as well as the orthodontic knowledge of evaluator1,2,7,10,13,19,20,30). Normal occlusion is important in a harmonious profile8,19), but the presence of normal occlusion does not always mean that the profile is harmonious22). It is not uncommon to find a harmonious profile in spite of the fact that there are some malocclusions present3,17,22–27). The purpose of this study was to investigate the relationship between harmonious profile and normal occlusion, differences between good and poor groups, and the characteristics of a good group from normal occlusion and after orthodontic treatment.. Table 1 Summary of the malocclusions present before treatment in the orthodontic subjects Angle’s Classification Class I Class II div. 1 Class II div. 2 Class III Total. Male. Female. Total. 15 (11) 8 ( 6) 0 ( 0) 10 ( 6). 18 (14) 19 (16) 3 ( 3) 15 ( 6). 33 (25) 27 (22) 3 ( 3) 25 (12). 33 (23). 55 (39). 88 (62). ( ): Nmber of extraction cases. 1. 2. Fig. 1 Samples of external profile lines in a questionnaire. MATERIALS AND METHODS 1. Materials Subjects evaluated were 88 (33 males, 55 females) after orthodontic patients or patients who finished their orthodontic treatment, were evaluated as “Good” or “Satisfactory” by Gottlieb’s grading analysis9), were over 14 years of age, and had been treated with a multi-bracket appliance and the edgewise method at the Department of Orthodontics of the Tokyo Dental College. They were classified as orthodontic subjects. Their mean age was 17 years and 2 months (17.7 years. Fig. 2 Landmarks of lateral cephalograms. male, 16.9 years female). The malocclusions present before treatment in these subjects are shown in Table 1. As normal subjects, 60 persons (30 males, 30 females) with normal occlusion were selected. These all had a Class I molar and canine relationship with less than 3 mm of crowding. None of them had under-.
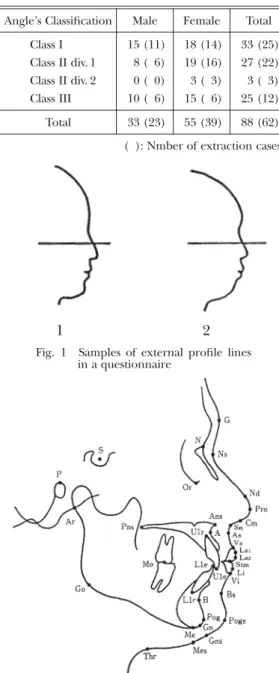
(4) 37. THE HARMONIOUS PROFILE PART 1. Hard tissue measurements ① SNA ② NA-FH ③ Convexity ④ SNB ⑤ NB-FH ⑥ Facial angle ⑦ Gonial angle ⑧ Mandibular pl. ⑨ Ramus angle ⑩ Y axis ⑪ ANB ⑫ A-B pl. ⑬ Wits (mm) ⑭ SN to FH ⑮ U1 to FH ⑯ U1 to A-Pog (mm) ⑰ L1 to FH ⑱ L1 to Occlusal pl. ⑲ L1 to Mandibular pl. ⑳ L1 to A-Pog L1 to A-Pog (mm) Interincisal angle Occlusal pl.. Fig. 3 Cephalometric measurements of hard tissue. Soft tissue measurements ① NFR ② NFA ③ Prn-Pogs-Sn ④ G-Sn to FH ⑤ G-Sn-P ⑥ Sn-P to FH ⑦ Sn-Ls1 to FH ⑧ Nasolabial angle. Variables : NFR : NFA : PRS : FGS : GSP : SNP : SLS : NAS. ⑨ ⑩ ⑪ ⑫ ⑬ ⑭ ⑮ ⑯. ULip to E pl. Pogs-Li to FH Prn-Pogs-Li LLip to E pl. (mm) G-Pogs- to FH Gns-P to FH G-Sn to Sn-Pogs G-Sn to Sn-Bs. : UEP : PL : PRL : LEP : FGP : GNP : GP : GB. ⑰ ⑱ ⑲ ⑳. NM Ns-Sn/Ns-Mes (%) Sn-Mes/Ns-Mes (%) Stm-Mes/Ns-Mes (%) Prn-Pogs to FH P-Sn-Pogs Sn-Ls1 to Pogs-Li. Variables : SNA : FNA : VEX : SNB : FNB : FAC : GON : MAN : RAM : YA : ANB : AB : WIT : FSN : UFH : UAP : LF : LOC : LMA : APO : LAP : SAL : OCC. : NM : NSM : SM : STM : PRP : PSP : SNL. Fig. 4 Cephalometric measurements of soft tissue. gone orthodontic treatment. The mean age of the normal subjects was 21 years and 9 months (22.1 years male, 21.4 years female). All subjects were Japanese. For the purpose of analysis, all lateral cephalograms of both normal subjects and orthodontic subjects were taken in centric occlusion with the lips closed. 2. Method of evaluation of the profile in facial esthetics Evaluators were divided into two groups (10 males, 10 females in each group). One. group consisted of students of Tokyo Dental College. The other group consisted of orthodontists at the Department of Orthodontics of the Tokyo Dental College. The questionnaire used included traces of external profile line, Frankfort horizontal plane, and gender (Fig. 1). Evaluators judged each subjects based on a three grade scale: 3 (good), 2 (mediocre), 1 (poor). Those receiving more than 95 points were classified as good, those receiving 65 to 94 points were classified as mediocre, and those receiving 40 to 64 points.
(5) 38. M. NOMURA et al.. were classified as poor. 3. Analysis of cephalograms 1) Landmarks In this study, the 36 landmarks included 18 for hard tissue and 18 for soft tissue. They are shown in Fig. 2. The identification of these landmarks was based on definitions found in the literature12,20,27). 2) Cephalometric measurements Hard tissue measurements6,14–16) are shown in Fig. 3. Soft tissue measurements20,27,29) are shown in Fig. 4, and thickness measurements are shown in Fig. 5. 3) Statistical analysis Descriptive statistics were calculated for cephalometric measurements. The unpaired Student’s t-test was used to compare the means of cephalometric measurements. Thickness of soft tissue ① N-Ns (mm) ② Ans-Prn (mm) ③ A-Sn (mm) ④ U1e-Ls2 (mm) ⑤ L1e-Li (mm) ⑥ B-Bs (mm) ⑦ Pog-Pogs (mm). Variables : NS : ANP : ASUB : ULS : LLI : BBS : POG. Fig. 5 Cephalometric measurements of thickness of soft tissue. between normal subjects and orthodontic subjects, the good and poor groups from normal subjects and orthodontic subjects, the good and poor groups from both normal and orthodontic subjects (all subjects), and the good and poor groups between normal subjects and orthodontic subjects.. RESULTS 1. Results of a questionnaire on the profile in facial esthetics (Table 2) In the normal subjects, 16.7% of the sample classified as good, 51.7% were mediocre, and 31.7% were poor. In the orthodontic subjects, 19.3% were good, 40.9% were mediocre, and 39.8% were poor. The results were similar between the groups. 2. Comparison between normal subjects and orthodontic subjects (Table 3, 4, 11) 1) Hard tissue measurements In the orthodontic subjects, the maxilla retruded a little, the anteroposterior difference between the maxilla and the mandible was smaller, the edges of the upper and lower central incisors retruded to the basal arch, and the inclination of lower central incisors inclined lingually to the basal arch more than in normal subjects. 2) Soft tissue and thickness of soft tissue measurements In the orthodontic subjects, the upper basal lip region and lower lips retruded, the. Table 2 Results of the questionnaire Good group Mediocre group Poor group. Normal subjects. Male Female Total. 7 3 10 (16.7%). 13 18 31 (51.7%). 10 9 19 (31.7%). Orthodontic subjects. Male Female Total. 6 11 17 (19.3%). 13 23 36 (40.9%). 14 21 35 (39.8%). 27 (18.2%). 67 (45.3%). 54 (36.5%). Total. (Unit: number).
(6) THE HARMONIOUS PROFILE PART 1. Table 3 Results of hard tissue measurements in the normal and orthodontic subjects. Table 4 Results of soft tissue and thickness of soft tissue measurements in the normal and orthodontic subjects. 39.
(7) 40. M. NOMURA et al.. Table 5 Results of hard tissue measurements in the good and poor groups from normal subjects. ratio of upper facial height to total facial height was smaller, the root of the nose and the chin region were thinner, and the thickness of upper lip was thicker than in normal subjects. Additionally, comparison between sexes in the normal subjects showed that the nasal height was higher, the thickness of the root of the nose and the thickness of the chin region were greater in males than in females. 3. Comparison between the good group and the poor group of normal subjects (Table 5, 6, 11) 1) Hard tissue measurements in normal subjects In the good group, the anteroposterior difference between the maxilla and the mandible was larger and the edges of the upper and lower central incisors retruded more to the basal arch than in the poor group.. Table 6 Results of soft tissue and thickness of soft tissue measurements in the good and poor groups from normal subjects. 2) Soft tissue and thickness of soft tissue measurements in normal subjects In the good group, the anteroposterior difference between the upper and lower basal lips region was larger, the upper and lower lips retruded, and the chin region was thicker than in the poor group. 4. Comparison between the good group and the poor group of orthodontic subjects (Table 7, 8, 11) 1) Hard tissue measurements in orthodontic subjects In the good group, no significant differences were found in the skeletal pattern, but the edges of the upper and lower central incisors retruded to the basal arch more than.
(8) THE HARMONIOUS PROFILE PART 1. Table 7 Results of hard tissue measurements in the good and poor groups from orthodontic subjects. in the poor group. 2) Soft tissue and thickness of soft tissue measurements in orthodontic subjects In the good group, the anteroposterior difference between the upper and lower basal lips region was larger, the upper and lower lips retruded, the ratio upper facial height to total facial height was larger, the sulcus mentolabialis region was thinner, and the chin region was thicker than in the poor group. 5. Comparison between the good group and the poor group of all subjects (both normal and orthodontic subjects) (Table 9, 10, 11) 1) Hard tissue measurements in all subjects In the good group, the edges of the upper and lower central incisors retruded to the basal arch more than in the poor group.. 41. Table 8 Results of soft tissue and thickness of soft tissue measurements in the good and poor groups from orthodontic subjects. 2) Soft tissue and thickness of soft tissue measurements in all subjects In the good group, the anteroposterior difference between the upper and lower basal lips region was larger, the upper and lower lips retruded, the ratio upper facial height to total facial height was larger, and the chin region was thicker than in the poor group. It was recognized that the characteristics of combined good group from all subjects were clearer those from the separate groups. 6. Comparison between the good groups and the poor groups of normal and orthodontic subjects (Table 5, 6, 7, 8, 11) 1) Hard tissue measurements in normal and orthodontic subjects.
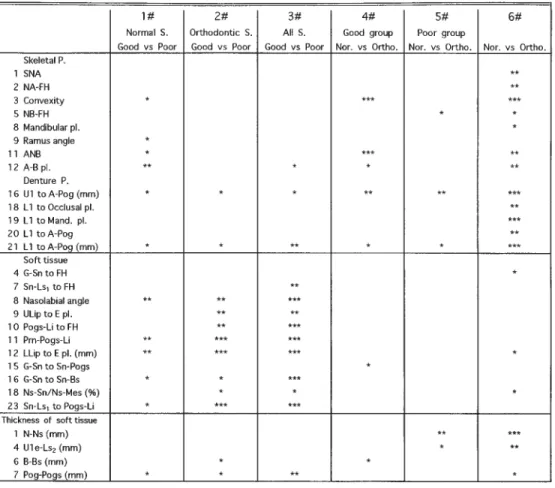
(9) 42. M. NOMURA et al.. Table 9 Results of hard tissue measurements in the good and poor groups from all subjects. Table 10 Results of soft tissue and thickness of soft tissue measurements in the good and poor groups from all subjects. In the good group from orthodontic subjects, the maxilla retruded, the anteroposterior difference between the maxilla and the mandible was smaller, and the edges of the upper and lower central incisors retruded to the basal arch more than in the good group from normal subjects. In the poor group from orthodontic subjects, the edges of the upper and lower central incisors were retruded to the basal arch more than in the poor group from normal subjects. 2) Soft tissue and thickness of soft tissue measurements in normal and orthodontic subjects No significant differences were found between the good and poor groups of normal and orthodontic subjects.. DISCUSSION 1. Material and Methods There are several studies reporting that esthetic preferences for a harmonious profile are based on the conditions of both subjects and evaluators1,2,7,10,13,19,20,30). The subjects were selected by following means. (1) Photographs, standardized external profile, (2) Disor harmonious profile, and occlusion. In this study, subjects were selected from a standardized external profile by gender because we believe that can eliminate many issues in facial esthetics. Esthetic preferences are based on the backgrounds of the evaluators (a specialist in art, a person involved in dentistry or medicine, and.
(10) THE HARMONIOUS PROFILE PART 1. 43. Table 11 Items which showed significant differences in the comparison of cephalometric measurements from normal, orthodontic, and all subjects. an untrained person etc.). De Smit and Dermaut4) reported that the esthetic preferences of the evaluator are not influenced by differences in sex or orthodontic knowledge. Dongieux and Sassouni5) reported that the esthetic evaluations (or opinion) are not influenced by differences in judge’s group characteristics (orthodontists, students, and artists). On the other hand, Foster7) reported that the judgments did differ depending on the evaluator’s background (orthodontists. and other groups). In this study, in order to avoid any bias by sex or orthodontic knowledge, the same number of males and females as well as the same number of students and orthodontists were selected to participate as evaluators (judges). 2. Results of the questionnaire The evaluations of harmonious profiles revealed the same ratios, 17–20% in the good group, 42–52% in the mediocre group, and.
(11) 44. M. NOMURA et al.. 31–40% in the poor group, regardless of whether subjects were normal or orthodontic patients. In this study, subjects with good occlusion were selected, but it seemed that there were disharmonious profiles in both normal and orthodontic subjects. Merrifield18) reported that, in facial esthetics, the good group was 25%, and the other group was 75%. Ito et al.11) reported that the good group was 83.7%, and the poor group was 16.3%. The results of our study were similar to Merrifield’s results18). The differences in evaluation of harmonious profile in facial esthetics in normal subjects and orthodontic subjects showed a similar percentage in the good group, a higher percentage in the mediocre group from normal subjects, and a higher percentage in the poor group from orthodontic subjects. These results indicate that the characteristics of normal subjects are favorable for a harmonious profile in facial esthetics. In the orthodontic subjects, the influence of malocclusion still slightly remained. 3. Differences between normal subjects and orthodontic subjects The results obtained in this study clarified why subjects with malocclusion underwent orthodontic treatment with nonextraction or extraction and included patients with a maxillary protrusion and a mandibular protrusion. There were differences in hard tissues between the good and poor groups from the normal and orthodontic subjects, but few differences in soft tissues. Yamauchi et al.30) has suggested that the total facial height was larger and the thickness of the root of the nose was thicker in normal adult males than in females but that the nasal height and the thickness of the chin region did not differ. In this study, the results indicated that the nasal height was higher and the thicknesses of the root of the nose and the thickness of the chin region were greater in males than in females. These differences were considered to be the results of individual differences and methods of measurement.. 4. Differences between the good group and the poor group Tsuchimochi29) suggested that the characteristics of the good group are high nasal height and good balance of the upper and lower lips and that the characteristics of the poor group are curled lower lip and a forward change in the chin. In this study, the males and females from normal subjects had, the characteristics indicated by Tsuchimochi for the upper and lower lips and the chin, but the nasal height did not differ. In this study, the distance of L1 to A-Pog was 2.53 mm, a smaller value than the one obtained by Ito et al.11), who reported that the distance of L1 to A-Pog was 3.7 mm after orthodontic treatment. The soft tissue has not been reported any study. A summary of Riedel21), Sebata et al.23–27), Kojima17), and Shirai28), who compared good groups and poor groups from the general public suggested that, in the good group, the upper and lower incisors inclined lingually, the edges of the upper and lower central incisors retruded to the basal arch more than in the poor group, the upper and lower lips inclined lingually, the upper and lower lips retruded, and the chin region was thicker than in the poor group. These suggestions fit the results obtained in this study with the exception of the inclination of lower incisors. In beauty contest participants, Riedel22) found that the maxilla protruded, the anteroposterior difference between the maxilla and the mandible was larger, the upper central incisors inclined lingually, the lower central incisors inclined labially, and the interincisal angle was larger. These conditions agree with the results of the good group in our study. It seems that one factor which influences the harmonious profile in facial esthetics is the inclination of the upper and lower lips, which is over 150° in persons with harmonious profiles and under 140° in those with disharmonious profiles in this study. Comparison of hard tissue measurements between the good and the poor group showed that the anteroposterior difference between the maxilla and mandible was larger.
(12) THE HARMONIOUS PROFILE PART 1. in the good group from normal subjects, but no differences were found in the orthodontic subjects or in the combined subjects. The edges of the upper and lower central incisors retruded to the basal arch in the good groups from normal subjects, orthodontic subjects, and all subjects. In the soft tissue and thickness of soft tissue measurements, many significant differences were found: the upper and lower lips retruded, the ratio amount of upper facial height to total facial height was larger, and the chin region was thicker in the good groups from normal subjects, orthodontic subjects, and all subjects. Therefore, we concluded that the positions of the edges of the upper and lower central incisors, the protrusion of the upper and lower lips, the inclination of the upper and lower lips, and the thickness of the chin region all influence the harmonious profile in facial esthetics.. REFERENCES 1) Altemus, L. (1963). Comparative integumental relationships. Angle Orthod 33, 217– 221. 2) Burstone, C.J. (1959). Integumental contour and extension patterns. Angle Orthod 29, 93–104. 3) Cox, N.H. and van der Linden, F.P.G.M. (1971). Facial harmony. Am J Orthod 60, 175–183. 4) De Smit, A. and Dermaut, L. (1984). Soft tissue profile preference. Am J Orthod 86, 67–73. 5) Dongieux, J. and Sassouni, V. (1980). The contribution of mandibular positioned variation to facial esthetics. Angle Orthod 50, 334–339. 6) Downs, W.B. (1948). Variation in facial relationships: their significance in treatment and prognosis. Am J Orthod 34, 812–839. 7) Foster, E.J. (1973). Profile preferences among diversified groups. Angle Orthod 43, 34–40. 8) Goldsman, S. (1959). The variations in skeletal and denture patterns in excellent adult facial types. Angle Orthod 29, 63–92. 9) Gottlieb, E. (1975). Grading your orthodontic treatment results. J Clin Orthod 9, 155–161.. 45. 10) Hambleton, R.S. (1964). The soft-tissue covering of the skeletal face as related to orthodontic problems. Am J Orthod 50, 405– 420. 11) Ito, K., Ueki, S., Tabe, T. and Yamauchi, K. (1977). A consideration with stabilized position of incisors after orthodontic treatment. Journal of Japan Orthodontic Society 36, 212–230. (in Japanese) 12) Iizuka, T. and Ishikawa, F. (1957). Point and landmarks in head plates. Journal of Japan Orthodontic Society 16, 66–75. (in Japanese) 13) Iwasawa, T., Nakakuki, M. and Matsumoto, Y. (1969). A study of lateral head plates of normal occlusion and malocclusions (Angle’s class I, class II, class III). Journal of Japan Orthodontic Society 28, 105–112. (in Japanese) 14) Jacobson, A. (1975). The “Wits” appraisal of jaw disharmony. Am J Orthod 67, 125–138. 15) Kayukawa, H. (1954). Roentgenographiccephalometric craniofacial morphology of Japanese part 1. application of Down’s analysis. Journal of Japan Orthodontic Society 13, 6–17. (in Japanese) 16) Kayukawa, H. (1955). Roentgeno-cephalometric craniofacial morphology of Japanese part II. application of Northwestern analysis. Journal of Japan Orthodontic Society 14, 6–12. (in Japanese) 17) Kojima, T. (1972). The morphology of the lower face contour by using lateral head plate. Orthodotology 59, 494–520. (in Japanese) 18) Merrifield, L.L. (1966). The profile line as an aid in critically evaluating facial esthetics. Am J Orthod 52, 804–822. 19) Peck, H. and Peck, S. (1970). A concept of facial esthetics. Angle Orthod 40, 283–318. 20) Powell, S.J. and Rayson, R.K. (1976). The profile in facial aesthetics. Br J Orthod 3, 207–215. 21) Riedel, R.A. (1950). Esthetics and its relation to orthodontic therapy. Angle Orthod 20, 168–178. 22) Riedel, R.A. (1957). An analysis of dentofacial relationships. Am J Orthod 43, 103–119. 23) Sebata, M., Kikuchi, M., Nogami, K., Harazaki, M. and Ichimura, K. (1969). Studies for establishing basis of construction of harmonious profile of Japanese. Journal of Japan Orthodontic Society 28, 61–67. (in Japanese) 24) Sebata, M., Kikuchi, M., Nogami, K., Harazaki, M. and Ichimura, K. (1969). Studies for establishing basis of construction of harmonious profile of Japanese. Journal of Japan Orthodontic Society 28, 239–253. (in Japanese) 25) Sebata, M., Kikuchi, M., Nogami, K., Harazaki, M. and Ichimura, K. (1970). Studies for establishing basis of construction of harmo-.
(13) 46. 26). 27). 28) 29). M. NOMURA et al. nious profile of Japanese. Journal of Japan Orthodontic Society 29, 1–12. (in Japanese) Sebata, M., Kikuchi, M., Nogami, K., Harazaki, M. and Ichimura, K. (1970). Studies for establishing basis of construction of harmonious profile of Japanese. Journal of Japan Orthodontic Society 29, 159–167. (in Japanese) Sebata, M., Kikuchi, M., Nogami, K., Harazaki, M. and Ichimura, K. (1970). Studies for establishing basis of construction of harmonious profile of Japanese. Journal of Japan Orthodontic Society 31, 87–104. (in Japanese) Shirai, T. (1974). The study of soft and hard tissue profiles on the lower face contour. Odontology 62, 625–648. (in Japanese) Tsuchimochi, T. (1984). The “Acceptable. Face” of Japanese female by using lateral head plate. Odontology 72, 421–442. (in Japanese) 30) Yamauchi, K., Ito, K., Suematsu, H. and Ozeki, S. (1967). Sex difference of Japanese adult profile with normal occlusion on cephalometric roentgenograms. Journal of Japan Orthodontic Society 26, 155–160. (in Japanese) Reprint requests to: Dr. Mayumi Nomura Department of Orthodontics, Tokyo Dental College, 1-2-2 Masago, Mihama-ku, Chiba 261-8502, Japan.
(14)
図


+5


関連したドキュメント
We also describe applications of this theorem in the study of the distribution of the signs in elliptic nets and generating elliptic nets using the denominators of the
We present sufficient conditions for the existence of solutions to Neu- mann and periodic boundary-value problems for some class of quasilinear ordinary differential equations.. We
Answering a question of de la Harpe and Bridson in the Kourovka Notebook, we build the explicit embeddings of the additive group of rational numbers Q in a finitely generated group
Analogs of this theorem were proved by Roitberg for nonregular elliptic boundary- value problems and for general elliptic systems of differential equations, the mod- ified scale of
Then it follows immediately from a suitable version of “Hensel’s Lemma” [cf., e.g., the argument of [4], Lemma 2.1] that S may be obtained, as the notation suggests, as the m A
Definition An embeddable tiled surface is a tiled surface which is actually achieved as the graph of singular leaves of some embedded orientable surface with closed braid
We give a Dehn–Nielsen type theorem for the homology cobordism group of homol- ogy cylinders by considering its action on the acyclic closure, which was defined by Levine in [12]
Correspondingly, the limiting sequence of metric spaces has a surpris- ingly simple description as a collection of random real trees (given below) in which certain pairs of
