Performance of Neural Networks
with Surrogate Data for Classifying time series data
Tomiyuki FURUGAKI† Tomoya TAKATA† Yoko UWATE† Yoshifumi NISHIO† Hidekuni TAKAO‡
†(Tokushima University) ‡(Kagawa University)
1. Introduction
Neural Networks (NN) can classify time series data. One of the challenges is understanding what the NN depend on for classification. In this study, NN is used as a classifi- cation models. The relationship between autocorrelation, frequency distribution and test accuracy for using NN with surrogate data focus on.
2. Proposed Method
In this research, three types of time series data are clas- sified using NN. Each time series data is sampled at a fre- quency of 1000[Hz]. Four types of surrogate data are cre- ated. The following methods (a), (b), (c) and (d) describe how to build these four types of surrogate data.
(a) Random Shuffle Surrogate Data (RSSD)
x(n) means time function. n means time. The order ofn is changed randomly by the RSSD data. RSSD has broken the autocorrelation of the data.
(b) Fourier Transform Surrogates Data (FTSD)
Equations (1) and (2) show discrete Fourier Transform (DFT) and Inverse Discrete Fourier Transform (IDFT).k means frequency. N (= 5000) means the number of the samples.
X(ω) =
∑n
n=1
x(n)e−i2πknN (1)
x(n) = 1 N
∑n
n=1
X(ω)ei2πknN (2) Step 1. Calculate DFTX(ω) ofx(n).
Step 2. Randomize the phase ofX(ω).
Step 3. Calculate IDFT randomizedX(ω).
FTSD was implemented using the previous steps. It breaks the frequency distribution of the samples.
(c) Amplitude Adjusted Fourier Transform Surrogates Data (AAFTSD)
Step 1. Prepare random numbers R(n) according to the standard normal distribution.
Step 2. SortingR(n) in the same size relation asx(n).
Step 3. CreateR′(n) which is FTSD of sortedR(n).
Step 4. Sortingx(n) in the same size relation asR′(n).
AAFTSD also breaks the autocorrelation of the data but to a lesser extend than the RSSD method.
(d) Iterated Amplitude Adjusted Fourier Transform Surro- gates Data (IAAFTSD)
Step 1. Prepares(0)which is RSSD of original data as the initial value.
Step 2. Calculate DFTS(i) ofs(i).
Step 3. Replace amplitude ofS(i) with amplitude of orig- inal. Put it as S(i)
Step 4. Calculate IDFTs(i) ofS(i).
Step 5. Sorting s(i) in the same size relation as original data.
Step 6. Add 1 toi.
Step 7. Repeat untili=∞.
Using this method, the data stays autocorrelated to a better degree than with the AAFTSD method. Even better results are achieved asiincreases.
3. Simulation Result
In this study, three time series data are classified. Six hundred pieces of data that have 5 seconds each are pre- pared. Table 1 shows ten-times-averaged test accuracy re- sults. It can be seen that RSSD test accuracy is lower than that of the other time series data, while the other methods present test accuracies similar with the original time series data.
Table 1: Test accuracy
test accuracy(%) original data 88.9
RSSD 34.5
FTSD 87.5
AAFTSD 88.8
IAAFTSD 89.0
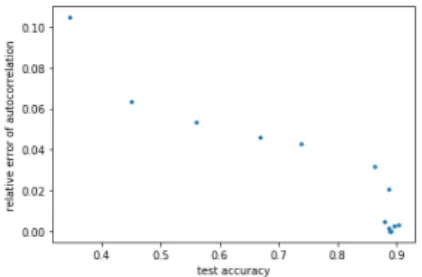
Figure 1 shows the relationship between test results and autocorrelation relative error of surrogate data. While the AAFTSD method leads to an autocorrelation relative er- ror of 0.0017, the RSSD method shows an autocorrelation relative error of 0.1200. In order to obtain data with auto- correlation relative error in between those two values, the AAFTSD method is consecutively applied several times to the samples to obtain desired deterioration of the autocor- relation. Figure 1 shows if the relative error exceeds about 0.02, the accuracy of the test is significantly reduced.
Figure 1: relative autocorrelation and test result 4. Conclusion
In this study, we carried out a 3-value classification of surrogate data. We understood that test accuracy of FTSD was about the same as that of original time series data.
Therefore, it was understood that NN didn’t recognize fre- quency distribution. In addition, if the relative error ex- ceeds about 0.02, the accuracy of the test will be signifi- cantly reduced.
令和2年度電気・電子・情報関係学会四国支部連合大会 講演論文集 (愛媛大学) 2020 SHIKOKU-SECTION JOINT CONVENTION RECORD OF THE INSTITUTES OF ELECTRICAL AND RELATED ENGINEERS (EHIME UNIV.)