ソシオサイエンスVol.6 2000年3月 109
品詞文
The Effects of Fiscal Equalization Grant System in
Japan and the Possible Simpliflication of
Allocation Formulas
Masahisa Hayashi
Introduetion
The purpose of this paper is to show the wide differentials in fiscal capacities among local author・
ities in Japan on the basis of the data for individual local authorities, to analyze the effects of the pres−
ent fiscal equalization grant system in Japan ca且1ed Local Grant Tax in rectifying the differentials,
and to probe for the possible ways of simplification of the very complicated present system.
Japan s economy has been in a deep depression for almost a decade after the bursting of the so・
called Bubb且e Economジ. It is not only the short−term cychcal factors that are causing a variety of problems in Japan today, but also the structural factors. The institutional fatigues have become apparent in many areas of the Japanese s㏄iety. The extreme centralization that has characterized the political and administrative system of Japan in the past has indeed brought enormous successes to Japan in her modernization pr㏄ess after the Meiji Restoration of 1868 and then again in the process of her recovery after the defeat in the Second World War in 1945, but it may not be an effective system any more in today s global and extremely diversified economic and social life in Japan. Japan faces to−
day difficult cha且lenges of carrying out drastic refbrms in many areas of her society. The relatlonshlp between the centrai government and the 1㏄al government is one important area that requires such drastic reforms.
1:Pをomotion of D㏄entrdization
In the process of her modernization and development that has been characterized by the extreme celltralization, the central government has exercised the powers and resorted to the fiscal resources to contro且10cal authorities with to the specific detans. The central government agencies have passed the nationanaws specifying the quality and the quantity of the services that they have considered their re−
sponsibilities to supervise, even though these are directly provided by the 且ocal authorities, and in・
sisted that the.s捻ndards set by the central government agencies be implemented precise且y in every corner of the country. The so−called national minimum standard had to be provided by alnocal au−
thorities, and the central government agencies have used every means possible to control local author−
ities by. On the other hand, under such conditions of political practices, the local authorities have nurtured the mentality of excessive reliance on the patemalism of the central government. Instead of
110
making efforts to increase艮ocal taxes by inducing industries to their jurisdictions and developing the local economies, they have found it much easier to rely upon the fiscal resources rea亘1㏄ated and granted by the centra且government to them either through the general grant system fbr equalizing fiscal capacities of local authorities or through the specific grants earmarked to the provisions of particular local services. One important source of reall㏄ated fiscal resources has been the fiscal equalization grant ca旺ed日Local Grant Tax in Japan, and the other major source is specific grants called National
Treasury Expenditures and Prefectural Treasury Expenditures whose uses by the且oca且authorities
are earmarked to particular purposes. The latter has been a very powerful means for the central gov−crnment agencies to contro1且oca且authorities by so that the loca豊authorities provide specific 1㏄al serv−
ices to the nationa且minimum standards set by them in national laws, ordinances and administrative guidance.
With the prolonged economic crisis, Japan has belated且y started to address the structural reforms ill various areas of the society. The decentrahzation of powers from the central government to the local authorities is one of the areas for which a significant reform is intended, and a series onaws have been passed by the National Diet to liberate local authorities from various kinds of controls by the national government agencies so that the且oca且authorities can practice local autonomy more exten・
sively, As for the corresponding reallocation of fiscal resources, no specific laws have been passed yet. Though the reduction of the number and the amount of specific grants has been recommended again, such recommendations have been made many times in the past with little effects. New specific grants are created while some old ones are abolished. So far as there is a very strong desire on the part of the central government agencies to contro且the level and the substance on㏄al services for which they consider themselves responsibie, and so far as there is a strong tendency on the part of lo−
cal authorities to rely upon the reallocation of fiscal resources even though they are earmarked, it is difficult to reduce or abolish specific grants.
To the students of local autonomy or loca且government finance, a・very familiar di且emma has been the one between the demand for loca且autonomy as a political value and the demand for the provision of local scrvices to the national minimum standards under the dire reality of prevailing wide differentials in fisca且capacities among local authorities. In this paper, the author first examines the rea且ity of wide diffcrentials in fisca且capacities among loca且authorities, and then the degree of fiscal equa且ization real−
izcd by the existing local grant tax system in Japan. And finally, possible ways of simp且ification of the present extremely complicated且oca且grant tax system are examined by some simulation analyses.
2:Strueture of L㏄al Autho[直des
In this paper, the analysis is conducted for the second−tier且ocal authorities in Japan, name且y cities,
towns, and vil且ages. In the local government system in England and Wales of the United Kingdom, the firsしtier local authorities are ca且且ed Counties and the second−tier local authorities 騒Districts . Though the second−tier loca且authorities in Japan are called℃ities, Towns, and Vi1且ages , the word
Municipalities is used interchangeably hereafter with the term Second−tier Local Authorities to de−
notc thc three categories of the second−tier loca且authorities instead of repeating℃ities, Towns, and Villages . In spite of a series of integrations that were carried out after the Meiji Restoration of 1868 and the end of the Second World War, the number of the second−tier local authorities is still quite
The Effects of Fiscal Equalization Grant System正n Japan and the
Possible Simplinication o「A1且㏄ation Formulas l11
1arge amounting to 3,255 as of 1997 fiscal year. The data for the year are the most up−to・date ones available at the time of writing this paper 1. The 23 Special Districts of Tokyo Metropohtan Gov−
ernment are different from other second・tier l㏄al authorities in the powers and the fiscal resources,
and they are excluded from the analysis in this paper reducing the number of the second−tier local au−
thorities to 3,232. In addition to 23 special districts of Tokyo Metropolitan Government,12
Ordinance−designated Cities are also excluded from the analysis below. These 12 0rdinance−designated cities are the large cities with the population above half a mi且1ion and are empowered to perform the functions that are ordinarny anocated to the first−tier local authorities, or Prefectures . They include among the others the functions on the welfare of chi且dren, the physica且且y handicapped, the mentally handicapped, the single−parent fami且ies, the old people, the city planning, the prevention of epidemics. By excluding 23 special districts of Tokyo Metropolis and 120rdinance−designated cities,
the tota且number of the second−tier且ocal authorities, or municipahties analyzed below amounts to 3,220 as of 1997 fiscal year.
The data for individual local authorities has become availab且e to the general public sincc only a few years ago 2. The scope of avai且able data items differs greatly between cities and the rest of the second−tier local authorities classified as towns and villages. The data is available for many more items for cities, but the data available for towns and villages is much more且imited. Because all the second−tier local authorities including cities, towns and villages are subjected to the following anaiyses,
the avai且able data is reduced to the scope of the data for towns and villages. The data for the detailed breakdown of expenditures by purpose and the data of revenues for different taxes cannot be used be−
cause of the limited availabnity of data 3.
3:Revenue80f L㏄al Authorides
Table l shows the breakdown of the sums of the revenues of 3,220 municipahties in Japan for the year. Total revenues amounted to 39.14 trinion yen. The sum of local taxes,10cal transfer taxes and local grant taxes is called the℃eneral Fiscal Resources . They are regular and recurrent revenues and constitute the core of the fiscal resources of local authorities and account for 57,36%of the total revenues of these loca且authorities. The major fisca且resources of the rest of fiscal resources or the non−general fiscal resources are national subs玉dies accounting for 8.29% and prefectura且 subsidies accounting for 5.79%, both of which are specinc grants whose uses are earmarked. The local debt
1 As for the changes in the categories and the number of loca且authorities, refer to Jichi Sho Zaisei Kyoku Hen,
C痂㎞Zαf5θ πo S薦々κ煽20∫oπoひ麗f翔。∫ μα (Finance Bureau of Ministry of Home Affairs ed.,丁加卵s 2鋭σ め。α星(初2η3㎜ F伽α吻εα旗! 勉1〜εα ¢yげ1 s/1dり所 誌 m 伽),Chihou Zaimu Kyokai,1980, pp,10−13. For exam・
ple, there were 71,497 municipa且ities as of 1883(Meiji 16),
2 The data used for the following analysis is taken from the CD−ROM version of the annua且statistics book titled ∫み鷺ぬ030銘Bθ 5 κ25εα館∫yo勧。 S削70b8(∬π9癖7ゴ2s 7吻∫加∫8 f惚4・4 o露濯3妙αfi8s, Tou励s,α淵41/ Z毎825)published by the Ministry of Home Affairs. The latest data is the one for 1997 fiscal year.
3 The author has made similar analyses with the data acquired from the Ministry of Home Affairs for l995 fiscal year and l993 fisca且year. cf.℃hapter 9 General Grant, The Structure and the Significance of local grant tax,
Cんf伽Zbf5画1〜o鶴,1〜 70π,∫8毎。,ノf53ん。(Loごα Gσり㎜9麗例 F℃7協7膠8,丁廟, Sンsf佛απd E〃ゆ」7鷺α Aπα1ツ5θ5),Gyosei,
1999; Economy of Sca且e in Provision of L㏄a且Government Services , Keizai to Boueki(εcσ㎜)Pαπd T7αdρ)No.
168,1995.The data acquired ffom the Ministry of Home AIfairs is Inuch more detaned than the data publishcd recently in the form of CD・ROM.
T8Ue l Revenues of the Second,廿er Loca且Autllorities 1997 Fiscal Year Revenue Itenls Amount(Thousand Yen) Percentages of
sotal Revenues(%)
Local Taxes 14,188,485,769 36.25
L㏄al Transfer Taxes 549,737,914 1.40
Loca且Grant Taxes 7,712.531glO4 19.71
Ordinary
6,901,242,932 17.63Extraordinary 811,288,172 2.07
Total Genera且Fiscal Resources 22,450,754,787 57.36
Charges
696,136,173 1.78Fees
52,979,679 0.14.National Subsidies 3,242,891,211 8.29
Rrefectura且Subsidies 2,264,641,636 5.79
Miscellaneous 1,681,732,077 4.30
Local Debt 4,525,724,761 11.56
Tota1 Revenues 39,137,466,529 loo.oo
TaUe 2 Differentia且s in Fisca且Resources among L㏄a[Authorities for l997 Fiscai Year (Per Capita Amount, Unit:Yen)
L㏄a且Tax Revenues Standard Fisca且Resources
Average
111,363 101,320Maximum
1,201,746 930,469Minimum 30,488 35,222
Standard Deviation 69,902 51,099
Coefficient of Variation 0.6277 0.5043
accounts for 11.56%, and under the current fiscal difficulties of loca且authorities, the share of loca且 debt revenues in the total revenues has been kept at a very high level and is stnl rising.
4:Wide Diffbrentials in Fiscal Resources among L㏄a置Authorities
In a sense, the genuine local autonomy is practiced if local authorities have the perfect local dis−
cretion in providing loca且services to their inhabitants with their own local revenues. Though charges and fees are also genuinely local own revenues, they constitute only a very minor part of the revenues of local authorities accounting for 1.78%and O.14%respectively of the total local revenues as shown in Table 1, and the且ocal debt revenues constitute the advance collection of future local taxes. Thus the author will use in the analysis below the local tax revenues as a representative variable for the own fisca且resources of local authorities.
Table 2 shows the differentials of per capita local tax revenues among 3,220 second・tier loca且au,
thorities as of 1997 fiscal year. Instead of showing individual values for 3,22010ca且authorities, the average, the maximum, the minimum, the standard deviation, and the coefficient of variation are calcu一 且ated as the statistics describing the features of 3,22010cal authorities. As is shown in Table 2, the average of per capita local tax revenues is 111,363 yen and of per capita standard fiscal resources 101,320, Because the standard fiscal resources are calculated by app且ying the standard tax rates and multiplying by the ratio of O.75, the value for standard fiscal resources is lower. The average con−
ceals wide differentials existing among local authorities with the maximum of l,201,746 yen and the
The Effects of Fiscal Equa且ization Grant System in Japan and the
Possib且e Simphflication of Anocation Formu且as 113 Fi『ロre l Distribution of L㏄a且Taxes among Local
Authoritjes
G㎞iCo●f価●r成=0.1799
・。痰T︾卍x・ト石刀︒&359δユ︒奪Eξ6 100
go 80 70 60 50 40 30 20 10 0
0 10 20 30 40 50 60 70 80 90 100
Cummu18廿vo P●rc●欲8800f Popu始㎞
min三mum of 30,488 yen for per capita local tax revenues and 930,469 yen and 35,222 yen respectively for per capita standard fiscal resources. The coefficients of variation are as high as O.6277 and O.5043respectively.
The unequal distribution of tax revenues can be depicted by the wel且一known Lorenz curve, and the degree of unequal distribution can be expressed by the Gini coefficient. Figure l depicts the distribu・
tion of tax revenues among 3,220 second−tier local authorities with the Gini coefficient of O.1799. The local authorities are realigned in the order of per capita loca且tax revenues a且ong the horizontal axis,
The cumu且ative percentages of population of these local authorities are taken for the horizontal axis and the cumulative percentages of Iocal tax revenues fbr corresponding loca且authorlties fbr the verti−
cal axis. By plotting the combination of the cumulative percentages of population and of tax revenues,
the Lorenz curve is depicted. As is well known, if the distribution of 1㏄al tax revenues is perfect且y equal among the local authorities in terms of per capita amount, the Lorenz curve lies on the diagona1 置ine. The further away the Lorenz curve置ies from the diagonal line, the more unequal is the d丘strlbu・
tion. The Gini c㏄fficient is calculated by dividing the area of the crescent surrounded by the Lorenz curve and the diagonal line by the area of the triangle be皇ow the diagonal line. The area of the cres・
cent was calculated indirectly by subtracting the area below the Lorenz curve. from the area of the triangle. The area below the Lorenz curve can be divided into the area of one triangle and the areas of 2,199 trapezoids and the sum of them is approximated for the area below the Lorenz curve.
53D恥tHbu on of Tot記Expenditures㎜ong Iρc81 AuUlori es
The classical loca塾autonomy wou且d require local authorities to provide 1㏄a且services subject to the constraints of the fiscal revenues raised independently within their l㏄al jurisdictions without the transfer of fiscal resources from national government or prefectural governments. The major revenue
醗g悶re 2 Distribution of Total Expenditures among L㏄al Authorities
G繍Oo酬引醜=0.1808 100
■ぢトも亀35pる巳●ξ﹄ヌ5竃δ
go 80 η
δo
50 40 30 20 10
0
一. 1
一
1
1
剛
一 .
.一 一
0 10 20 30 40 50 60 70 80 90 100 CUmmub価》●P●rc●r圃凶9●ofρopubtlon
source is local tax revenues whose distribution among且oca且authorities has already been depicted in Figure 1. But the loca且authorities today have other revenue sources such as local grant tax revenues・
specific grants such as national subsidies and prefectural subsidies, local debt revenues・and others・
As the results of such fiscal resources avai且ab且e, the distribution of the total expenditures among local authorities is entirdy different from that onocal tax revenue distribution.
Figurc 2 depicts the distribution of total local expenditures with the Lorenz curve, and the corre−
sponding Gini coefficient is calculated. This is an ordinary Lorenz curve. The local authorities are aligned in terms of per capita total expenditures from low to high along the horizontal axis. Tbe Lorenz curve is depicted by the combination of the cumulative percentages of the population of且ocal authorities thus aligned horizontally and the cumulative percentages of廿1e total expenditures of the same local authorities. The Gini c㏄fficient is calculated to be O.1808 that is slightly higher than that oHocal tax revenues. Asimple comparison of the Gini c㏄fficients wi111ead to the wrong conclusion that the fiscal equalization by the loca且grant tax in fact made the distribution of fisca且resources more unequal.
6:The Effbcts of Re81置㏄8tion①f Fiscal Regource8 and the Quasi Lorenz Curve
The comparison of Figure l depicting the distribution of tax revenues and Figure 2 depicting the distribution of total expenditures is very misleading in showing the degree of reallocation or redis−
tribution of fiscal resources. The且ocal authorities with the lowest per capita tax revenues often be−
come the ones with the highest per capita total expenditures as the result of reallocation of fiscal re・
sources, For example, Isen Town ranks at the lowest position in terms of per capita local tax rev−
cnues with the amount of 30,488 yen, but in terms of per capita total expenditures it ranks at the
The Effects of Fiscal Equalization Grant System in Japan and the
Possible Simpliflication of All㏄ation Formulas l15
Fiεure 3 The EIfec鱈of Re・allocaUon of Fisca阻Resources αni =O.1790
0L齢5i Gin6 Cb●950i●r7t=一〇.0814 100
●O
@mW η ●0 50 40 30 20 10 0 3雲−ぢト
コ■●§●︾●αX●レ■00﹂も●●ぎ●匹●︾畢メ雷E5Q
0
コ
go oo…鴇
伽㎡ 4・
働
鮭
10
2,101st from the lowest with the per capita amount of 62,9535 yen. On the other hand, Haku Village with the highest per capita tax revenues of 1,201.746 yen ranks at the 3,176th in terms of per capita total expenditures with the amount of 2,306,555 yen. As the ranking of local authorities in terms of per capita amount is entirely different between the 1㏄a且tax revenues and the total expenditures。 the ordinary Lorenz curve and the corresponding Gini coemcient are mis且eading in expressing the degree of rea11㏄ation of fisca且resources. In the redistribution of income or wea且th among individuals, the rピ・
distribution would not be carried out to the extent of changing the rankings of individuals in terms of per capita amount before and after the redistribution. Usuany the Lorenz curve depicting the dis・
tribution of either income or wea且th after the dehberate redistribution to achieve a more equa且distribu・
tion hes closer to the diagona目ine and above the Lorenz curve depicting pre−redistribution income or wealth distribution. But the reallocation or redistribution of fiscal resources by the local grant tax is carried out excessive且y in the sense of changing the rankings in per capita amount compietely.
ln order to more accurately measure the effects of the reanocation of fiscal resources, a modificd version of the Lorenz curve is used and is called幡Quasi Lorenz Curve . On the horizontal axis, the cumu且ative percentage of popu且ation is taken in the order of the per capita且oca且tax revenues. On the vertica且axis, the cumu且ative percentages of total expenditures that correspond to the local authorities that are ahgned in the order of per capita local tax revenues are taken. The quasi Loren2 curve for total expenditures is depicted in Figure 3 in comparison with the Lorenz curve depicting the distribu・
Uon of且㏄al tax. The a且ignment of且oca且authorities along the horizonta且axis is the same for both Lorenz curves. The quasi Lorenz curve hes above the diagonal line implying that there is such an ex・
tensive rea且且ocation of fiscal resources that those l㏄a且authorities with low per capita local tax re・
venues may enjoy higher per capita total expenditures after the reallocation of fiscal resources 4. The
4 The author first used the quasi Lorenz curve when he analyzed the relationship between the prohtability and the size of corporations. cI.齢Ana量ysis of deficit corporations脚,κε惣α oβ襯凸唯(εご07㎜夕α7眩丁7ロdの,No,166,1994
116
ordinary Lorenz curve depicting the distribution of 1㏄al tax revenues lies below the diagonanine.
The degree of rea且i㏄ation of fiscal resources can be expressed in a number of alternative measures, Avariant l measure is expressed by the ratio of the area of the crescent surrounded by the quasi Lorenz curve above the diagonal line and the diagonal line divided by the area of the triangle below the diagonal hne. To follow the same pr㏄ess of calculation of an ordinary Gini coefficient, the area surrounded by tlle quasi Lorenz curve and the bottom hne and the right vertical line is subtracted from the area of the triangle below the diagonal line. As the quasi Lorenz curve lies above the di・
agonal line, the area below the quasi Lorenz curve is larger than the area of the triang且e below the di・
agonal line and thus the numerator takes a negative value. The area below the quasi Lorenz curve is calculated to be 5406.85. If this va且ue is subtracted from the area of the triangle 5000, it becomes
−406,85. One measure of the quasi Gini coefficient would be the value calculated by dividing−406.85 by the area of the triangle 5000, and it becomes−0.0814. The minus sign implies that the quasi Lorenz curve lies above the diagonal line. The rea11㏄ation of fiscal resources by the local grant tax system is so extensive that the rankings of local authorities in per capita amount are almost reversed.
The redistribution of income or wealth.would not be made to such an extent among individuals.
The variant 20f the measure of such an extensive reallocation of fiscal resources to the local au−
thorities would be the ratio calculated by dividing the area surrounded by the quasi Lorenz curve and the bottom horizontal line and the right verticaHine or 5,406.85 by the area of the triangle be且ow the diagonal line or 5,000. The value becomes 1.0814. The fact that it is over 1.O suggests that the quasi Lorenz curve lies above the diagonal line and the degree of reallocation of fiscal resources by the local grant tax is very extensive, even excessive.
The degree of the redistribution either by tax policies or welfare policies is measured by compar・
ing the Lorenz curve showing the distribution before the redistribution and the Lorenz curve showing the distribution after the redistribution policies. The difference between two Gini coefficients may be one measure showing the degree of redistribution accomplished by such redistribution policies. If the Gini coefficient is O.20 before the redistribution and O.15 after the redistribution, the difference of O.05二〇.20−0.15may provide a good measure for the improvement of distribution. This is equal to calculating the coefficient of the area surrounded by two Lorenz curves divided by the area of the triangle below the diagonanine. In the case of the quasi Lorenz curve expressing the distribution of fiscal resources after the distribution, the area be且ow the quasi Lorenz curve is 5406.85 and the area below the ordinary Lorenz curve showing the distribution of tax revenues is 4100.44. Thus the dif−
ference(5406.85−4100.44)=1306.41 divided by the area of the triangle below the diagona且1ine 5000 would be O.2613 and this measure may be used as the variant 3 for expressing the degree of reallo−
CatiOn Of fiS(;al reSOUrCeS.
On Figure 3, the quasi Gini coefficient of the variant l or−0.0814 is shown to express the exten−
sive reallocation of fiscal resources by the loca且grant taxes and other fisca且resources such as national subsidies and prefectural subsidies.
7:Geneml Fiscal Resour¢es and the S¢ope of Disαetion fbr Loeal Expenditure8
The institution caned local grant tax is the general fiscal equalization grant system in Japan. It reallocates fiscal resources to 1㏄al authorities as unearmarked local revenues unlike the natiGnal sub・
The Effects of Fiscal Equalization Grant System in Japan and the
Possible Simpliflication of Anocation Formulas 117
5
4.5
4
a5
3
・。Z五翌5Σ
25
2
1.5
Figure 4 The Multiples of Total Expenditures to Standard Fiscal Needs
1
一黒.§§§§奪§§…i羅§§霧塁婁§§嚢婁i垂二塁藝§.塁嚢§暑≡i§.§窯§§§§§i罠§i§§霧
Sooond一価er l.ocal Author而●s(in the Ordbr 1セom Low to High)
sidies and the prefectural subsidies whose uses are earmarked. The local grant tax system alms to equalize the fiscal resources to provide the loc盆夏serviceS that are supposed to be met by the general fiScal resources, and cofrespondingly the standard fiscal needs are measured to meet the standard levels of the local services to be provided by the general fiscal resources. As was shown, though the 9,。,,al fiscal.@res・urces acc・u・t. ?・・a画・・pa・t・f t・t・1.1・cal・ev・nues, th・y acc・unt f・r・nly 57・36%・
and there is still substantial room for local authorit孟es to. ヘdjuSt the levels of their total expenditures by.resorting to other fiscal resoμrceS(refer to Table 1). Loρal authorities can rely upon such rev−
enues as nationa1§ubsidies, prefectural sμbsidigs and local debt.revenues. There are charges, fees and.miscellaneous revenues as other non・general fiscal resources that enable local authorities to make additional expenditures to the expenditures gnabled by the general.fiscal resources・
Fi琴11re 4 depicts the multiples of the total local expepditur俘s to the standard fiscal needs calcu−
lated by the formulas of the fiscal grant tax system to individual local.孕uthorities. On the horizontal axis,3,220 second・tier local authorities are aligned in the order of the multiples of total expenditures to standard fiscal needs from茎ow to high..The lowest multip垂e is only.1.30 for a certain village na!hed Hachikとi Village , and the highest mul士iple is 4.74 for a certain town named Takashima Town . Tke average is 1.98 and the coefficient of variation is O.18071 We may conclude that there is substantial room ambng the loeal auth6rities to adjust tレe scale of total e)φenditures in spite of the fact that their general fiscal resources are equalized rigorously by the complicated formulas of the lo−
cal grant tax syste耳1 for. individual local authorities・
.Takashima Town shows the highest multiple of.4.74 and.the composition of its revenue sources ls interesting. In thとtotal revenues 6f 5.56 billion yen, the藍ocal tax revenues account for only O・92%・
local 廿ansfer tax..0.11%, local grant tax 24.41%, or the total.general fiscal resources account for 25.45%. トIon・general fiscal resources account f6r a much higher percentage of 74.55%, among which
Figure 5 Standard Fiscal Needs and Tota且Expenditures 20
19
18
17
16
15
14
13
︵5>翌386︶ε5τ島3で3⁝ε●窪ξに蓋薯レ
12
「. y=1.0396x←α0727
@ 浮=α9659
◆
◆◆
8◆
Q一
○◆・一一一一一◆一
◆ ◆ ◆
.需
○
一..
12 13
14 15 16 17 18
Sねr加』臼8c81 N●●d8 in N8t鱈ml L◎88r軌m(Thou8aod Y●o)
19 20
are national subsidies accounting for 19.00%, prefectural subsidies 1.40%, local debt revenues 21・95%.
Thus, one way to choose the level of total local expenditures by local discretion is by means of non−genera且fiscal resources such as nationa且subsidies, prefectural subsidies and local debt revenues・
In fact, many heads onocal authorities boast of spending much more than the amount that the local tax revenues, or the general fisca且resources enable them. Particular且y, to secure as much national sub−
sidies and prefectural subsidies as possible is a very important part of the jobs of the heads of local authorities.
Figure 5 shows the scope of discretion of local authorities in determining the levels of total expen・
ditures in a different way. The scattered diagram shows 3,22010cal authorities by the combination of standard fiscal needs on the horizontal axis and total expenditures on the vertical axis. Both are ex−
presscd in natural logarithm to separate these local authorities on the scatter diagram. The diagonal line is depicted showing the equality of the standard fiscal needs to the total expenditures. A1110cal authorities lie above the diagonal line suggesting that al且of them spend more than standard fiscal needs. For the same且evel of standard fiscal needs, the levels of total expenditures are very different for individual local authorities. As is shown in Tab且e 3, the average multiple of tota且expenditures to standard fiscal needs is 1.98, the maximum 4.74 and the minimum l.30.
The regression hne is calculated below. These two are very closely related and the coefficient of determination is O.9659. The estimated c㏄fficient of or the standard fiscal needs is 1.0396, which suggcsts that the standard fiscal needs elasticity of total expenditures is about 1.04. The values in the parentheses be且ow the estimated coefficients are t−values.
y=0.0727十1.0396κ
(1.3998)(302.12)1〜2=0.9659
The Effects of Fisca且Equalization Grant System in Japan and the
Possib且e Simplinication oI A11㏄ation Formulas 119
81Fomu188 br the A11㏄8偵on of L㏄al Gmnt T8x and止e i弛ol祀br L㏄81 Discretion
As has been pointed out before, the Japanese fiscal equaLization system called嶋local grant tax aims to equalize the fiscal resources to meet the expenditures for the services to be provided by the general fiscal resources. The general fiscal resources are defined to be the sum of the revenues from 且ocal taxes,1㏄al transfer taxes and local grant taxes. The local authorities can resort to other fiscal resources such as national subsidies, prefectura且subsidies and且ocal debt revenues to provide addition・
al services.
The basic idea of the local grant tax is to supplement the deficiency of general fiscal resources for the expenditures for the services to be provided by the general fiscal resources・ In essence・the amount of 1㏄al grant tax for individual loca且authorities is the difference between the standard fiscal needs and the standard fiscal resources. Since the total amount of the fiscal resources to be allocated as local grant tax is defined to be certain percentages of the revenues of five national taxes・the suffi・
cient fiscal resources to fill the gaps between the standard fiscal needs and the standard fiscal rc.
sources are not necessarily guaranteed. The total amount to be anocated as local grant taxes is the sum of 32%of the revenues from the nationaL individual income tax, the national corporation income tax and the nationaniquor tax, and 29.5%of the revenues from the consumption tax (the Japanese version of the consumption・type value added tax)and 25%of the tobacco tax revenues. If the stan−
dard fiscal needs and the standard fiscal resources are not equal, then the且ocal grant taxes are allo・
cated to 1㏄al authorities in proportion to the amount of their deficiencies.
To calculate the amount of standard fiscal needs for individual loca且authorities, a nctional bench・
mark local authority providing standard levels of l㏄al services is introduced. For the second・tier lo・
cal authorities, this fictional benchmark local authority is assumed to have the popu且ation of 100,000 and the land area of l60 square kilometers, and it is assumed to provide standard local services under the standard conditions in terms of popu且ation, the number of households, population density■and area, changes of population and the dimate among the others. The levels of various local services that this fictional benchmark local authority must provide under the prevailing laws and ordinances are de・
termined, and the corresponding fiscal needs are ca且culated・
But the actual local authorities are different in many respects from this fictiona且benchmark local authority. The 1㏄al grant tax applies a variety of adjustment coemcients to renect the actual con・
ditions that are different from this benchmark local authority and under which actual local authorities operate. In this paper, the detaiis of such fbrmωas are not discussed, but to give some examples the conditions that affect the costs of providing the same standard onocal services, such as population density, changes of population, the modes of l㏄al authorities such as whether they are cities. towns or vinages, the climate conditions such as coldness in winter are considered for the adjustment to reflect the cost of providing the same level of local services in these particular local authorities. By app且ying anumber of adjustment coefficients that renect different conditions under which individual local au−
thorities are operating, the standard fiscal needs are calculated for them. The scopes and the levels of loca置 services are standard, and individual local authorities have the discretion to provide the local services in higher quality and in higher quantity resorting to the fiscal resources other than the local grant taX reVenUeS.
120
The other factor determining the amount of local grant tax is the standard fiscal resources that are a且so calculated for individuanocal authorities. They consist essentially of the且ocal tax revenues.
Local authorities adjust the amount of local tax revenues by choosing their own tax rates. Thus, for the calcu且ation of standard fiscal resources, the standard tax rates are used instead of actual tax rates apPlied in local authorities, thereby calculating the potential tax revenues rather than the actual tax revenues.
The Japanese Local tax system aims to meet two cGnflicting objectives of at t1」e same time mainmin・
ing some degree of national uniformity in terms onocal tax rates and of giving individual local author・
ities some scope of discretion in the choice of tax rates. For almost a1110cal taxes, the standard tax rates are prescribed in the tax laws. Some taxes have ceiling rates prescribed as well, thereby giving aband of tax rates for the discretionary choice by local authorities. Though the loca且authorities are not completely free and choose whatever tax rates they want to apply to the tax bases, they are free to choose the tax rates other than the standard rates if they are below the ceiling rates. With the recent promotion of decentralization to local authorities, these ceiling rates have been abolished for more local taxes.
Another important aspect with the standard fiscal revenues is that only 75%of the potential tax revenues thus calculated on the basis of standard tax rates is included as the standard fiscal re−
sources. This percentage is 80%for prefectures, or the first・tier local authorities. Though we do not analyze prefectures in this paper, there are only 47 prefectures including Tokyo Metropolis. Thus the second−tier local authorities that amount to 3,220 are much more diversified than prefectures, and the higher percentage of the potentiai tax revenues is置eft out of the standard fiscal resources to be used at the discretion of the.second−tier local authorities to cope with more diversified fiscal needs which they must meet.
The amount onocal grant tax allocated to individual local authorities is calculated by the follow−
ing formula.
Standard Fiscal Needs−Standard Fiscal Resources =Fiscal Deficiencies
=Local Grant Taxes
Of course, the sum of standard fiscai needs of an locai authorities and the sum of standard fiscal resources of all local authorities do not necessarily match. But as the Ministry of Home Affairs wants to give the institution of local grant惚x system the function of fiscal guarantee to the local authorities,
the calculation is made so that the difference between two sums becomes very small or almost negligi・
ble.
9:Comparison of Standard Fiseal Needs 8nd Sセmd飢・d Fiseal Resources
The Ministry of Home Affairs uses the index expressing the degree of fiscal deficiency of each local authority called Fiscal Capacity Indeズ. It is the index showing the ratio of the standard fiscal resources to the standard fiscal needs. The poorer a local authority is, the且ower is this ratio, or the nscal capacity index. It is an average of the past three years and therefore is slightly different from the ratio of a particu且ar year. But the fiscal capacity indexes have naturany very high corre且ation coefficient with the annual ratios of O.9963. In the analysis be且ow, the ratios of fiscal year 1997 are
The Effects of Fiscal Equalization Grant System in Japan.and the
Possible Simpliflication of A11㏄atio1耳Formulas 121
8譲
2.5
2
t5
1
0.5
0
Eigure 6 The Rations of Standard Fiscal Resources to Standard Fiscal Needs
むロ ゆ りほりロリロリロ ロのほぼ りめ ロロヒリロリロリドリロ ヒリ り り リヒリリ
卜姻8.鵠鍋8お匿.$8串§睾§雛§§§鍵§§塗§総罠§暑繍§罠ミ§§§§霧
S6cond一如or Looal A蟹廿量or靴ios(in tho Ordor.σf the Ra心os f㎞m bw.to High)
↑aUe 3 The Ratios to Standard Fiscal Needs
Standard Fiscal Resources Total Expenditures
Average
0.4156 1.9824Maximum
2.2091. 4.7440Minimum.
0.0416 1.3024Standard Deviation 0.2819 0.3583
Coefficient of Variation 0.1001 0.1807
.used.
There are a number of亡he wealthy local authorities that do not receive the fiscal equalization grant. A similar graph to Figure 4 can be depicted s毎owing the ratios of the stand3rd fiscal resources to the.standard fiscal needs. In principle, those.local authorit重es whose multiples are below 1.O are qualified to receive the local.grant tax, a茸d those whose multiples.are above.1.Oare not, The second一 止ier董ocal authority whose multiple is highest is Kariba.Village whose value is 2.2091 and 11810cal authorities including Kζriba Village show the values of multiples above 1.O and do not receive loca1 9・a・tt・・ドTh・y・・e all即・d・t the right・ρd.・f.the h・・i・・nt・1・等i・・Th・ρth・・1・cal.auth・「ities that amou1it to 3,102 show the ratios below 1.O and are the recipients.of local grant taxes. Thus 96.34%
of the second・Uer local authoritieS receive the local grant tax as. 奄刀@depicted by Figure 6. Though we do not analyze the first・tier. P0cal author童ties, prefeごtures ih this paper, only Tokyo Metropolitan Gov・
ernment does not receive亡he local grant taxes and the other 46 prefecture6 are the recipients of the l・cal.9r・・t t耳xes・Th・questi・n i・wh・ther・r n・t th・・eall・r・tiQ・・f fiscal・es・urce・is carri・d・ut to an exCessive extent,
Again,・instead of showing individual values of tbeSe.ratios, the characteriStics of 3,220 munici・
palitiO$are desとribed by.the basic statistics in Table.3・ The a亨er孕ge is O・4156・the maximu皿2・2091・
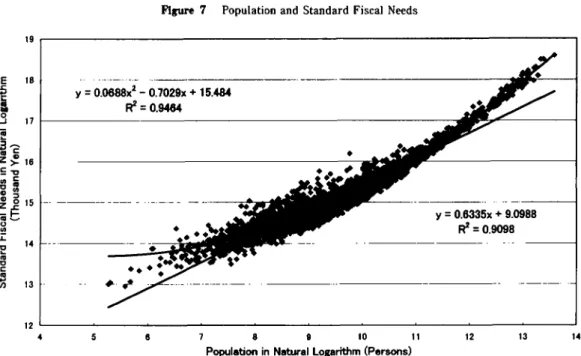
Figure 7 Population and Standard Fisca且N㏄ds 19
8 7 6 5 4 3
1 1 1 1 1 1
︵⊆O>﹁二器コO£・F︶∈一見3で﹂3乏εωで8≡8︒.匡℃﹂⑩℃=3ω
12
◆ ..一.一一...一.9・.−..
凵≠O.0688x2−0.7029x+15.484
@ 浮=0.9464 ◆◆
○ ◆
◆虎
一一 一..一.一..一一.『9「.一@ ●◆
@ ◆.・義
.一一.
凵≠O.6335x+9.0988
@ ぐ=0.9098 一.一
一
○
氈氈氈c●●・・ 亀◆
一..一一一 一.
. 一
一. タ・●ρ ・・一一…一・・一 ・
4 5 6 7 8 9 10 11
Popul●tioo in N8U釧ral Logar仙m(P●r80hs)
12 13 14
the minimum O.0416, and the coefficient of variation O.1001. Note that the loca且authority with the minimum ratio is calculated to have 24.14 times as much standard fiscal needs as its standard fiscal resources. Note also that the coefficient of variation is smaller for the ratios of standard fiscal re−
sources to standard fiscal needs than for the ratios of total expenditures to standard fiscai needs.
This suggests that loca且authorities have more discretion in the total expenditures that can be made from non−general fiscal resources such as national subsidies, prefectural subsidies and loca監debt revenues.
10:Determimnts of Standa『d Fisea且Needs
One common criticism of the present loca且grant tax system is its complexity. The students of local autonomy and loca且government finance sarcastically say that there is only one person in Japan who completely understands the local grant tax system, the director of the且ocal grant tax section in the Ministry of Home Affairs. The trade−off between the demand for meeting the fiscal conditions of indi−
vidual local authorities and the demand for the simplicity of the allocation formulas of local grant tax is similar to the trade−off of the demand of meeting the different abilities of taxpayers to pay individua且 income tax and the demand for the simp且icity of calculating tax liabilities of taxpayers. Individual in−
come tax system can better reflect the ability to pay of individua且taxpayers if the specific features of taxpayers are adjusted by the tax system with a number of income deductions, many marginal tax rates, tax credits and so on. But the simplification is another important requirement for the tax sys−
tcm, and it is much emphasized in various tax reform proposals in the United States.
The most common determinants onocal expenditures are population and land area and the com・
parisons will be made between the standard fiscal needs calculated by the complicated formulas of the present local grant tax system and the estimates made by more simple formu且as using population and
The EfIects of Fiscal Equalization Grant System in Japan and the
Possible Simpliflication of Allocation Formu且as 123
19
Figure 8 Land Area and St3ndard Fisca且Needs
8 7 6 一〇 4 3 ぼ ロ
︵器﹀℃藍器歪︶
ε妻昌3一§Zξ8三︒3歪2に℃﹂暑=3ω
12
y=0.0318x2−0.0673x 14.76 酵=0.0646
.:..
一一 ゥ竃・・
○
・謹
○
◆
◆ ●○
○
購・
.8亨
遭麹
一…◆…
一
一
○
◆
り
︑鳥
φ擁
◆◆◆◆旬 ○
・◆◆◆︒ ◆◎
︑
・○
◆
︑
鑓
亀 り
◆
■
% ○ φφ...◆.
の
◆ ○○●
◆
◆ ○
◆
o
・・皇一◆ .
◆ ◆qレ ○ ◆ ◆
一一一一…一______血__●______
一 ◆
■
鮮『野◎・
○ . . .
罰殉
y=0.1969x→・14.244 R2ニ0.0614
0 1 2 3 4 5 6
L8nd Aro8 i州ぬ網l L㎎蝋hm(Squ8r●陥1㎝ot㎝)
7 8
1and area as the determinants of standard fiscal needs.
First we n see rough relations between the population and the expenditures or the standard fiscal needs. Figure 7 shows the scattered diagram showing the relationship between the levels of standard fiscal needs calculated by the complicated formu且as of the local grant tax and the size of population of the second−tier individual loca且authorities. To separate 1㏄al authorities from each other on the scat・
ter dlagram, both population and standard fiscal needs are expressed in natural logarithm.
Two regression equations are estimated, one hnear and the other quadratic. The linear regres−
sion equation is expressed as follows. The values in the parentheses are t−values.
ア=9.0988十〇.6335Pbρ R2=0.9098 (271.92)(180.17)
Aquadratic regression line was also calculated and it shows a better fit suggesting that there is a certain optimum size of local authorities in terms of populatlon, and the per capita fiscal needs tend to rise as the population increases above this optimum leve15.
y=0.0688Pげ一〇.7029jPOρ十15.484 歪2=0.9464
Next, the standard fiscal needs are regressed to land areas. The land area is not as good an ex−
p且anatory variable as population for standard fisca且needs as Figure 8 shows. The coefficient of de・
termination is much lower than that for population and the t・value for the estimated coefficient of land
5 Though the optimum size of I㏄a且authorities will not be discussed in this paper, the author has conduct{・d analyses in幽the fol且owing book and papers. Economy of Scale in Provision of Loca且Services ,κθ{〜αロ。 Bσ翼ε々f (」E= 0㎜ジ α露4_丁楢α4θ),No.168,1995; Chapter 4 L㏄a且Expenditures , C厩㎞Z己i5θ 1〜o岡(ムocα (}oηεγπ鞭η ハ・
間πごθ),Gyosei,1999.
area is also much lower than that for population, though significant.
y=14.244十〇.1969A7εα 」爵2=0.0611 (241.11)(14.51)
Though the quadratic regression equation shows a slightly better fit, the c㏄fficient of determina・
tion is very low suggesting that the land area is not as good an explanatory variable as population.
y=0.0318/1惣♂一〇.06731172α十14.76 」爵2ニ0.0646
When both population and land area are used as explanaωry variab且es, the regression equation is calcu且ated as follows.
ニリ=8.5247十〇.6260P砂十〇.1526A7召α 」爵2=0.9465 (298.97)(230.80) (47.01)
Figure 7 shows the relationship between the popu且ation and the standard fisca且needs, and Figure 8the relationship between the land area and the standard fiscal needs. Population is clearly more sig−
nificant as an exp且anatory variable for standard fiscal needs than land area.
ll:Simplification of the Calculadon of止e St8ndard Fiseal Needs
These regression equations are calculated for the values expressed in natural logarithm. The scatter diagrams show individual loca且authorities that amount to 3,220 distinctly if the values are ex−
pressed in natural logarithm. But for the simphfied calculation of且ocal grant taxes, it may be better if thcse regression equations are calculated for the values expressed in ordinary numbers and the results are shown below. The units for the standard fisca且needs are thousand yen, the population the num−
ber of persons, and the且and area square kilometers. It is interesting to note that the va且ues of coeffi−
cients of determination and the t・values for the estimated coefficients of explanatory variables are high−
er for the case expressed in non−10garithmic ordinary numbers.
ッ=127,2991十142.87」P∂ρ R2=0.9811 (51.05) (408.45)
y=749,480十141.50Pヒゆ十4,987.72/17εα 」爵2=0.9861 (28.45) (467.51) (34.03)
Figure 9 compares the standard fiscal needs and the estimates by the regression equation to Population and且and area.
One criticism against the present system of local grant tax is that it is too complicated. As we have seen, the population and the land area are the major determinants of local expenditures, particu・
larly the popu且ation. In this section, the amounts of且ocal grant tax calculated for individual local au−
thorities by alternative simplified formulas are compared with the amounts ca且cu且ated by the present system onocal grant tax.
The simp且est way of calculating the standard fiscal needs of且ocal authorities is the allocation in proportion to the population and this formu置a is called variant 1. The total amount of standard fisca且 needs for 3,220 second・tier且ocal authorities for the fiscal year l997 was 18.22 trillion yen and the to・
The Effects of Fiscal Equalization Grant Sy忌tem in Japan and the
Possible Simpliflication of Allocation Formu且as 125
Figure g Standard Fiscal Needs.and the Estimates by the Regression Equation on Population and Land Area
︵器﹀で毎・︒コ︒↑︶
;o召3旧=2ω3﹄卍⑩5言ω80︷四国
120,000ρ00
100,000,000
90,000,000
60,000,000
40.000.000
20、000,000
0
○
◆
○◆
.●避
◆ ◆◎ ○○ .○◆
○.
㌶・♂
宦
○ . 氈宦氈
◆
◆ ◆ ○
0 20,㎜伽 40伽.㎜ 60.㎜,㎜ 80ρ00ρ00 100,000,㎜
Standard Fiscal Noods under the Preser比System.(TLousand Yon)
120,000,000
tal population. of these authorities amoullted to 98.82 million. Thus the per capita standard fiscal needs is calculated to be 184,349 yen. The amount of standard fiscal needs for individual local au−
thorities is calculated by multiplying it to止e.respective pop血1ation. For example, for Akiruno City, it will be 14.16 billion yen.
.The land area is ahother major.determinant of.local expenditu艶s, but it is not a good explanatory variable for standard fisφl needs if it is used alone. Thus as the variant 2, it is assumed that 80%of the standard fiscal needs are proportional to population and 20%to land area. To take the example of the same Akiruno Ci‡y, the amount of sta孕dard flsca1.n♀eds.under this simplified system amounts to 12..06billion yen.
As th.e variant 3, the regression equation is used..If the determinant is only popu亙ation, the amount of the. standard fiscal needs calculated by the regression equation.for Akiruno City becomes 12.25bi11童on yen.
Instead of負rbitrarily.divid宝ng the total amount of standard fiscal needs,80%in proportion to P・P・1・ti・n.・nd 20%i・p・・P・・ti・n t・1・nd area・the regres串i・n・q・・ti・n t・.. o・Pμ1・ti・n.・nd 1・nd area i・
used as the variant 4..Ak五runo City shows the standard fiscal needs of 11.98 billion yen、 The re・
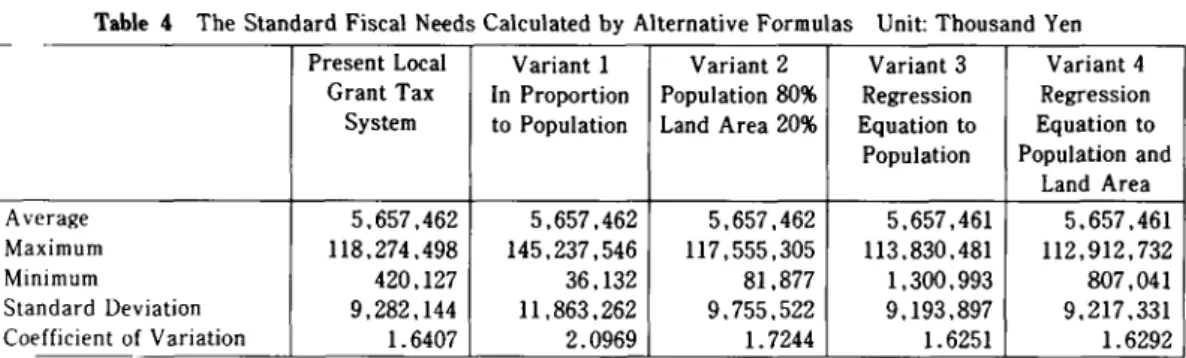
sults of calculation of the standard fiscal needs are shown in Table 4 by the representative statistics of the average, the maximum, the minimum,.the standard deviation, and the coefficient of variation..
In stead of comparing the results in terms of the.amount of standard fiscal needs in yen, the com・
P・・i…i・m・d・韮・T・bl・5・i・.term・・l thr・ati・s・f the s⑳dard fi・r・l needs cal・ul・t・d by・ltern・ti・・
fbr.!nulas. to the standard.fiscal nee s under the present local grant tax system The average is closest to.1.O with the value.of 1.0092 in the case of the variant 4,0r the calculation with the regression equatio餓to population and land皐nd thenユ・0339 in the case of the varian‡3,.6r the regression equa−
tion to population・alone. The・variant.3,.or the calculation of the standard fiscal needs 80%in pro一