九州大学学術情報リポジトリ
Kyushu University Institutional Repository
時空間分解メタボロミクス分析技術の開発および病 態モデルへの適応
入江, 美穂
https://doi.org/10.15017/1441323
出版情報:Kyushu University, 2013, 博士(農学), 課程博士 バージョン:
権利関係:Fulltext available.
ESTABLISHMENT OF ANALYTICAL METHOD FOR SPATIOTEMPORAL METABOLOMIC DYNAMICS
AND ITS APPLICATION TO DISEASE MODELS
Miho Irie
Kyushu University
2014
ACKNOWLEDGEMENTS
I would like to express my deep sense of gratitude and appreciation to my research supervisor, Professor Hiroyuki Wariishi for his guidance, support, advice, encouragement and patience during my period of study and providing me the great opportunity to participate in an exciting research on metabolomics. I am deeply indebted to Assistant Professor Hirofumi Ichinose, Assistant Professor Daisuke Miura, and Assistant Professor Yoshinori Fujimura for their support and advices.
I also wish to express my special thanks to all members in the Metabolic Architecture Design Laboratory and Innovation Center for Medical Redox Navigation who have provided a wonderful research environment and have helped with their advices on many occasions.
To mom and dad who inspired me to get PhD. Deeply thanks to sister for your supports, love and believing in me.
DEDICATION
TO MY BELOVED MOM AND DAD.
ABBREVIATIONS
2', 3'-Cyclic GMP Guanosine-2', 3'-cyclic monophosphate
2PG 2-Phosphoglycerate
3PG 3-Phosphoglycerate
5MeTHF 5-Methyl tetrahydrofolate
6PG 6-Phosphoglycerate
9-AA 9-Aminoacridine
ADP Adenosine diphosphate
ADP-ribose Adenosine diphosphate ribose
AICAR 5-Aminoimidazole-4-carboxamide ribonucleotide
AKI Acute kidney injury
AMP Adenosine monophosphate
Arg Arginine
Asn Asparagine
Asp Aspartate
ATP Adenosine triphosphate
BHBA 3-Hydroxybutyrate
BUN Blood urea nitrogen
CDP Cytidine diphosphate
CDP-choline Cytidine diphosphocholine
Cisplatin cis-Diamminedichloroplatinum (II)
CMP Cytidine monophosphate
CMP-Neu5Ac Cytidine monophosphate-N-acetylneuraminate
Con. Contralateral
CPu Corpus striatum
Creatine-P Phosphocreatine
CTP Cytidine triphosphate
CTX Cortex
Cys Cysteine
dAMP Deoxyadenosine monophosphate dCDP Deoxycytidine diphosphate dCMP Deoxycytidine monophosphate dCTP Deoxycytidine triphosphate dGDP Deoxyguanosine diphosphate dGMP Deoxyguanosine monophosphate
DNA Deoxyribonucleic acid
dTDP Thymidine diphosphate dUDP Deoxyuridine diphosphate dUMP Deoxyuridine monophosphate F16P Fructose-bisphosphate
F6P Fructose 6-phosphate
FAD Flavin adenine dinucleotide
FAICAR 5-Formamidoimidazole-4-carboxamide ribotide
G1P Glucose 1-phosphate
G6P Glucose 6-phosphate
GC Gas chromatography
GDP Guanosine diphosphate
GlcNAc N-Acetylglucosamine
Gln Glutamine
Glu Glutamate
Glycerol-3P Glycerol 3-phosphate
GMP Guanosine monophosphate
GPC Glycero phosphoryl choline
GSH Glutahione, reduced
GSSG Glutathione, oxidized
HI Hippocampus
HILIC Hydrophilic interaction chromatography
His Histidine
IMP Inosine monophosphate
Isc. Ischemic
IT Ion trap
L-DOPA 3-(3, 4-Dihydroxyphenyl)-L-alanine L-Saccharopine N6-(L-1,3-Dicarboxypropyl)-L-lysine
LC Liquid chromatography
Leu / Ile Leucine / Isoleucine
Lys Lysine
m/z Mass to charge ratio
MALDI-TOF Matrix-assisted laser desorption and ionization time of flight
MCA Middle cerebral artery
MCAO MCA occlusion
Met Methionine
MS Mass spectrometry
MS/MS Tandem mass spectrometer
MSI MS imaging
MTA 5-Methylthioadenosine
NAA N-Acetyl aspartate
NAAG N-Acetylaspartylglutamate
NAD+ Nicotinamide adenine dinucleotide NADH Nicotinamide adenine dinucleotide
NADP+ Nicotinamide adenine dinucleotide phosphate NADPH Nicotinamide adenine dinucleotide phosphate
NAG N-Acetylglutamate
Neu5Ac N-Acetylneuraminate
NO Nitric oxide
PARG Poly ADP-ribose glycohydrolase
PARP Poly ADP-ribose polymerase
PCA Principal component analysis
PE Phosphoethanolamine
PEP Phosphoenolpyruvate
PFPP Pentafluorophenyl propyl
Phe Phenylalanine
PLA Phenyllactate
Pro Proline
PRPP Phosphoribosyl pyrophosphate
PYR Pyruvate
Q Quadrupole
QIT Quadrupole ion trap
R5P Ribose 5-phosphate
ribose-5P Ribose 5-phosphate Ribu5P Riburose 5-phosphate
ROS Reactive oxygen species
S7P Sedoheptulose 7-phosphate SAH S-Adenosyl-L-homocysteine
SAM S-Adenosylmethionine
Ser Serine
TCA cycle Tricarboxylate cycle
Thr Threonine
TOF Time-of-flight
Trp Tryptophan
Tyr Tyrosine
UDP Uridine diphosphate
UDP-GlcNAc Uridine diphosphate N-acetylglucosamine
UDP-glucose Uridine diphosphate glucose
UMP Uridine monophosphate
UTP Uridine triphosphate
Val Valine
X5P Xylulose 5-phosphate
XMP Xanthosine monophosphate
TABLE OF CONTENTS
Acknowledgements I
Dedication II
Abbreviations III
Table of Contents IX
List of Table XIII
List of Figure XIV
Chapter 1
Introduction 1
1.1 Metabolomics 2
1.1.2 Sample preparation 7
1.1.2.1 Clamping 7
1.1.2.2 Homogenization and Extraction 8
1.1.3 Analytical technologies 9
1.1.3.1 GC-MS 10
1.1.3.2 LC-MS 12
1.1.4 Data analysis 16
1.1.5 Concluding Remarks 18
1.2 Mass spectrometry imaging 19
1.2.1 Matrix assisted laser desorption ionization (MALDI)-MS 21
1.2.2 Sample preparation 23
1.2.2.1 Matrix selection and deposition 23
1.2.2.2 Data acquisition and analysis 25
1.2.3 Concluding Remarks 26
1.3 The aim of this study 29
Chapter 2
Integrated MALDI-MS imaging and LC–MS techniques for visualizing spatiotemporal metabolomic dynamics in a rat stroke model 30
2.1 Introduction 31
2.2 Material and Method 34
2.2.1 Materials 34
2.2.2 Analytical condition of LC-MS 34
2.2.3 Animal protocol 35
2.2.4 MSI analysis of brain sections 37
2.2.5 Metabolomic analysis of brain extracts by LC-MS 39
2.2.6 Multivariate statistical analysis 40
2.3 Results and Discussion 41
2.3.1 Construction of LC-MS based standard metabolites library 41
2.3.2 Experimental Flow 42
2.3.3 Global Investigation of Region-Specific Metabolic Dynamics
during Infarct Formation 44
2.3.4 Comparison of the Metabolic Variations between the Whole Tissue Region and its Micro-regions in the MCAO Rat Brain after Ischemia-Reperfusion
52
2.3.5 Spatiotemporal Metabolomic Dynamics and Metabolic Pathway
analysis by Combing MSI and LC-MS 57
2.4 Concluding Remarks 67
Chapter 3
Metabolic Analysis of Cisplatin-induced Acute Kidney Injury 68
3.1 Introduction 69
3.2 Material and Method 74
3.2.1 Materials 74
3.2.2 Animals and drug treatment 74
3.2.3 Blood urea nitrogen analysis 75
3.2.4 Metabolomic analysis of kidney extracts by LC-MS 75
3.2.5 MSI analysis of kidney sections 77
3.2.6 Statistical analysis 78
3.3 Results 79
3.3.1 Body weight and blood analyses 79
3.3.2 Global investigation of metabolic dynamics during disease
formation 79
3.3.3 Spatiotemporal metabolic variance in kidney visualized by MSI 92
3.4 Discussion 96
3.5 Concluding Remarks 102
Chapter 4
Final remarks 103
Reference 106
Appendix 121
Vita 146
LIST OF TABLES
TABLE PAGE
1-1 Advantages of analyzing the metabolome 4
1-2 Strategies for metabolomic analysis 6
2-1 Mass-to-charge ratio, molecular species and fragments observed on tissue
sections. 55
3-1 List of significantly changed putative metabolites in kidney tissue. Fold-change
between drug-treated and control group, with their corresponding p values. 83
3-2 List of putative metabolites in kidney tissue. Fold-change between drug-treated
and control group. 89
LIST OF FIGURES
FIGURE PAGE
1-1 The flow of the “omics” sciences 3
1-2 Overview of electron impact 11
1-3 Overview of electrospray ionization 13
1-4 Overview of matrix-assisted laser desorption ionization 22
1-5 Summary of spatiotemporal metabolic dynamics 28
2-1 A schematic diagram of the middle cerebral artery occlusion (MCAO) model
rat. 36
2-2 A schematic diagram of the sampling areas for the MSI and LC-MS analyses. 38
2-3 Experimental procedures for the LC-MS and MSI analyses. 43
LIST OF FIGURES
FIGURE PAGE
2-4 The multivariate analysis of cerebral metabolomic changes induced by
reperfusion following 1 h MCAO. 45
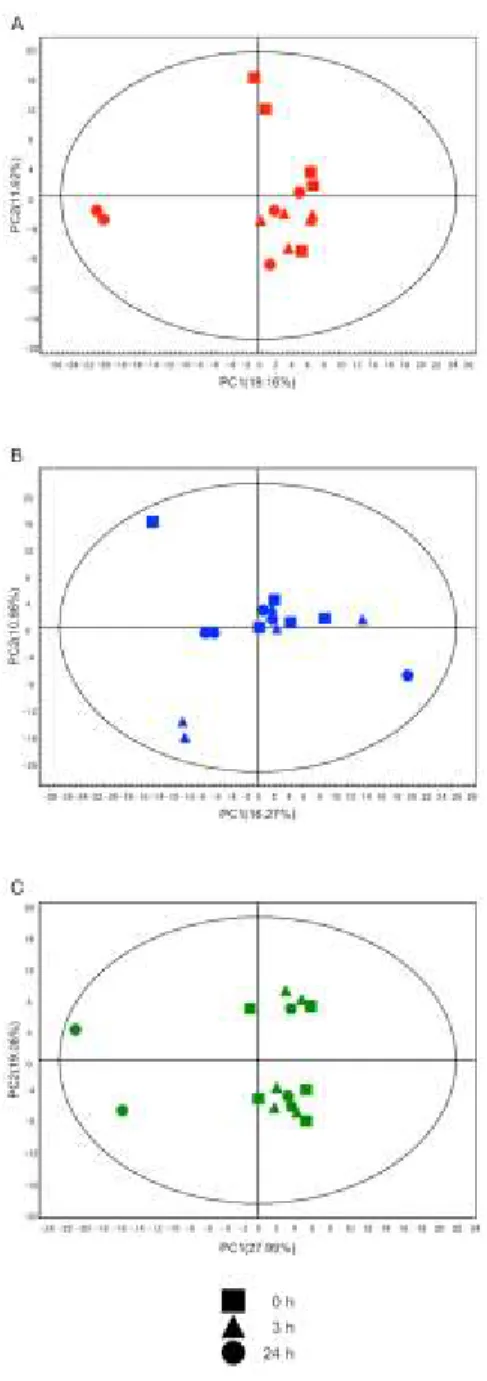
2-5 The multivariate analysis of cerebral metabolomic changes in contralateral
hemisphere induced by reperfusion following 1 h MCAO. 46
2-6 The multivariate analysis of cerebral metabolomic changes in ischemic
hemisphere induced by reperfusion following 1 h MCAO. 47
2-7 Heat map visualization of the common metabolites identified in two brain
components during ischemia-reperfusion. 48
2-8 Schematic illustrations of the functional regions in the cortex. 51
2-9 A comparison of the average intensity between the whole tissue regions and
partial tissue regions. 54
2-10 The integrated MSI and LC-MS techniques allow the visualization of drastic
changes in the spatiotemporal metabolite distribution. 58
LIST OF FIGURES
FIGURE PAGE
2-11 The LC-MS analysis of region-specific metabolomic changes during
reperfusion. 60
2-12 The LC-MS analysis of region-specific metabolomic changes during
reperfusion. 61
2-13 The LC-MS analysis of region-specific metabolomic changes during
reperfusion. 62
2-14 The LC-MS analysis of region-specific metabolomic changes during
reperfusion. 64
3-1 Interaction of cisplatin with DNA nucleobases. 70
3-2 Biochemical cell death pathways induced by cisplatin. 72
3-3 Change of BUN and body weight after cisplatin injection. 80
LIST OF FIGURES
FIGURE PAGE
3-4 The multivariate analysis of kidney metabolomic changes induced by cisplatin
administration. 81
3-5 Time-dependent metabolic variance after cisplatin injection 88
3-6 Visualization of spatiotemporal distribution of renal metabolites related to
nucleotide metabolism after cisplatin injection by MSI. 93
3-7 Visualization of spatiotemporal distribution of renal metabolites related to
amino acid, glycolysis and lipid metabolism after cisplatin injection by MSI. 94
3-8 Integrated LC-MS and MSI technique visualizes drastic changes of
spatiotemporal metabolite distribution in mouse kidney after cisplatin injection. 95
3-9 Catalytic activity of poly ADP-ribose polymerase (PARP) and role in DNA damage.
98
3-10 Metabolism of poly ADP-ribose during DNA damage and repair. 99
CHAPTER 1
INTRODUCTION
1.1 Metabolomics
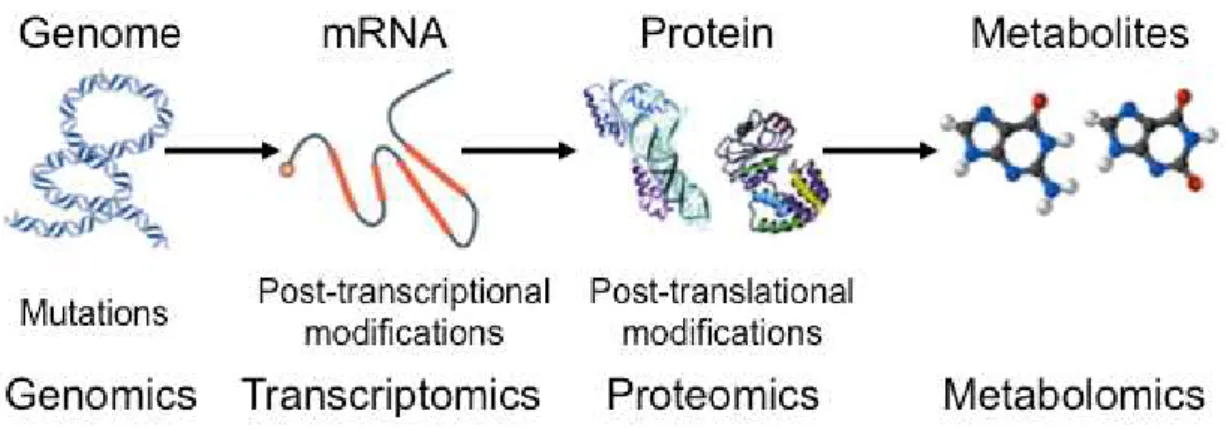
Dramatic technological advances in the biological sciences over the past few years have forged a new era of research including the emerging field of systems biology. Although the understanding of living organisms at the molecular system level is still in its infancy, it is evident that comprehensive investigations of the ‘‘omics cascade’’ with genomics, transcriptomics, proteomics, and metabolomics are important building blocks and will play a central role in this new science (Dettmer et al. 2007) (Fig. 1-1).
Metabonomics has been defined as the “the quantitative measurement of the dynamic multiparametric response of a living system to pathophysiological stimuli or genetic modification” (Nicholson et al. 1999). The study of metabonomics depends on the production of global metabolite profiles that enable diagnostic changes in the concentrations, or proportions, of low-molecular-weight organic metabolites in samples, such as biofluids and organ extracts, to be determined. Such investigations thus generate metabolic phenotypes and, by studying these, it may well be possible to obtain new and unexpected insights into biological processes (e.g., ageing, onset and progression of disease, toxicity, and response to therapy) (Theodoridis et al. 2008). Table 1-1 provides an overview of the advantages of studying the metbolome in comparison to the transcriptome or proteome (Dunn and Ellis 2005).
Metabolites constitute a diverse set of atomic arrangements when compared to the proteome (arrangement of 20 amino acids) and transcriptome (arrangement of four nucleotide bases bonded with sugar and phosphate backbone) and this provides wide variations in
Fig. 1-1 The flow of the “omics” sciences (Patti et al. 2012).
Table 1-1 Advantages of analyzing the metabolome (Theodoridis et al. 2008).
The number of metabolites should be lower than the number of genes and proteins in a cell.
Although the concentration of enzyme and metabolic flux may not significantly change during a biochemical reaction, the concentration of metabolites can significantly change.
The metabolome is the down stream product of gene expression so reflects the functional level of the cell more appropriately and changes in the metabolome are expected to be amplified relative to proteome or transcriptome.
Research is showing that metabolic fluxes are regulated not only by gene expression but also by environmental stresses (phenotype) and hence measurement of the down stream products (metabolites) is appropriate
It is estimated that metabolomics experiments cost two to three times less than proteomic and transcriptomic experiments.
chemical (molecular weight, polarity, solubility) and physical (volatility) properties. The degree of diversity is indicated by the analysis of low molecular weight (MW), polar, volatile organic metabolites, such as ethanol or isoprene to the higher MW, polar (carbohydrates) and non-polar (terpenoids and lipids) metabolites. The metabolome also extends over an estimated 7–9 magnitudes of concentration (pM–mM). In genomics, pleiotropic effects cause seemingly unrelated biochemical pathways to be affected (e.g., by genetic alterations). Therefore, to be able to analyze all metabolites in a single analysis would be preferred (metabolomics).
Technologically, this is not currently possible. Therefore, different analytical approaches have been designed in order to answer specific types of questions (Dunn and Ellis 2005). These approaches are defined as Table 1-2 (Ellis et al. 2007; Dettmer et al. 2007; Dunn and Ellis 2005; Dunn, Bailey, et al. 2005).
The most common technologies currently employed for metabolomics are nuclear magnetic resonance (NMR) and mass spectrometry (MS), both of which allow for the phenotyping of a response (Bouhifd et al. 2013). MS-based metabolomics appears the more suitable technology as it allows better deduction of a substance represented by a feature in the recorded spectrum, higher sensitivity and precision compared with NMR, and the ability to measure nearly the whole metabolome. These advances of MS have only been available for a few years (Bouhifd et al. 2013). Therefore, MS-based metabolomics is now being widely used for the study of determination of metabolic biomarkers that change as an indicator of the presence of a disease or in response to drug-based intervention; and, determination of the effect of biochemical or environmental stresses on plants or microbes, which include genetically modified (GM) plants (Ollins and Erhoeyen 2003), bacterial characterizations (Vaidyanathan et al. 2002) and human health assessments (Watkins and German 2002).
Table 1-2 Strategies for metabolomic analysis.
Metabolite target analysis: Qualitative and quantitative analysis of one, or several, metabolites related to a specific metabolic reaction. Extensive sample preparation and separation from other metabolites is required. Metabolite target analysis is mainly used for screening purposes.
Metabolite profiling (metabolic profiling): Identification and quantification of a selective number of predefined metabolites, which are generally related to a specific metabolic pathway. Sample preparation, cleanup and data acquisition can be focused on the chemical properties of these compounds so as to reduce matrix effects. The term metabolic profiling is frequently used in the specific context of drug research in the description of catabolic degradation of an applied chemical.
Metabolomics: The nonbiased identification and quantification of all metabolites in a biological system. Metabolomic approaches must aim at avoiding exclusion of any metabolite by using well conceive sample preparation procedures and analytical techniques.
Metabolic finger printing: Global, high-throughput, rapid analysis to provide sample classification. Also utilized as a screening tool to discriminate between samples from different biological status or origin (e.g., case/control, disease/healthy). Quantification and metabolic identification are generally not employed. Sample preparation is simple.
Metabonomics: Quantitative analysis of metabolites in response to biological perturbation (e.g., disease or therapeutic treatment).
1.1.2 Sample preparation
In the metabolomics experiment, sampling provides a picture or snapshot of the metabolome at one point in time (Dunn and Ellis 2005). When aiming at the simultaneous detection of the full suite of metabolites in biological samples, the applied methods cannot be restricted to the technical question which type of data acquisition might be most suitable but also must seriously consider adequate methods for sample preparation (Fiehn 2002).
1.1.2.1 Clamping
While processing biological samples, special care must be taken to minimize the formation or degradation of metabolites after sampling due to remaining enzymatic activity or oxidation processes. Several techniques have been used to inhibit metabolism such as freezing in liquid nitrogen, freeze clamping, acid treatment or quenching in salt containing aqueous methanol at low temperatures (Theobald et al. 1993; Maharjan and Ferenci 2003; Dettmer et al. 2007).
However, acidic treatments pose severe problems for many analytical methods that follow.
Usually, freezing in liquid nitrogen is regarded as the best way to stop enzymatic activity, but if this treatment is used, great care must be taken not to partially thaw tissues before extracting metabolites. This issue can be circumvented using lyophilization (which prevents both enzyme and transporter function), or by immediately adding organic solvents and applying heat, thereby also inhibiting the recovery of enzymatic activity (Fiehn 2001). Tissues
cultures are often directly infused into cold organic solvents, keeping temperatures below – 20C at all times during sample preparation (Gonzalez et al. 1997; Fiehn 2001).
1.1.2.2 Homogenization and Extraction
Prior to sample extraction, different types of sample homogenization can be used, depending on the number of samples to be treated, and on the type of tissue. Animal tissue can be ground under liquid nitrogen simply using mortar and pestle, or using a ball mill with pre-chilled holders (Fiehn et al. 2000), or together with the extraction solvent by ultraturrax devices (Fiehn 2002).
Polar/non-polar extractions are the most frequently applied method and are performed by physical/chemical disruption of the cells, removal of the cell pellet by centrifugation and distribution of metabolites to polar (methanol/water) and non-polar (chloroform) solvents (Dunn and Ellis 2005).
1.1.3 Analytical method
Metabolomics requires highly analytical instruments because it is dealing with thousands of small molecules with a diversity of a wide range of chemical and physical species, from low molecular weight polar volatiles such as ethanol, to high molecular weight polar glucosides, non-polar lipids and inorganic species. The range of metabolite concentrations can vary over nine orders of magnitude (pM-mM). Therefore, it is the need for the analysis technologies of metabolomics that enable detection of unbiased and wide-dynamic range (sensitive) with the high-throughput, reproducible and accurate.
As an analytical tool, MS is widely employed and standard texts detailing theory and applications are available. In metabolomic applications MS provides both sensitive detection and metabolite identification via mass spectrum interpretation and comparison or molecular formulae determination via accurate mass measurements (Dunn, Bailey, et al. 2005).
As biological samples can be introduced to the ion-source MS either via direct-injection or after chromatographic separation, two major methods, hyphenated method and direct injection method, have been used in MS-based metabolomics. Direct-injection, especially when used on high-resolving MS, provides an effective way to detect and quantify large numbers of metabolites, and was extensively utilized for metabolome analysis (Bouhifd et al. 2013). The major drawback of the direct-injection technique is the presence of matrix effects, which resulted in the failure to detect some metabolite ions with low ionization efficiencies (Bouhifd et al. 2013).
Coupling chromatography to MS offers an excellent solution to complex mixture analyses
and has been extensively used in metabolomics. Chromatographic separation of metabolites prior to MS analyses has several advantages: (1) reduction of matrix effects, (2) separation of isomers, (3) provides additional and orthogonal data (e.g., retention time) valuable for metabolite annotation, and (4) allows for more accurate quantification of individual metabolites. Currently, two predominant chromatographic techniques have been incorporated in MS based metabolomics (Lei et al. 2011).
1.1.3.1 GC-MS
GC combined with electron ionization (EI) MS is ideally suited for the analyses of both volatile and nonvolatile compounds following derivatization. The high resolution and reproducible chromatographic separations offered by modern capillary GC make it an excellent tool for complex metabolic mixture analyses (Lei et al. 2011).
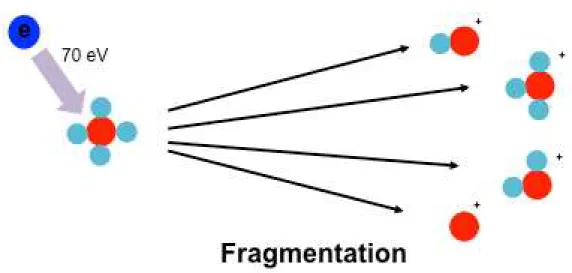
During electro-ionization, analyte molecules are ionized and fragmented in the gas phase (10–1 to 10–4 Pa) by interaction with 70 eV electrons generated from a hot filament and accelerated through a 70V electric field (Beran and Kevanl 1969). As the fragmentation is reproducible, these fragment ions form the ‘chemical fingerprints’ (‘features‘) of the analyte.
Therefore, many commercially available libraries such as NIST with thousands of standard EI spectra can be used for rapid identification of analytes (Bouhifd et al. 2013). One prerequisite for GC-MS analysis is the need of volatile analytes that are stable at high temperature during the whole analysis. Generally, some non-volatile metabolites (e.g., sugars, amino acids) can be converted into volatile compounds by derivatization (Bouhifd et al. 2013) (Fig. 1-2).
Fig. 1-2 Overview of electron impact
1.1.3.2 LC-MS
Another combined system, LC-MS, provides metabolite separation by LC followed by electrospray ionization (ESI) or, less typically, atmospheric pressure chemical ionization (APCI) (Byrdwell 2001). This technique differs from GC-MS in distinct ways (lower analysis temperatures, and sample volatility not required) and this simplifies sample preparation (Dunn and Ellis 2005).
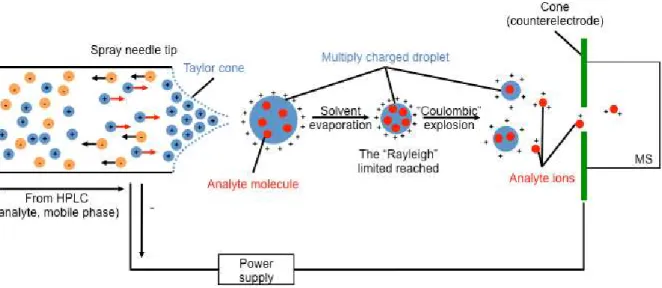
The ionization technique selected for LC-MS based metabolomics can also have a substantial impact on metabolite profiles. Generally, ESI is ideal for semi polar and polar compounds (Fig. 1-3); whereas APCI is more suitable for neutral or less polar compounds.
These two ionization techniques provide complementary data, both desirable in large scale non-targeted metabolomics (Lei et al. 2011). These ion sources perform ionization at atmospheric pressure with subsequent transfer of ions from atmospheric to vacuum pressure (Dunn, Bailey, et al. 2005).
Many modern MS instruments are now capable of fast polarity switching during data acquisition and have been exploited in simultaneous acquisition of both positive and negative ion mode data (Tolonen and Uusitalo 2004; Cai et al. 2010). Use of both positive and negative ionization LC-MS offers more comprehensive metabolome coverage than using a single polarity (Farag et al. 2007; Nordström et al. 2008; Lei et al. 2011). Quantification is performed by external calibration. Metabolite identification is more time intensive. LC-MS does not result in fragmentation of molecular ions as observed in electron impact mass spectrometers, so it does not allow direct metabolite identification by comparison of LC-MS mass spectra, as LC-MS mass spectral libraries are not commonly available (as is the case for
Fig. 1-3 Overview of electrospray ionization
GC-MS). However, with the use of accurate mass measurements and/or tandem MS (MS/MS) to provide collisional induced dissociation (CID) and related mass spectra (MS/MS), metabolite identification can be performed (Lenz et al. 2004) in either quadruple-based tandem in-space instruments (e.g., triple quadrupole (QqQ)), or ion-trap-based tandem in-time instruments (e.g., quadrupole-ion trap time of flight (IT-TOF)) (Dunn and Ellis 2005).
High resolution separations of complex metabolomic samples will provide more descriptive data and can be performed with capillary columns, where in theory, as the column internal diameter and packing particle size decrease the chromatographic resolution will increase. Due to a reduction in band broadening, there will also be a greater S/N ratio, and thus an increase in sensitivity (Dunn, Bailey, et al. 2005).
Column chemistry is also important as most published applications use reversed phase assays with solvents that are compatible with electrospray ionization instrumentation.
However, polar metabolites can be eluted in the void volume with little chromatographic retention and therefore separation is not achieved and ionization suppression can be problematic. Different column chemistries are being assessed including hydrophilic interaction liquid chromatography in the study of cucurbita maxima leaves, where oligosaccharides, glycosides, amino sugars, amino acids and sugar nucleotides were all detected (Dunn, Bailey, et al. 2005).
Ion annotation is a procedure to recognize a group of ions likely to originate from the same compound. In LC-MS-based metabolomics, one metabolite is often represented by multiple peaks in LC-MS data with distinct m/z values but, at similar retention times, due to the presence of isotopes, adducts and neutral loss fragments. As long as the scan rate of mass spectrometer is properly adjusted and enough scanning points are acquired to define the
chromatographic peaks, the ions from the same compound share similarly shaped elution profiles, which can be represented by their extracted ion chromatograms. Thus, ion annotation can be achieved by clustering similar elution profiles together, thereby facilitating metabolite identification (Xiao et al. 2012).
After grouping peaks together by ion annotation, the monoisotopic exact masses of these compounds can be calculated based on the mass differences of adducts/isotopes from their monoisotopic neutral forms. The calculated masses can be used to search against metabolite databases (e.g., HMDB and Metlin). Metabolites having molecular masses within the pre-specified tolerance of the query masses are retrieved from these databases. However, mass-based identification seldom results in unique identification of these ions (Xiao et al.
2012). By acquiring MS/MS spectra of these ions, the results from mass-based identification can be further refined through the MS/MS spectrum matching using authentic compound or public database (e.g., MassBank). Although recent research into the reproducibility of mass spectral libraries from CID have been undertaken (Bristow et al. 2004), and show that mass spectra produced on different instrument types and different manufacturers’ instruments are similar (Dunn and Ellis 2005), it is often affected by experimental factors (e.g., instrument type and collision energy). Therefore, the most reliable way to identify a metabolite unambiguously and confidently is to compare its mass, retention time and fragmentation spectrum with those of authentic standards at each laboratories and instruments.
1.1.4 Data analysis
Raw data are usually stored in sample files as series of mass spectra acquired at a given time point or scans. Each scan is represented by a pair of mass and intensity vectors. The vector length varies from scan to scan depending on the number of detected peaks. However, for a metabolomics data analysis it is necessary to extract information about all compounds, including mass and retention time, as compound identifiers and intensity as quantitative representation of concentration. Moreover, the data should be extracted from all data files as uniform matrices to allow data comparison and discovery of differentially expressed metabolites (Dettmer et al. 2007). When the mass intensity vectors are transformed to uniform length, the entire dataset obtained by direct injection analyses (a single scan) can be represented as a matrix (m (+ s) f), where m is the length of the uniform mass vector, s is the retention time and f is the number of files (Dettmer et al. 2007).
Next, each sample is usually normalized to remove the unwanted systematic bias in ion intensities between measurements, while retaining the interesting biological variation.
Strategies for normalization of metabolic profile data can be divided into two major categories: (1) Statistical models used to derive optimal scaling factors for each sample based on complete dataset (Crawford and Morrison 1968), such as normalization by unit norm (Scholz et al. 2004) or median (Wang et al. 2003) of intensities. (2) Normalization by a single or multiple internal (e.g., added to sample prior to extraction) or external (e.g., added to sample after extraction) standard compounds based on empirical rules, such as specific regions of retention time (Hermansson et al. 2005; Bijlsma et al. 2006; Katajamaa and Oresic
2007).
The statistical tools for metabolomics data analysis should be selected according to the aim of the study. If the aim is sample classification and prior information about the sample identity is unknown (e.g., in identification of silent mutation phenotype in progeny), unsupervised methods such as hierarchical clustering analysis (HCA), or principal component analysis (PCA) are used (Setoyama et al. 2013). On the other hand, sample identity is often known and the aim of the study is to discover characteristic biomarkers (e.g., search for biomarkers of a disease comparing samples from healthy and diseased subjects) (Sugimoto et al. 2010). In this case, supervised methods such as orthogonal partial least squares discriminant analysis (OPLS-DA) can be used as well. The supervised methods use prior information about sample class and perform better in biomarker discovery (Jonsson et al. 2005). The supervised methods are also the preferred option for diagnostics studies, when classes of some samples are known and identities of others need to be determined (e.g., cancer diagnosis by comparing a patient’s metabolic fingerprint with the fingerprints of healthy and diseased subjects).
However, if the aim of the study is a mere biomarker discovery in samples of known classes, common statistical methods such as Student’s t test can be applied in order to find statistically significant differences of metabolite levels between the clusters (Smilde et al. 2005; Dettmer et al. 2007).
1.1.5 Concluding Remarks
Metabolomics use in several research fields is rapidly increasing. Especially coupling chromatography to MS offers an excellent solution to complex mixture analyses and has been extensively used in metabolomics. There are enormous benefits to performing hyphenated-MS based metabolomics on several samples. Molecular analyses provide new insight into biochemical processes that are not attainable by other analysis. Although MS coupled with chromatography techniques such as LC-MS or GC-MS has been known to be a conventionally used strategy for metabolomics (Miura et al. 2012), these methods have a drawback in the analysis of tissue samples because of the requirement of metabolite extraction, which causes the loss of information on the spatial localization of the metabolites.
Understanding the complex biochemical processes that occur within living organisms requires not only the elucidation of the molecular entities involved in these processes, but also their spatial distribution within the organism. Analytical technologies for elucidating multiple molecular dynamics in the micro-region that retain the spatial information of the target tissue are thought to be important for understanding biological complexity of disease progress.
1.2 Mass spectrometry imaging
Understanding the complex biochemical processes that occur within living organisms requires not only the elucidation of the molecular entities involved in these processes, but also their spatial distribution within the organism. Analytical technologies for elucidating multiple molecular dynamics in the micro-region that retain the spatial information of the target tissue are thought to be important for understanding biological complexity of disease progress (Miura et al. 2012).
Traditional imaging techniques like positron emission tomography, magnetic resonance imaging, and whole-body radiography share a key advantage in their compatibility with living systems but have limited spatial resolution and require molecular or radioisotope tags that do not distinguish molecular forms having the tag (Dale et al. 2008).
MS based imaging technique such as laser capture microdissection offers the highest regional selectivity and can be used for single cell analyses (Ladanyi et al. 2006; Pinzani et al.
2006). This approach is time consuming and requires a high number of cells in order to detect low abundance molecules. Voxelization and subsequent LC–MS of a mouse brain tissue section have been used for spatial mapping and quantitation of a lot of biomolecules, but at the cost of low spatial resolution (1 mm3) and extensive sample preparation (Petyuk et al.
2007; Amstalden van Hove et al. 2010). Thus, the simultaneous multiple molecular imaging with high sensitivity and high-throughput will be a technical breakthrough for pathophysiological research.
Matrix-assisted laser desorption/ionization (MALDI)-MS based MS imaging (MSI),
enables the determination of the distribution of biomolecules present in tissue sections by direct ionization and detection at comparatively sensitive and high-resolution (Miura et al.
2010a). This technique can detect various biomolecules simultaneously without any labeling during a single analysis. Therefore, MSI is now being widely used for the in situ imaging of macromolecules, such as proteins, peptides, lipids, metabolites and drugs and is expected to be a potential tool for the pathological analysis of the brain, kidneys or tumors (Walch et al.
2008; Sugiura et al. 2009; Miura et al. 2012).
1.2.1 Matrix assisted laser desorption/ionization (MALDI)-MS
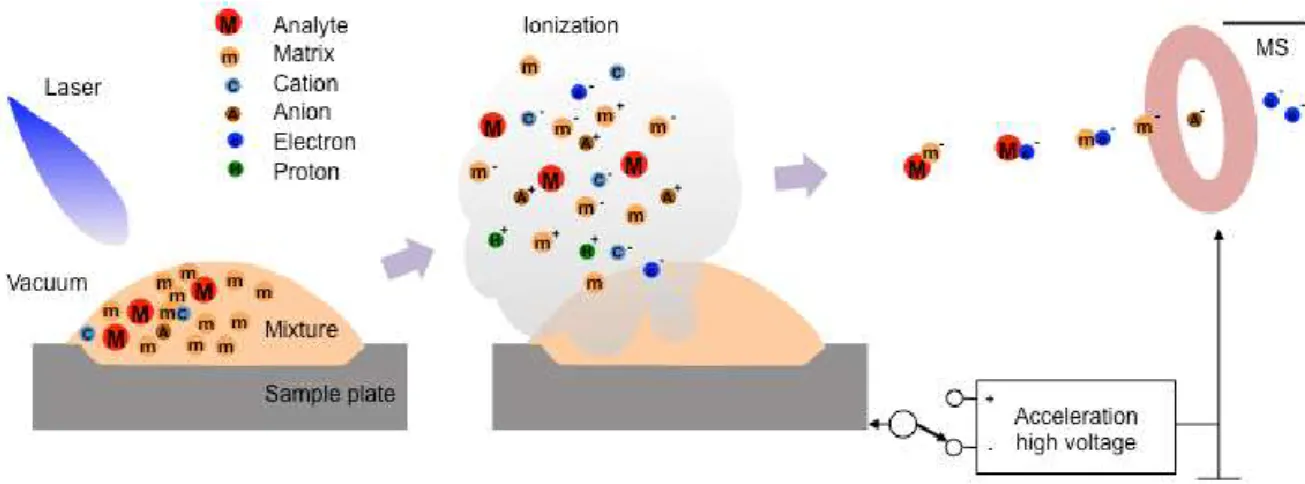
MALDI is a soft ionization technique used in MS, allowing the analysis of biomolecules (biopolymers such as DNA, proteins, peptides and sugars) and large organic molecules (such as polymers, dendrimers and other macromolecules), which tend to be fragile and fragment when ionized by more conventional ionization methods (Fig. 1-4). The mechanism of ion formation in MALDI is a complex phenomenon. The laser is fired at the matrix crystals in the dried-droplet spot. The matrix absorbs the laser energy and it is thought that primarily the matrix is desorbed and ionized (by addition of a proton) by this event. The matrix is then thought to transfer proton to the analyte molecules, thus charging the analyte. Ions observed after this process consist of a neutral molecule [M] and an added or removed ion. Together, they form a quasimolecular ion, for example [M+H]+ in the case of an added proton, [M+Na]+ in the case of an added sodium ion, or [M-H]- in the case of a removed proton. MALDI is capable of creating singly charged ions, but multiply charged ions ([M+nH]n+) can also be created, as a function of the matrix, the laser intensity and/or the voltage used. Note that these are all even-electron species. Ion signals of radical cations (photoionized molecules) can be observed.
Instrument of MSI need capability of the throughput, mass resolving power, mass accuracy, tandem-MS capabilities and spatial resolution. Generally, MALDI-MSI is typically carried out on an instrument with a time of flight (TOF) mass analyzer because speed, sensitivity and broad mass range detection (m/z ~1-100,000) make it attractive for imaging purpose (Amstalden van Hove et al. 2010).
Fig. 1-4 Overview of matrix-assisted laser desorption/ionization
1.2.2 Sample preparation
Several factors for MS imaging sample preparation must be considered, from sample collection to surface treatment prior to analysis. The proper and immediate treatment of tissue after surgical removal is essential to avoid degradation and spatial rearrangement of molecules (Schwartz et al. 2003; Amstalden van Hove et al. 2010).
Thin, flat surfaces are required for MS imaging analysis. Samples are typical prepared by cryo-sectioning on a microtome. The sectioned tissue slice can be directly applied on a conductive surface (e.g., indium tin oxide (ITO)-coated glass slide), for full tissue imaging (Amstalden van Hove et al. 2010).
1.2.2.1 Matrix selection and deposition
Matrix selection and deposition is crucial step in the sample preparation protocol for MSI.
It is clear that the molecules detected depend critically on the chemistry of the matrix used and its dispersion on the sample to be analyzed (Vickerman 2011). Moreover, the matrix must not react with the analytes in the tissue section and should posses a low sublimation rate because most MSI are conducted under high vacuum conditions. In addition, the type and molecular weight of the analytes of interest must be considered when choosing a MALDI matrix (Amstalden van Hove et al. 2010). Thus detection of proteins requires sinapinic acid, whereas lipids may be detected using either 2, 5-dihydrobenzoic acid or
a-cyano-4-hydroxycinnamic acid (Vickerman 2011). In addition, 9-aminoacridine is suited to detect smaller endogenous metabolites.
Matrix deposition must be homogeneous, reproducible, provide sufficient sensitivity and should be easy to use (Amstalden van Hove et al. 2010). In addition, the spatial resolution attainable is particularly critically dependent on the dispersion and particle size of the matrix crystallites (Vickerman 2011). The environmental conditions (e.g., humidity, temperature) during matrix deposition are important, since they may result in poor interaction between matrix and analytes (Amstalden van Hove et al. 2010). The methods for matrix deposition methods for MSI are briefly described below.
Direct-droplet method: The matrix solution is applied on the sample manually with a pipette. The droplet of matrix solution diffuse on the tissue surface and results in the nonuniform matrix crystals that form in the droplet area (Amstalden van Hove et al. 2010).
Pneumatic nebulization: The matrix solution is sprayed onto the sample with a hand-held airbrush (Schwartz et al. 2003). A gentle spray allows the formation of a homogeneous crystal layer on the sample surface. This technique can form very tiny matrix crystals on the surface, but the intensity of the signals is not satisfactory compared to the droplet method. Moreover, the spray has to be optimized previous to each application, thus reproducibility may be an issue (Amstalden van Hove et al. 2010).
Matrix sublimation: Solid matrix is placed on the bottom section of a condenser and the sample is attached to the condenser with double sided thermally conductive tape facing the solid matrix. The sublimation occurs under low pressure and high temperature which allows the matrix to condense on the cold sample surface (Amstalden van Hove et al. 2010). This method provides enhanced purity of matrix applied to the sample, small crystal size, and
uniformity of deposition (Hankin et al. 2007). This method is suited to detect lipids.
1.2.2.2 Data acquisition and analysis
To generate an image, matrix is applied over the entire tissue section, and mass spectra are acquired across the entire tissue section in an ordered array. Generally, spatial resolution ranges from 10 to 100 µm. With currently available lasers, images can be generated in minutes to hours, depending on the sampler size and spatial resolution. Each individual spot has an associated mass spectrum that is analogous to a pixel in a digital image. One can generate an average spectrum from the entire tissue section to aid in the generation of MS images. Each peak from the average spectrum can be displayed as a function of location and relative intensity across the tissue section (Seeley and Caprioli 2011).
1.2.3 Concluding Remarks
Recent developments, from instrumentation to sample preparation, have improved the sensitivity and spatial resolution for MSI. There are enormous benefits to performing MSI on tissue samples. Molecular analyses provide new insight into biochemical processes that are not attainable by other analysis. The application of this technique and metabolic pathway analysis to a rat transient middle cerebral artery occlusion (MCAO) model visualized a spatiotemporal behavior of metabolites in the central metabolic pathway regulated by an ischemia-reperfusion (Miura et al. 2010a). Hattori et al. have also reported spatiotemporal changes in energy charge, adenylates, and NADH during focal ischemia in a mouse MCAO model (Hattori et al. 2010). These findings highlight the potential applications of the in situ metabolomic imaging technique to visualize spatiotemporal dynamics of the tissue metabolome, which will facilitate biological discovery in both preclinical and clinical settings (Miura et al. 2012).
However, some limitations remain to overcome before the broad range of endogenous metabolite imaging can be achieved. As mentioned above, it is generally known that, in MALDI, the detection of molecules is completely dependent on the matrix. Moreover, Matrix effects (otherwise referred to as ionization suppression or enhancement) should be assessed when analyzing complex biological samples without chromatographic separation. The sensitivity and accuracy of quantification between samples of differing matrix composition (including differences between matrices and sample) can be compromised, which means this is a screening and not a quantitative tool. Detectable metabolites by single MSI analysis are a
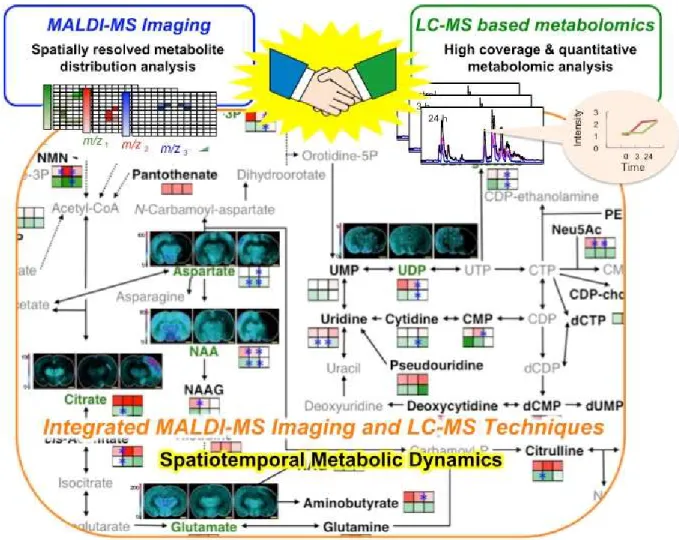
few than standard metabolomics protocols such as LC-MS. Therefore, the combination of MSI and standard bioanalytical protocols is needed to understand detailed biological phenomenon. This combination will allow confident identification of biologically relevant compounds and their localization in tissues (Fig. 1-5).
Fig. 1-5 Summary of spatiotemporal metabolic dynamics
1.3 The aim of this study
In the case of tissue analysis, metabolomics requires not only comprehensive and quantitative but also information of metabolite distributions in the tissue (Fig. 1-5). In the present study, 1) the author developed elucidation technique of detailed metabolic valiance each micro-region using combination of LC-MS-based metabolomics data, which is high comprehensive and quantitative analysis, and MSI data, which is able to visualize metabolites distribution in the tissue. Firstly, to exploit above technique, LC-MS based authentic standard library for comprehensive and high-throughput analysis was constructed. Moreover, the author applied combination technique to MCAO rat brain during infarct formation. To validate MSI data, metabolites extracted from not whole brain but 3 each region (cortex, hippocampus and corpus striatum) at LC-MS analysis, and the author compared metabolite variation in MCAO brain during infarct formation between MSI and LC-MS data. Next, 2) the author performed elucidation of metabolic variance from onset to becoming serious using above technique in cisplatin-induced acute kidney injury, at which metabolite extraction is difficult from each region.
CHAPTER 2
Integrated MALDI-MS imaging and LC–MS techniques for
visualizing spatiotemporal metabolomic dynamics in a rat
stroke model
2.1 Introduction
Stroke is the third major cause of death in the major industrialized countries, and is a brain disease associated with cell death due to a decrease in oxygen and glucose resulting from a lack of blood flow (ischemia) (Green 2008). The symptoms of this disease are caused by both blood flow blockage-induced occlusion injury and oxidative stress-induced reperfusion injury (Martin 2003; Memezawa et al. 1992). To date, several therapeutic agents, including edaravone, have been developed to lessen the ischemia-induced damage. However, the efficacy of such agents was limited for treating acute ischemic stroke patients, because of the limited time window (~3 h after ischemia) (Zhang et al. 2005). Therefore, the development of drugs with a longer or later time window or that function via other mechanisms is necessary.
Previous research addressing the mechanisms of disease, including stroke, have been targeted to particular genes, proteins and metabolites, and the analysis of only a part of the functions related to these biomolecules has been the focus of most investigations (Phillis et al.
1996, 1994). However, the data obtained from such studies is insufficient to understand the complex disease processes using conventional techniques alone, because various other, untargeted, biomolecules may participate in the pathological progress (Jung et al. 2011).
Behaviors of biomolecules are drastically altered by the time elapsed from disease onset, and there are often local differences within the lesion site (Matsumoto et al. 1993). Therefore, to obtain a precise understanding of the biological complexity of disease progression, it is necessary to obtain more comprehensive and spatiotemporal information about the biomolecules in the target site.
Recently, “omics” technology, the analysis of comprehensive biomolecules, has received considerable attention. In particular, metabolomics, the analysis of comprehensive metabolites as a compound-level phenotype of genomic information, can elucidate the biological phenomena unresolved by transcriptomics and proteomics (Griffin and Shockcor 2004;
Holmes et al. 2008; Nicholson et al. 1999). Generally, MS coupled with pre-separation techniques such as liquid chromatography (LC)-MS or gas chromatography (GC)-MS, has been used for the metabolomic studies due to their high coverage (more than several hundred metabolites) and ability to provide quantification (Dunn and Ellis 2005; Werner et al. 2008;
Pohjanen et al. 2007). However, these methods have a drawback in the analysis of tissue samples because of the requirements for metabolite extraction, which causes the loss of information regarding the spatial localization of the metabolites. Visualization of the in situ interactions among a broad range of metabolites and their dynamic changes with information about their localization is indispensable for accurately understanding complex biological processes. In the pathological analysis of tissues with many functional compartments, such as the brain, it is necessary to not only determine the comprehensive metabolites involved in these processes, but also to visualize their spatial distribution within the tissue.
A remarkable new technology, MS imaging (MSI), enables the determination of the distribution of biomolecules present in tissue sections by direct ionization and detection (Caprioli et al. 1997; Miura et al. 2012). This technique can detect various biomolecules simultaneously without any labeling during a single analysis. Therefore, MSI is now being widely used for the in situ imaging of relatively abundant macromolecules, such as proteins, peptides and lipids, and is expected to be a potential tool for the pathological analysis of the brain, kidneys or tumors (Stoeckli et al. 2001; Amstalden van Hove et al. 2010; Vickerman
2011).
We recently succeeded in simultaneously visualizing more than 30 metabolites in normal mouse brain tissue by using matrix-assisted laser desorption/ionization-time of flight (MALDI-TOF)-MSI (Miura et al. 2010a). Moreover, the application of this technique and metabolic pathway analysis to a rat transient middle cerebral artery (MCA) occlusion (MCAO) model allowed for partially visualizing the spatiotemporal behavior of metabolites in the central metabolic pathway regulated by the ischemia-reperfusion insult (Miura et al.
2010a). This MSI technique is expected to be useful as an innovative multi-molecular imaging technique for high-precision pathological evaluation (Kinross et al. 2011). Therefore, an additional understanding of the dynamics of more comprehensive metabolites detected by LC-MS, which cannot be detected by MSI, may lead to further elucidation of the complex pathological mechanisms underlying various diseases.
In the present study, the author performed LC-MS analysis of metabolites extracted from MCAO rat brain, and these data were co-analyzed with our previous and newly added MSI data (Miura et al. 2010a) to investigate the detailed metabolic dynamics during pathological progression. This approach could trace the diverse spatiotemporal metabolic behavior and visualize significant metabolic change in response to disease progression in the rat brain in a model of MCAO during infarct formation after ischemia-reperfusion.
2.2 Materials and methods
2.2.1 Materials
Internal standard compounds sulfanilamide, methionine sulfone, 4-aminoantipyrine, 2-hydroxyundecanate and 4-hydroxybenzophenone purchased from Sigma-Aldrich.
Acetonitrile, ethanol, methanol, 2-propanol, dimethylsulfoxide ammonium formate, formic acid and chloroform were purchased from Wako Pure Chemical Industries, Ltd. A part of metabolite standards (215 species) were kindly supplied from Mitsubishi Tanabe Pharma Corporation. Indium tin oxide (ITO)-coated slide glass and 9-aminoacridine (9-AA) hydrochloride were obtained from Sigma-Aldrich (St Louis, MO, USA). The 9-AA was recrystallized prior to use. The organic solvents, internal standards and metabolite standards used in this study were purchased from Wako Pure Chemical Industries, Ltd (Osaka, Japan).
2.2.2 Analytical condition of LC-MS
The mobile phase conditions were as follows: linear gradient analysis with mobile phase A (H2O with 0.1% formic acid), and mobile phase B (acetonitrile). After a 4 min isocratic run at 100% eluting solvent A, the ratio of eluting solvent B was linearly increased to 35% from 4 to 8 min and to 50% from 8 to 12 min. The use of 50% eluting solvent B was maintained for 5 min. The column was then washed with 100% of eluting solvent B for 5 min, and column equilibration was carried out with 100% eluting solvent A for 7 min. A 3 μL aliquot of the sample solution filtered through a 0.2 μm PTFE filter (EMD Millipore Corporation, Billerica, MA) was injected onto the column with a flow rate of 0.2 mL/min.
For the MS, the instrument was operated using an electrospray ionization source in both positive and negative ionization modes. The ionization parameters were: capillary voltage, 4.5 and -3.5 kV; the nebulizer gas flow, 1.5 L/min; the CDL temperature, 250°C and the heat block temperature, 250°C.
2.2.3 Animal protocol
Male Wistar rats (6 weeks of age) were purchased from Kyudou (Tosu, Japan). The rats were housed in a temperature- and humidity-controlled room (23°C, 78% humidity), and fed a commercial diet (MF; Oriental Yeast, Tokyo, Japan) and water ad libitum. Reversible focal cerebral ischemia was induced with an intraluminal suture to produce a model of MCAO. In brief, anesthesia was induced with 2% isoflurane (Dainippon Pharmaceutical, Osaka, Japan) in air, and was maintained with 1% isoflurane using a facemask. A 1 cm midline incision was made on the anterior neck, and the right common carotid artery, external carotid artery and internal carotid artery were exposed. The common carotid artery and external carotid artery were ligated, and a suture was placed around the internal carotid artery for ligation. An embolus was made by inserting a 4-0 nylon surgical thread into the internal carotid artery through a small incision. The MCA was occluded by advancing the embolus into the internal carotid artery to block the origin of the MCA (Fig. 2-1). After 1 h of MCAO, the MCA was reperfused by withdrawing the embolus. The rectal temperature was maintained by placing the rat on a heating pad under anesthesia. All the procedures and animal care were approved by the Animal Care and Use Committee, Kyushu University, and carried out in accordance with the Guidelines for Animal Experiments, Kyushu University. Extirpated tissue samples were immediately frozen and stored at -80°C prior to use.
Fig. 2-1 A schematic diagram of the middle cerebral artery occlusion (MCAO) model rat.
MCA; middle cerebral artery, ACA; anterior cerebral artery, PCA; posterior cerebral artery.
2.2.4 MSI analysis of brain sections
In this study, the author used three types of MS instruments. For MSI, single reflectron-type MALDI-TOF-MS (AXIMA Confidence, Shimadzu) was used. And For identification of metabolites by MS/MS analysis, quadrupole ion trap (QIT)-type (AXIMA QIT, Shimadzu) and TOF/TOF-type (AXIMA Performance, Shimadzu) instruments were used. As shown in Fig. 2-2A, 10 µm thick frozen coronal sections were used for the analysis, as described previously (Miura et al. 2010a). In the MSI experiments, the data were acquired in negative ionization mode with 50 μm spatial resolution (10 laser shots/data point), and the signals between m/z 50 and 1000 were collected. 9-AA exhibits very few matrixderived interferences in the low-mass range, achieved great improvement for the sensitivity of metabolite analysis (detection potential with subfemtomole sensitivity for various endogenous metabolites) that is advantageous for the simultaneous detection of a variety of cellular metabolites (Miura et al. 2010b; Yukihira et al. 2010). The acquired MSI data were processed with the freely available software program, BioMap (http://www.maldi-msi.org). For normalization of the imaging data, we first constructed an averaged mass spectrum image ranging from m/z = 50 to 1000 over the whole region of the tissue section. Second, averaged mass intensity maps of the overall mass range were created. Third, averaged mass intensity maps divided the intensity maps of each peak. This means that the intensity of each peak in each pixel was divided by the average of the total ion count of each pixel. This normalization process is critical for allowing a more quantitative comparison of the MSI data acquired from different tissue sections, because MALDI ionization has been known to cause both spot-to-spot and sample-to-sample variation in the signal intensities based on the heterogeneity of matrix crystals. The signal intensity of each imaging data in the figure was
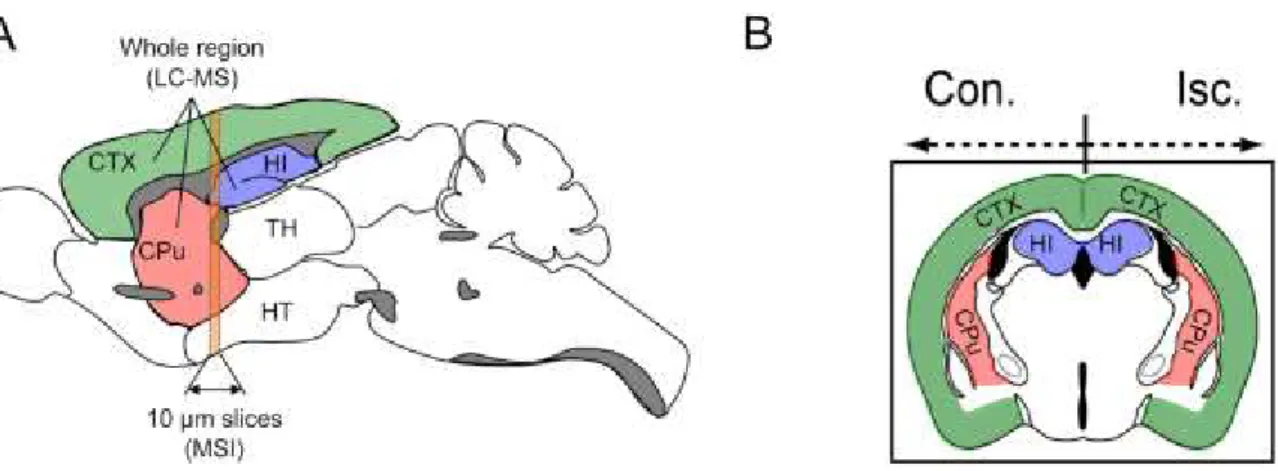
Fig. 2-2 A schematic diagram of the sampling areas for the MSI and LC-MS analyses.
Rat brain tissue samples were collected 0, 3 and 24 h after reperfusion following 1 h of MCAO. A schematic illustration represents the structures of the sagittally (A) and coronally (B) sectioned brains. In both the contralateral (Con.) and ischemic (Isc.) hemispheres, the whole cerebral cortex (CTX), hippocampus (HI) and corpus striatum (CPu) were enucleated from the brain for the LC-MS analysis. Coronal brain sections, including the CTX, CPu and HI, were subjected to the MSI analysis.
represented as the normalized intensity.
2.2.5 Metabolomic analysis of brain extracts by LC-MS
The rat brain samples were prepared 0, 3 and 24 h after reperfusion following 1 h of MCAO. Metabolites were extracted from the whole cortex (CTX), hippocampus (HI) and corpus striatum (CPu) in the ischemic (Isc.) and contralateral (Con.) hemispheres. Each tissue sample was homogenized in 80% MeOH, including 10 μM sulfanilamide and 2 µM 4-aminoantipyrine to evaluate the extraction efficiency, on ice (50 mg per tissue in 1 mL vials) using dounce tissue grinders. After centrifugation at 15,000 × g for 30 min at 4°C, the supernatant was collected, and an equal volume of a 2:1 H2O/CHCl3 solution was added and further mixed vigorously for 30 s. Each sample was then centrifuged at 15,000 × g for 20 min at 4°C. After centrifugation, the aqueous layers were collected. A centrifugal evaporator (CVE-2000, EYELA, Tokyo, Japan) was used for solvent removal and sample concentration.
The resultant samples were stored at -80°C until the analysis. Samples were dissolved in 30 μL of 20% acetonitrile, including 10 μM 4-hydroxybenzophenone as an internal standard on ice, prior to the LC-MS analysis (LCMS-IT-TOF, Shimadzu Corporation, Kyoto, Japan). The instrument was fitted with a pentafluorophenylpropyl column (Discovery HS-F5 column 250
× 4.6 mm, Supelco, Bellefonte, PA), ovened at 40°C. Analytical condition is above mentioned (see “analytical condition of LC-MS”). Peak picking, alignment and normalization of the mass spectral data obtained by LC-MS were performed using the Profiling Solution software program (Shimadzu Corporation, Kyoto, Japan). Identified metabolites were quantified using authentic standards, and then the data were expressed as the ratios (ischemic hemisphere/contralateral hemisphere).
2.2.6 Multivariate statistical analysis
A principal component analysis (PCA) was performed using the SIMCA-P+ software program (Version 12, MKS-Umetrics, Umeå, Sweden), allowing the visualization of LC-MS multivariate information. All variables were centered on the average and were normalized by dividing by the standard deviation (unit variance).
Heat maps were displayed using the freely available software program, MultiExperiment Viewer (http://www.tm4.org). The metabolite concentration data of LC-MS and/or mass peak intensity data of MSI were converted to the ratio of the Isc. hemisphere to the Con.
hemisphere. A heat map analysis was performed on the data to visualize the metabolic dynamics.
2.3 Results and discussion
2.3.1 Construction of LC-MS based standard metabolites library
Each of 472 metabolite standards were dissolved in water (Mill-Q, Millpore), ethanol, 2-propanol or dimethylsulfoxide (10 mg/mL). Then, standard samples were mixed (each metabolite standards final concentration 1 mg/mL). In addition, 300 µM methionine sulfone, 3 µM 4-aminoantipyrine, 5 µM 2-hydroxyundecanate and 1 µM 4-hydroxybenzophenone were added as an internal standard, prior to analysis.
LC-MS was carried out using an LCMS-IT-TOF (Shimadzu). For chromatographic separation, a pentafluorophenylpropyl (PFPP) column (Discovery HS-F5 column; 250 mm × 4.6 mm; Superco) was used. PFPP column basically provides reversed-phase separations that are distinctly different from reversed-phase columns such as C18 column. Fluorinated, silica-based phases are becoming increasingly popular alternatives to traditional alkyl phases owing to their differential selectivity and retention for a variety of analyte classes. In addition to dispersive interactions available on common C18 phase, dipole interactions of fluorosubstituted ligands, π-π interactions between solutes and phenyl-ligands as well as charge transfer and ion-exchange interactions also have a considerable impact on the selectivity of PFPP column (Bell and Jones 2005; Euerby et al. 2003; Marchand et al. 2005;
Needham et al. 2000; Nichthauser and Stepnowski 2009; Yang et al. 2010; Yoshida et al. 2007, 2009).
472 metabolite standards were analyzed by LCMS-IT-TOF in positive/negative mode using PFPP columns. 472 metabolite standards of 302 (63%) with PFPP were successfully detected
(see appendix). Acquisition of LC-MS data was performed under LCMSsolution (Shimadzu).
LCMSsolution was used for visualization and manual processing of LC-MS data. Information acquired from LC-MS analysis of metabolite standard (m/z, retention time, ion species, intensity and Δppm) was accumulated. Moreover, these information were enrolled in Microsoft Excel using visual basic for application, and it enabled automatically estimation in extracted metabolites from biological samples.
2.3.2 Experimental Flow
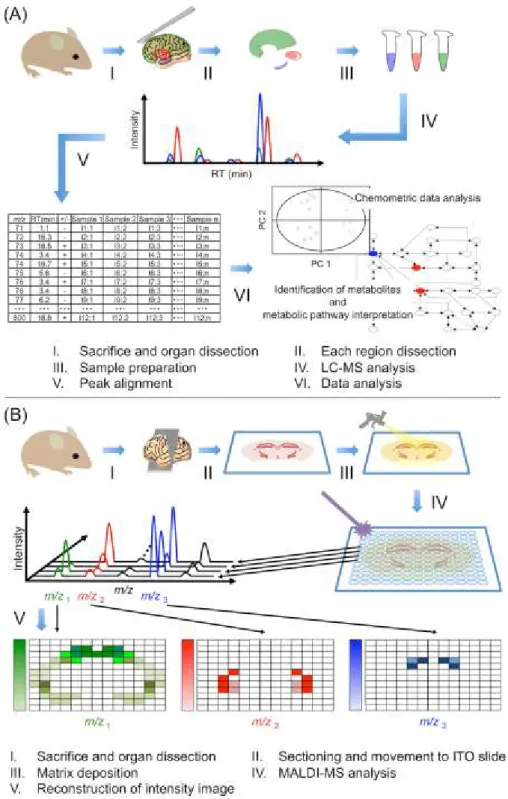
In this study, the author analyzed the metabolic dynamics in the brain of MCAO model rats during infarct formation after ischemia-reperfusion by integrating different MS techniques (MSI and LC-MS) (Fig. 2-3). To reveal the differences in metabolic variations in each functional tissue region of the brain, a metabolomic analysis of the CTX, CPu and HI regions was performed (Fig. 2-2). Rat brain samples were collected at different time intervals after ischemia-reperfusion (0, 3 and 24 h, n=5) to investigate the time-dependent metabolic variations after reperfusion following 1 h of MCAO. To compare the metabolic state in the Isc.
and Con. hemispheres of the MCAO brain (Fig. 2-2B), metabolites extracted from three different whole tissue regions (CTX, HI and CPu) were also measured by LC-MS. The CTX, CPu and HI tissue samples were coronally sectioned at 10-µm thickness, and metabolites on these partial tissue regions were directly measured by MSI to visualize their spatial distribution.
Fig. 2-3 Experimental procedures for the LC-MS and MSI analyses. (A) A schematic representation of the LC-MS analysis workflow. (B) An overview of the MSI analysis procedure.
2.3.3 Global Investigation of Region-Specific Metabolic Dynamics during Infarct Formation
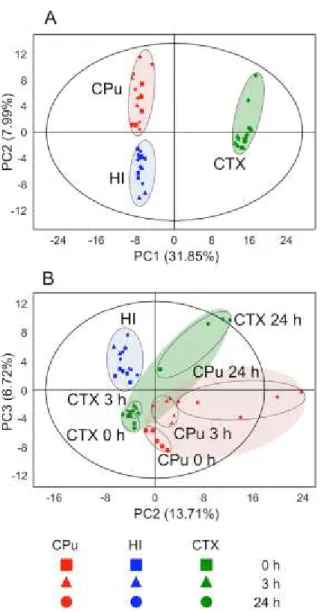
In the present study, the author performed a holistic evaluation of the metabolic profile in three regions (CTX, CPu and HI) and in each hemisphere (Isc. or Con.) at different times after reperfusion (0, 3 and 24 h) by a multivariate statistical analysis using LC-MS data sets (Fig.
2-3). The author used an exploratory data analysis, PCA, which provides a summary or overview of all observations or samples in the data. In addition, groupings trends and outliers can be found easily. In the Con. hemisphere (Fig. 2-4A, Fig. 2-5), the cluster formation of each region was observed, suggesting that the metabolic states were clearly different among the three representative compartments (CTX, CPu and HI). Such region-specific clusters were also formed in the Isc. hemisphere, and further time-dependent separation was observed in both the CTX and CPu regions, unlike the HI (Fig. 2-4B, Fig. 2-6). These results indicate that the metabolic states of the CPu and CTX in the Isc. hemisphere were different from those in the Con. hemisphere, and that there were further time-dependent changes in response to ischemia-reperfusion injury. It is known that the MCA blood supply is important in both the CPu and CTX regions, but not in the HI region (Martin 2003; Kitagawa et al. 1998). This fact may provide insight into the region-specific metabolic alterations after ischemia-reperfusion.
Next, the author investigated the variations in each metabolite level in the CTX and CPu regions showing a significant metabolic change in response to disease progression. With regard to 47 common metabolites detected in both the CTX and CPu regions, changes of their ratio (Isc./Con.) at each time point were shown as a heat map (Fig. 2-7). The concentrations of almost all of the nucleic acids, except for ATP, UMP and CDP-choline in the CPu and ATP and IMP in the CTX, were reduced in a time-dependent manner. The peak accumulation of
Fig. 2-4 The multivariate analysis of cerebral metabolomic changes induced by reperfusion following 1 h MCAO. The CPu (red), HI (blue) and CTX (green) extracts from the contralateral (A) and ischemic hemispheres (B) at 0 h (square), 3 h (triangle) and 24 h (circle) after reperfusion were measured by LC-MS, and the resulting MS spectral data were subjected to an exploratory data analysis (PCA). The separate score plot is shown for each hemisphere’s data sets.
Fig. 2-5 The multivariate analysis of cerebral metabolomic changes in contralateral hemisphere induced by reperfusion following 1 h MCAO. The CPu (A), HI (B) and CTX (C) extracts from the contralateral hemispheres at 0 h (square), 3 h (triangle) and 24 h (circle) after reperfusion were measured by LC-MS, and the resulting MS spectral data were subjected to an exploratory data analysis (PCA).