九州大学学術情報リポジトリ
Kyushu University Institutional Repository
STUDY ON THE OPTIMIZATION OF DUMPING DESIGN FOR OPEN PIT METAL MINES IN MONGOLIA: A CASE STUDY OF THE ERDENET MINE
アマルサイカン, ツェデンドルチ
http://hdl.handle.net/2324/1959123
出版情報:九州大学, 2018, 博士(工学), 課程博士 バージョン:
権利関係:
STUDY ON OPTIMIZATION OF DUMPING DESIGN FOR OPEN PIT METAL MINES IN MONGOLIA: A CASE STUDY OF THE
ERDENET MINE
A DOCTORAL DISSERTATION
Submitted to the Department of Earth Resources Engineering Graduated School of Engineering
Kyushu University
As a partial fulfillment of the requirement for the degree of Doctor of Engineering
By
Tsedendorj AMARSAIKHAN
Supervised by
Assoc. Prof. Dr. Takashi SASAOKA
Department of Earth Resources Engineering Graduate School of Engineering
Kyushu University Fukuoka, Japan
ii
Abstract
The mining sector in Mongolia is one of the largest financial contributors to the state economy. The share of mineral exports is 88% out of total exports that amounts to almost one-third of the government revenues and contributes 20% to the country’s GDP. The primary outputs of the mining industry are copper and gold, iron ore, molybdenum, fluorspar and coal. In Mongolia, the projects of mineral resources are operating by open pit mining method since 1960s. A relative deeper and large scale open pit mines developed in last 10 years and which are mainly operated in copper ore and hard coal mines. The depth and scale of open pit mines has been increasing with the mining capacity, mineral products and high economic growth in major projects.
However, geotechnical investigations, data and practical experience are insufficient in many active deeper open pit mining. It is the main problems in Mongolia for mine planning such as open pit optimizing, slope stability studies and appropriate large waste dump design etc. at most large scale open pit mines. In order to understand of this problems, a case study is conducted at the Erdenet Cu-Mo open pit mine in northern Mongolia, which currently faces the challenge of designing overall slope angles for current pit depth around 300 meters. The design problem and lack of knowlegde for optimzation of open pit and dumping area was the starting point for this work. The purpose of this research is to develop an innovative method for optimization of appropriate design of open pit and dumping using geotechnical, geochemical and economic data at one of major mining project, Erdenet Cu-Mo porphyry deposit. The dissertation consists of seven chapters and the main contents in each chapter are as follows:
Chapter 1: This chapter introduce the information about the country and mining industry in Mongolia, problem descriptions of large scale open pit mines and the general background of studies including the processes of optimization procedures of open pit mine and dumping, problem description and literature review and survey of previous studies, objective and outline of dissertation are proposed.
Chapter 2: This chapter describes the general information of the Erdenetyn-Ovoo Cu- Mo deposit mine site, geological conditions, mining activity and mine site problems
iii
related to the objectives of the research. The total area of the Erdenetyn-Ovoo Cu-Mo deposit mine project is 5,500 km2. On the basis of exploration surrounding the mine and feasibility study, ore reserves in the Erdenet Central deposit and the Erdenet Southeast (Oyut) deposit were calculated to be 1,250,000 tons (0.43 % Cu, 0.018 % Mo) and 41,890,000 tons (0.40 % Cu, 0.007 % Mo) respectively. The open pit mine currently covers an area of 2.5x1.5 km2. The geological explorations in the deposit have been studied for the purpose of estimating and increasing the reserves and there are very insufficient studies for geotechnical research. Due to the insufficient of geotechnical investigation and researches, the stability angle, the dimensions of the design of the open pit mine and the underlying dimensions of the open pit mine are justified. Based on these real problems, the study is subsequently focused to develop an innovative method to optimization of appropriate design of open pit and dumping area using geotechnical, geochemical and economic data.
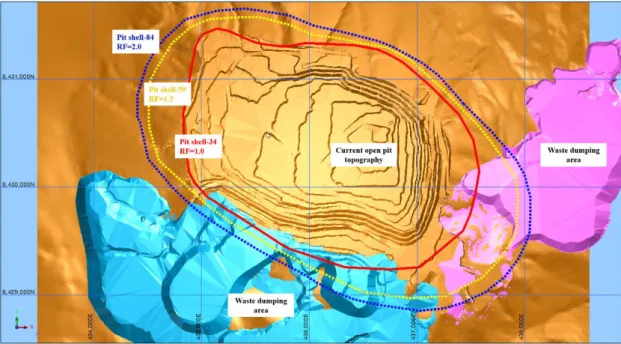
Chapter 3: This chapter discusses about the determination of the nested pit shells, pushbacks and ultimate pit limit of the Erdenet Cu-Mo deposit, as well as open pit optimization study through geological model, and rock mass characterization and space factors to optimize the design of mining and dumping. In the research, the Geovia Surpac software is utilized for generating a 3D geological and deposit block model, the Rocscience Dips software is for kinematic analyses and the Geovia Whittle software is for establishing the final pit limit in terms of the maximum Net Present Value (NPV) and associated pushbacks to produce a best case mining scenario were used. From the results, Pit shell-34 with Revenue Factor=100% covers the maximum net present value (NPV). And the result differences between the Pit shell-34 (RF=1.0) and Pit shell-84 (RF=2.0) are 79 mil. $ of NPV (2294 mil.$ undiscounted cash flows) and 2155.8 mil.t.
of waste rock. From the sensitive analysis, resource in open pit mine is the most sensitive to metal prices. When the metal price drops to 30%, while the sulfide ore decreases to 935 million tonnes and increases by 30% to 497 million tonnes. Increasing the overall slope angle of the open pit by 4°, amount of the waste rock decreased very low as 3.3%. However, decreasing the overall slope angle of the open pit by 4°, amount of the waste rock increased quite high as 21.5%. The current concept of the Erdenet Mining Corporation has a total of 950 mil.t of ore at the open pit mine depth of 905m.
iv
The results of pit optimization analysis show the possibility of open pit mine depth considering stability condition reach to the elevation of 780m which allows 125m more depth and to allow more than 550 mil.t of ore reserve to be exploited by the current Concept of Erdenet mining. Determining the location of the waste dumping and surface infrastructure and constructions based on the established open pit boundaries is quite risky. Open pit mining boundary is quite dynamic and is constantly changing from the beginning of the mine life to the end. The size, location and final shape of open pit should be optimized based on prospective production prices and open pit revenue factors are important in planning the location of waste dumps, stock piles; processing plant, access roads and other surface constructions, facilities and infrastructures.
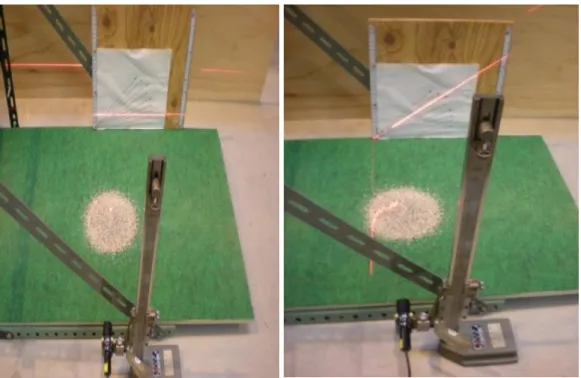
Chapter 4: This chapter discussed the formation mechanism of benches on stability of dumping area to optimize waste dump design. In open pit mine, providing a proper dump is crucial to mine’s successful operation. The improper waste dump result in stability issues which may affect safety and production of the mine. The geological overview, dumping operation, waste particle distribution, and stable problems were investigated at the Erdenet open pit mine. Then, a series of the experiments was conducted in the laboratory to simulate the formation process of single bench, multiple benches, and the efficiency of dumping operation’s design. Finally, the relationship between safety factor of dumping area and bench height, bench angle, bulk factor of waste rock, and truck transport were simulated by using numerical simulation. From the results, two methods are proposed to increase the stability of dumping areas. Firstly, the loose earth and all vegetation need to be removed to make the floor strong seam.
Secondly, floor surface of dumping area becomes rough by blasting, which can prevent the floor to be slide surface. Design of the dumping operation must consider the total efficiency of ground leveling operation work and forming dumping area work. Height of bench can be as high as possible, up to the allowed safety values of workers and equipment working. Angle of bench is not important to dumping operation. Bulk factor of waste rock should be as small as possible to improve dumping operation stability.
The activity of transport truck in dumping area has a beneficial effect on stability of dumping area.
v
Chapter 5: This chapter discussed about the effects of different wide of buffer zone for different pit wal as well as was dump’s bench configuration that fit a given stability of the slope. Creating waste dump near to the pit is one of the solusions when the waste rock contain low grade of valuable minerals that planned to be extracted in future, as adopted by Erdenet open pit mine. Waste dump alongside the pit gives advantage in regards to waste hauling cost. However, from geotechnical point of view, constructing a waste dump alongside the pit should be planned well thus satisfy the stability criteria by adopting buffer zone, the distance between crest of pit wall and toe of waste dump slope. This chapter also discussed about the influence of cohesion and friction angle on pit wall stability. According to simulation result, when the configuration is without buffer zone, the SRF will be strongly influenced by pit wall height and slightly influenced by waste dump height. However, when the configuration considers the buffer zone, it would be strongly influeced by length of buffer zone besides the pit wall height. By having a buffer zone on the configuration is able to reduce gravity loading on the pit wall thus able to reduce the shear stress along the wall. When the pit wall angle is increased, the tensile stress around toe of pit wall due to increase in self-load of the wall. The study also shows that the stability is changed when the quality of friction angle and cohesion is changed. However, a changing of friction angle will give more impact than that of cohesion. Based on the study result, a proper configuration can be designed for any conditions of rock quality particularly friction angle and cohesion.
Chapter 6: This chapter discussed about optimization the fleet efficiency and utilization through a detailed haulage analysis, and to identify any potentioal cost savings available within the dumping operation of Erdent open pit mine. The haulage and dumping aspect of peint pit mining operations is one of the largest cost components of the mining cost constituing approximaterly 50-60% of mining operational costs. The overall aim of correct dump design is to plan a series of wste disposal stages that will effectively mininmize the vertical and horizontal distances (buffer zone) between the pit and potential waste dump site that has been discussed at Chapter 5. Two haulage distance i.e. 100 m and 200 m buffer length are considered. The study shows that the estimation of dumping cost analyses ‘S to All’ direction of d200 scenario is covers the
vi
maximum Net present cost (NPC) and the both directions of d100 scenario are getting minimum NPC and DCPT values. And the result differences between the d200, ‘S to All’ and d100, ‘N to All’ is totally 233.7 mil.$ of NPC (846.4 mil.$ of undiscounted cash flows) and 0.2$ of DCPT.
Chapter 7: This chapter concludes the results of this research.
vii
Acknowledgements
Deep appreciation and sincere gratitude are expressed to Associate Professor Dr.
Takashi SASAOKA, my supervisor from the Laboratory of Rock Engineering and Mining Machinery, Kyushu University, for his invaluable guidance, encouragement and support throughout the research. His expertise on mining and geological engineering has been invaluable and many inspiring discussions with him have been of great value to me. Fortunately, this dissertation is achieved with his strong supports and valuable comments. His willingness to give his time has been very much appreciated.
I would like to extend my deep gratitude to Professor Dr. Hideki SHIMADA, Head of the Laboratory of Rock Engineering and Mining Machinery, Kyushu University, for his guidance, precious and constructive suggestions to improve this research. His encouragement is an important motivation for me to pursue the academic study.
Sincere gratitude also goes to the member of my examination committee, Professor Dr.
Yasuhiro MITANI, Department of Civil Engineering, Kyushu University, for raising a number of interesting points for discussion. His valuable comments toward improving my work are very much appreciated.
Special appreciation and gratitude are given to Mr. Suichi Fujita, Assistant Professor Dr. Sugeng WAHYUDI, Assistant Professor Dr. Akihiro HAMANAKA and all friends from the Laboratory of Rock Engineering and Mining Machinery, Kyushu University, for their enthusiastic and grateful help, encouragements and friendships.
Sincerely appreciation is also given to my father, Professor Dr. Sodnom TSEDENDORJ, Head of Mining Research and Design Center, Mongolian University of Science and Technology, for his boundless love, guidance and support for me. He has walked me through all the stages of the writing of this thesis.
Invaluable supports and help during my research and dissertation writing from all of you will keep in my mind.
Finally, special and deepest thanks go to my family for their endless love, support, great patience and encouragement throughout my whole life.
Tsedendorj AMARSAIKHAN Kyushu University, Fukuoka, Japan August 2018
viii
Table of Contents
1.1. Mining industry of Mongolia ... I-1 1.2. Problem descriptions of large-scale open pit mines in Mongolia ... I-5 1.3. General background ... I-6 1.4. Literature review ... I-12 1.5. The objective of research project ... I-16 1.6. Study approach ... I-17 1.7. Organization of the thesis ... I-17 References ... I-18
2.1. Location and regional information ... II-21 2.1.1. Information of Erdenet city, region. ... II-22 2.1.2. Climate ... II-23 2.1.3. Topography and Drainage System. ... II-23 2.2. Geological conditions of Erdenetyn-Ovoo deposit ... II-23 2.2.1. Regional geology ... II-23 2.2.2. Erdenet deposit geology ... II-26
ix
2.3. Mining activity ... II-29 2.4. Site problems related to the objectives of the research ... II-31 Summary ... II-34 References ... II-35
3.1. Introduction ... III-1 3.2. Methodology ... III-3 3.3. 3D block modelling of Cu-Mo deposit for open pit optimization ... III-3 3.3.1. Block model summary ... III-4 3.3.2. Topographical features ... III-5 3.3.3. Lithological model. ... III-6 3.3.4. Structural model ... III-9 3.3.5. Weathering zonation model ... III-10 2.3.3. Rock type model ... III-11 3.4. Stability assessment for open pit ... III-12 3.4.1. Modes of Failure ... III-13 3.4.2. Stereographic Analysis ... III-14 3.5. Economic principles ... III-18 3.5.1. Metal recovery ... III-18 3.5.2. Prices and expenses ... III-20 3.6. The Lerch-Grossman’s analysis ... III-22 3.6.1. Nested pit shell optimization ... III-23 3.6.2. Cashflow analyses of specified case ... III-25 3.6.3. Sensitivity analysis ... III-30 3.6.4. The prospective boundaries of open pit ... III-31
x
3.7. Summary ... III-34 References ... III-36
4.1. Introduction ... IV-38 4.2. Waste particle size distributions ... IV-3 4.3 Experiment methods and results ... IV-4 4.3.1 Setting of tests ... IV-4 4.3.2 Single bench ... IV-6 4.3.3 Multiple benches ... IV-10 4.3.4. Efficiency of dumping operation design ... IV-14 4.4. Simulation for the Effects of Dumping Formation and Operation on Stability of Dumping Area ... IV-15 4.4.1. Dumping formation effects ... IV-15 4.4.2. Dumping operation effects ... IV-21 4.5. Summary ... IV-23 References ... IV-24
5.1. Introduction ... V-1 5.2. Method of Study ... V-3 5.3. Numerical simulation ... V-7 5.3.1. Without buffer zone ... V-7 5.3.2. With buffer zone ... V-9 5.4. Discussion ... V-14
xi
5.4.2. Effect of height of pit wall and waste dump on slope stability under different buffer zone condition ... V-16 5.4.3. Effect of changing pit wall angle ... V-18 5.4.3. Effect of changing friction angle and cohesion ... V-19 5.5. Summary ... V-24 References ... V-25
6.1. Introduction ... VI-1 6.2. Model implementation ... VI-3 6.2.1. Dump design ... VI-3 6.2.2. Haul road design ... VI-5 6.2.3. Haulage routes and truck types ... VI-6 6.2.4. Material flows ... VI-7 6.3. Numerical simulation for the production scheduling and the comparisons between the dump design scenarios ... VI-7 6.3.1. Directions of dump construction ... VI-8 6.3.5. Graphical results of dumping progressions ... VI-9 6.3.2. Haulage distance ... VI-11 6.3.3. Estimated truck hours ... VI-12 6.3.4. Truck productivity per flat haulage distance (t/km) ... VI-14 6.4. Estimation of the dumping cost ... VI-15 Summary ... VI-18 References ... VI-18
7.1. Introduction ... VII-1
xii
7.2. Site description: Northwest section of Erdenetyn-Ovoo Cu-Mo deposit .... VII-2 7.3. Determination of ultimate pit design ... VII-3 7.4. Formation mechanism of benches on stability of large scale dumping ... VII-4 7.5. Buffer zone optimization ... VII-4 7.6. Optimization of dumping area ... VII-5
xiii
List of Figures
Figure 1-1 Geographical location of Mongolia ... I-1 Figure 1-2 Share of mining sector in country’s GDP, Industrial and Export Product
(Mongolian Statistical Information Center, www.1212.mn, 2016) ... I-3 Figure 1-3 Location map of major mineral deposits in Mongolia (MRAM 2016) ... I-4 Figure 1-4 Open pit slope geometry parameters ... I-9 Figure 1-5 Directed graph Lerch-Grossman ... I-15 Figure 2-1 Location map of Erdenetyn Ovoo Cu-Mo deposit ... II-22 Figure 2-2 Schematic map of the Mongol-Okhotsk fold belt and the setting of the
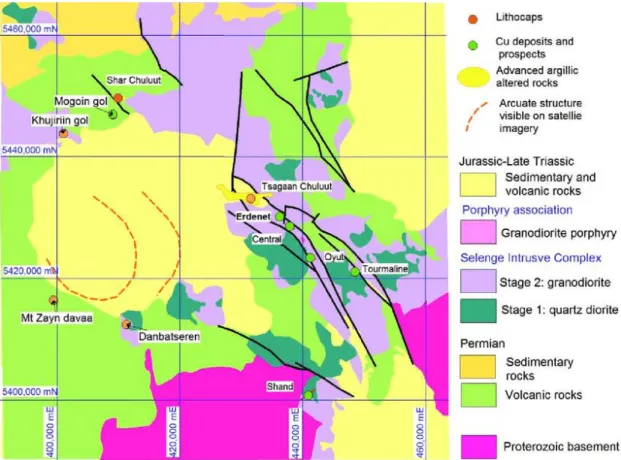
Erdenet ore deposit.. ... II-25 Figure 2-3 Simplified geology of the Erdenet district (Kavalieris et al.,2017) ... II-26 Figure 2-4 Geology map of Erdenet deposit NW section (Undrakhtamir et al., 2017) ... II-27 Figure 2-5 Geology sections of Erdenet deposit NW section (Undrakhtamir
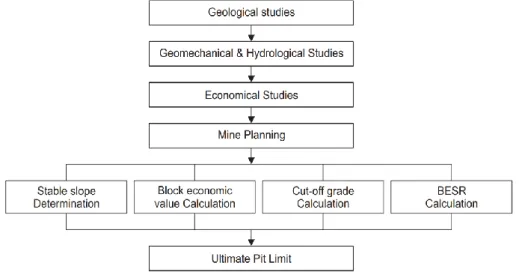
et al., 2017) ... II-28 Figure 2-6 Total material movement in last 15 years (EMC, 2016) ... II-31 Figure 2-7 Intersection between open pit and dumping area ... II-32 Figure 2-8 Re-located dumping area ... II-33 Figure 2-9 Faults in south side of open pit ... II-34 Figure 3-1 Design procedure in an open pit mine with regard to ultimate pit limit
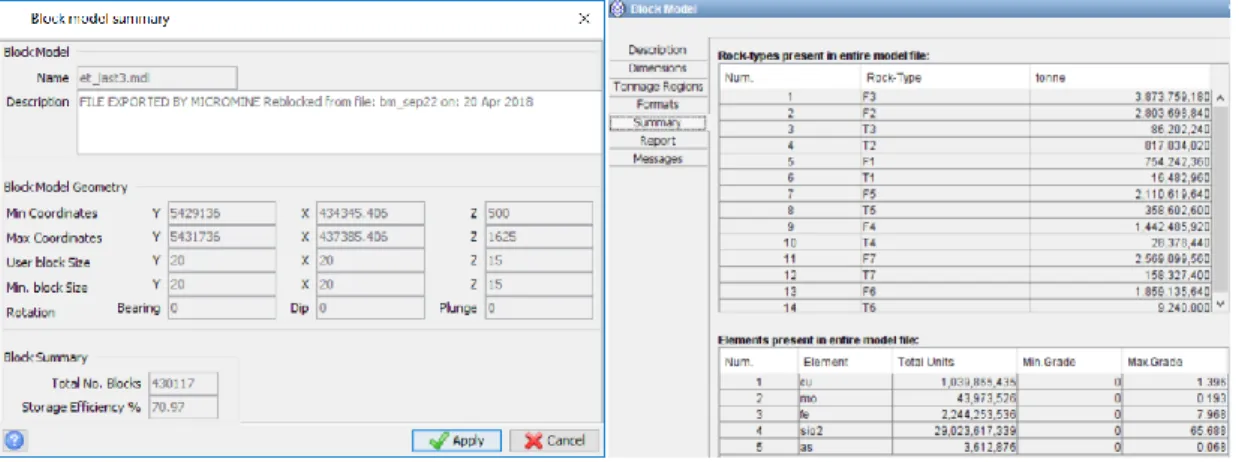
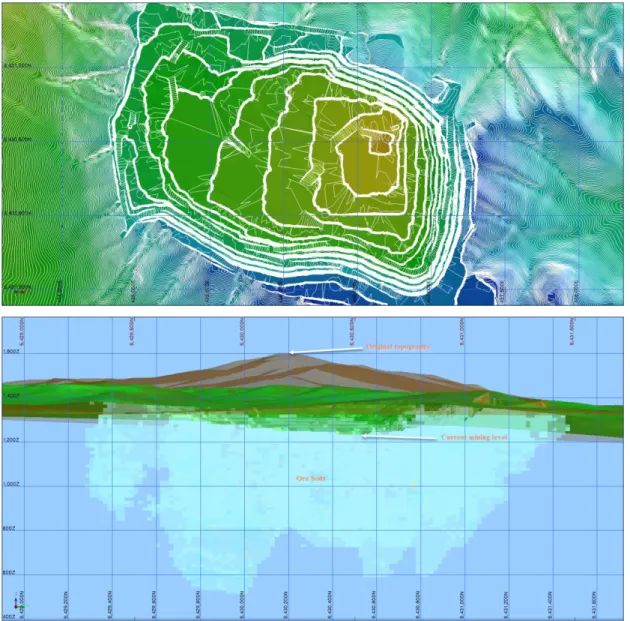
determination ... III-2 Figure 3-2 3D block model of NW section, Erdenetyn-Ovoo Cu-Mo deposit ... III-4 Figure 3-3 Orebody block model, Cu≥0.2 wt % ... III-4 Figure 3-4 Block model summary ... III-5 Figure 3-5 Original topographical surface and the current mining level of the deposit
for optimization study ... III-6 Figure 3-6 Lithology model, a. original topography, b. current mining level ... III-7 Figure 3-7 Lithology Domains ... III-8
xiv
Figure 3-8 Stereonet plots of major faults ... III-9 Figure 3-9 3D surface plane of faults ... III-10 Figure 3-10 Structural domain ... III-10 Figure 3-11 Weathering model ... III-11 Figure 3-12 Rock type model ... III-12 Figure 3-13 Stereographic results for overall slope angle of 45° wedge failure analyses
in fresh zone for each wall orientations; a.east, b.west, c.north and d.south .. III-15 Figure 3-14 Stereographic results for overall slope angle of 45° wedge failure analyses
in Stuctural domain-1; a.rock type T-1, b.rock type F-1 ... III-15 Figure 3-15 Stereographic results for overall slope angle of 37° wedge failure analyses
in fresh zone for each wall orientations; a.east, b.west, c.north and d.south .. III-16 Figure 3-16 Stereographic results for overall slope angle of 36° and 38° wedge failure
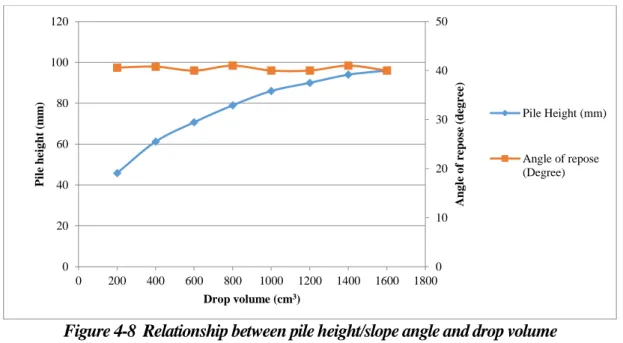
analyses in Stuctural domain-1; a.rock type T-1, b.rock type F-1 ... III-16 Figure 3-17 Slope set input data for pit optimization ... III-18 Figure 3-18 Economical data summary for Whittle model ... III-22 Figure 3-19 Nested pit shells by the open pit optimization ... III-25 Figure 3-20 Results of cash flow analysis ... III-28 Figure 3-21 Nested pit shells a. Pit shell-1 (RF=0.34) b. Pit shell-84 (RF=2.0) .... III-29 Figure 3-22 Ultimate pit design, Pit shell-34 (RF=1.0) ... III-29 Figure 3-23 Sensitivity analysis of metal prices ... III-30 Figure 3-24 Sensitivity analysis of operational cost ... III-30 Figure 3-25 Sensitivity analysis of overall pit slope angle ... III-31 Figure 3-26 Historical Cu price in last 40 years (www.infomine.com/) ... III-33 Figure 3-27 Pit shells RF=1.0, RF=1.5, RF=2.0 and current open pit mining ... III-34 Figure 4-1 Shovel-truck-bulldozer dumping operation ... IV-2 Figure 4-2 Dumping area of Erdenet mine ... IV-3 Figure 4-3 Overview of the experimental device ... IV-5
xv
Figure 4-4 Process to measure the height and the repose angle ... IV-6 Figure 4-5 Process to measure the length and width ... IV-6 Figure 4-6 Relationship between pile height and drop height ... IV-7 Figure 4-7 Relationship between slope angle and drop height ... IV-7 Figure 4-8 Relationship between pile height/slope angle and drop volume ... IV-8 Figure 4-9 Diagram of length, height and repose of angle of bench ... IV-9 Figure 4-10 Diagram of dumping order and interval distance ... IV-10 Figure 4-11 Diagram of elevation difference and pile height measurements ... IV-11 Figure 4-12 Relationship between the increase of pile height and the pile number .. IV-
12
Figure 4-13 Relationship between the increase of the fifth pile height and drop interval ... IV-12 Figure 4-14 Ratio of increase height – ratio of interval of drop point to volume .. IV-13 Figure 4-15 Process of ground leveling operation work ... IV-14 Figure 4-16 Relationship between the elevation difference and interval distance
(200cm3) ... IV-14 Figure 4-17 Annual growth of dumping area volume of Erdenet mine ... IV-16 Figure 4-18 Input parameters regards to dump design model ... IV-17 Figure 4-19 Maximum shear strain plots for the dump designs ... IV-18 Figure 4-20 Relationship between dump height, safety factor and total capacity of
dumping area ... IV-19 Figure 4-21 Input parameters regards to dump design model ... IV-20 Figure 4-22 Maximum shear strain plots for the dump bench designs ... IV-20 Figure 4-23 Relationship between dump height, safety factor and total capacity of
dumping area ... IV-21 Figure 4-24 Relationship between bulk factor of waste rock and volume capacity
increase, safety factor of dumping area ... IV-22 Figure 4-25 Geological model as the truck load force is 0.2 MN/m ... IV-22
xvi
Figure 4-26 Relationship of truck load and safety factor of dumping area ... IV-23 Figure 5-1. Aerial photos of location of waste dump (source: Google maps). ... V-1 Figure 5-2. Re-located dump area. ... V-2 Figure 5-3. Sectional illustration of pit wall and waste dump configuration. ... V-2 Figure 5-4. Configuration of numerical calculation. ... V-6 Figure 5-5. Simulation model by means finite element method phase2. ... V-7 Figure 5-6. Result of bench stability simulation for 240 m pit wall height with 50 m
wasted dump height without buffer zone. ... V-8 Figure 5-7. Result of bench stability simulation for 340 m pit wall height with 50 m
wasted dump height without buffer zone. ... V-9 Figure 5-8. Result of bench stability simulation for 440 m pit wall height with 50 m
wasted dump height without buffer zone. ... V-9 Figure 5-9. SRF for different pit wall height and waste dump height under without
buffer zone condition. ... V-10 Figure 5-10. Buffer zone’s influence on bench stability for case of 240 m pit wall height
with 50 m wasted dump height: (A) 100 m buffer length; (B) 200 m buffer length.
... V-11 Figure 5-11. Buffer zone’s influence on bench stability for case of 340 m pit wall height
with 50 m wasted dump height: (A) 100 m buffer length; (B) 200 m buffer length.
... V-12 Figure 5-12. Response on a changing of waste dump height to buffer zone’s role on
bench stability for case of 340 m pit wall height with 100 m buffer length: (A) 50 m waste dump height; (B) 100 m waste dump height; (C) 150 m waste dump height.
... V-12 Figure 5-13. SRF for different pit wall height, buffer length and waste dump height. V-
13
Figure 5-14. Correlation between constant k of SRF equation with pit wall height under without buffer zone condition. ... V-15 Figure 5-15. Constant k as function of tpw for 100 m buffer length and 200 m buffer
length. ... V-17 Figure 5-16. Buffer zone’s influence on bench stability for case of 60o pit wall angle of
340 m pit wall height with 50 m wasted dump height. ... V-19 Figure 6-1 Dumping design scenarios ... VI-4
xvii
Figure 6-2 Dumping area block model summary; a.d100, b.d200 ... VI-5 Figure 6-3 Haul design ... VI-6 Figure 6-4 Scheme of material movement ... VI-7 Figure 6-5 Material movement schedule from open pit mine ... VI-8 Figure 6-6 Directions of dump construction ... VI-8 Figure 6-7 Dumping progressions in d100 scenario according to the: a. N to All, b. S to
All (end of the Period 1, Period 15, Period 30 and Period 41) ... VI-9 Figure 6-8 Dumping progressions in d200 scenario according to the: a. N to All, b. S to
All (end of the Period 1, Period 15, Period 30 and Period 41) ... VI-10 Figure 6-9 Overall haulage distance in each scenarios and dumping directions ... VI-12 Figure 6-10 Truck hours ... VI-14 Figure 6-11 Truck productivity per haulage distance, t/km ... VI-15
xviii
List of Tables
Table 2.1. Production and export of major mining products (NSO, 2016). ... I-4 Table 2.2. Geological exploration, reserve categories and results in Northwest section of Erdenetyn-Ovoo deposit (FS of Erdenet mine, 2017). ... II-29 Table 3.1. Lithology Domains, Code, Rock types ... III-8 Table 3.2. Rock type domain ... III-11 Table 3.3. Description of major faults... III-13 Table 3.4. Rock mass characteristic of weathering zones ... III-14 Table 3.5. Orientation of pit slopes ... III-14 Table 3.6. Kinematic analyses results of appropriate overall pit slope angle for each rock type zones ... III-17 Table 3.7. Metal recovery percentage used for Lerch-Grossman calculation ... III-19 Table 3.8. Economic parameters belonging to the main calculation of Lerch-Grossman ... III-21 Table 3.9. Optimization results of the Lerch-Grossman analyses... III-23 Table 3.10. Cash flow analysis related to the specific case ... III-26 Table 3.11. Historical Cu price in last 40 years (www.infomine.com/) ... III-32 Table 3.12. Prospective pit shells ... III-33 Table 4.1. Parameters for shovel-truck-bulldozer dumping operation... IV-3 Table 4.2. Analysis results of waste particle size distribution for the shovel-truck- bulldozer and dragline dumping areas ... IV-3 Table 4.3. Relationship between dips of floor and bench shape ... IV-9 Table 4.4. Relationship between the amount of grading work and pile numbers .. IV-15 Table 4.5. Input data in regards to material properties of the model ... IV-16 Table 5.1. Input data in regards to material properties of the model. ... V-6 Table 5.2. Result of bench stability simulation for pit wall and wasted dump without buffer zone. ... V-10
xix
Table 5.3. Result of bench stability simulation for pit wall and wasted dump under different length of buffer zone condition. ... V-13 Table 5.4. Constant k and b of SRF equation under without buffer zone condition. ...
... V-14 Table 5.5. Constant k and b SRF equation for case of 100 m buffer length. ... V-16 Table 5.6. Constant k and b SRF equation for case of 200 m buffer length. ... V-16 Table 5.7. Predicted SRF for case of 100 m buffer length. ... V-18 Table 5.8. Result of simulation for case of changing pit wall angle. ... V-20 Table 5.9. Result of simulation for case of weakening friction angle to 0.75%. ... V-21 Table 5.10. Result of simulation for case of strengthening friction angle to 1.25x. V-22 Table 5.11. Result of simulation for case of weakening cohesion to 0.75x. ... V-22 Table 5.12. Result of simulation for case of strengthening cohesion to 1.25x. ... V-23 Table 6.1. Summary of the dump design scenarios... VI-3 Table 6.2. Summary of the route and truck ... VI-6 Table 6.3. Summary of haulage distance ... VI-11 Table 6.4. Estimated truck hours and total number of trucks ... VI-13 Table 6.5. Truck productivity ... VI-14 Table 6.6. Summary of discounted cash flow analysis in waste dumping ... VI-16
-Chapter II- I-1
INTRODUCTION 1.1. Mining industry of Mongolia
Mongolia is a Central Asian country neighboring with the Russian Federation and the People’s Republic of China. The country has a total territory of 1,565,600 km2. The country shares 4,673 km border with China on its east, west and south, and 3,485 km border with Russia in the north. The population of Mongolia is about 3 million people, one of the countries with the lowest population density in the world. Almost half of the population lives in Ulaanbaatar, the capital of Mongolia. Other major cities include Darkhan, an industrial center near the Russian border in the north, and Erdenet, known with its large copper plant, also in the north. Some 40% of the population lives in the countryside, primarily subsisting as nomadic livestock herders, while the rest lives in the cities or small settlements spread throughout the country.
Figure 1-1 Geographical location of Mongolia
The latitude of Mongolia, between 42 and 52 degrees north, is roughly the same as that of Central Europe or the northern United States and southern Canada. However, because the country is landlocked and has a relatively high median altitude, the climate
-Chapter II- I-2
is characterized as extreme continental with large temperature fluctuations and low precipitation. Total annual rainfall in Ulaanbaatar averages 220 mm. Much of the precipitation falls during the short summer, while winter is generally dry and extremely cold. The average summer temperature is about 25°C, while winter temperature is average at -25°C (MRPAM 2009).
The mining sector in Mongolia is one of the largest financial contributors to the economy. The primary outputs of the industry are copper and gold, along with iron ore, molybdenum and fluorspar. Mongolia is also estimated to have potential reserves of 125 billion metric tons of coal reserves, and the current coal production is over 20 million metric tons per year, mostly exported to China. Mining sector accounts for approximately 20% of gross domestic product (GDP), approximately 65% to the industrial output and more than 85% of exports. Between 1996 and 2006, the share of GDP produced by the industrial sector, including mining, went up from 20.6% to 40.3%. Since the 1970s the Erdenet mine and concentration, a joint Mongolian-Russian venture, has been the major source of Mongolian export income accounting for more than 10% of GDP.
The Mongolian government has promoted a range of policies to attract foreign investment in the minerals sector, especially since the late 1990s, which resulted in a significant expansion of mineral exploration and mining. The giant Oyu Tolgoi copper and gold deposit was discovered in the Mongolian Gobi in the early 2000s, offering the country a window of opportunity to attract investors and developers. The Oyu Tolgoi project is three to four times bigger than Erdenet and expected to account for more than one third of GDP by 2020.
As of 2012, the total 3,208 explorations and mining licences are owned by approximately 1,000 mining companies. However, only about 30 of them have a total annual revenue more than USD 4 million. The number of people working in the formal mining sector has increased three times since 2001, and currently, there are 48,000 Mongolian and foreign employees.
-Chapter II- I-3
Figure 1-2 Share of mining sector in country’s GDP, Industrial and Export Product (Mongolian Statistical Information Center, www.1212.mn, 2016) Mongolian economy is heavily dependent on the mineral exports. The share of mineral exports is 88% out of total exports that amounts to almost one-third of the government revenues and contributes 20% to the country’s GDP.
The exchange rate volatility is highly affected by the world’s copper and gold price movement. When copper price reached USD 10,000 per ton and copper price USD 300 in 2011, Mongolian economic growth reached 17.3 percent a year, and was considered the fastest growing economy in the world. However, the economy plummeted in 2015 at 2.3 percent, following the drop in minerals price and it is estimated that the economic growth will be around 0.3% at the end of 2016. (MRPAM 2016).
-Chapter II- I-4
Figure 1-3 Location map of major mineral deposits in Mongolia (MRAM 2016) In 1924, coal mining was the sole mining industry in Mongolia, which is the main supplier to electric power plants of Ulaanbaatar-4. In the 1961 a major iron ore metallurgical plant was established in Darkhan province and in 1978, a copper and molybdenum processing factory was established in Erdenet province. In the late 1980s, several coal mining sites were founded to supply the Power Plants of Ulaanbaatar.
Meantime, limestone factories started their processing activities, becoming a major cement production center. Along with this, gold mining has been growing steady (Batchuluun and Lin, 2010).
Prior to 1992 and the shift to a market economy, the mining industry was dominated by state owned, Mongolian-Soviet joint ventures with Russia, Bulgaria, Czechoslovakia, East Germany and Hungary. These ventures focused mostly on coal, fluorspar, gold, tin, copper, and molybdenum. Since 1992, the number of local Mongolian companies, joint companies with Canadian, British, Australian, Russian, and Chinese companies involved in exploration and mining has increased (The World Bank, 2006). At the end of 2015, about 23 major mines were in operation. Apart from the major mines, about 423 small scale mines operating as partnerships were active. (MPRAM 2017)
Table 1.1. Production and export of major mining products (NSO, 2016).
-Chapter II- I-5
Commodity unit Year Production Export
volume volume
Copper concentrate thous.t
2012 517.9 574.3
2013 803.0 679.8
2014 1,080.4 1,378.1
2015 1,334.7 1,477.8
Molybdenum
concentrate thous.t
2012 4.0 4.3
2013 3.7 4.0
2014 4.0 4.0
2015 5.2 5.0
Coal (thermal and
cocking) thous.t
2012 28,561.0 20,915.5
2013 29,163.6 18,373.1
2014 24,927.1 19,499.0
2015 24,148.9 14,472.7
Iron ore and
concentrate thous.t
2012 12,112.1 6,415.9
2013 11,135.9 6,724.5
2014 10,260.5 6,324.4
2015 6,173.4 5,065.1
Gold kg
2012 5,995.0 2.8
2013 8,904.4 7.6
2014 11,503.8 10
2015 14,556.2 11.3
Zinc ore and
concentrate thous.t
2012 119.1 140.9
2013 104.1 130.9
2014 93.2 99.4
2015 89.6 84.1
1.2. Problem descriptions of large-scale open pit mines in Mongolia
The projects of mineral resources operating by open pit mining method in Mongolia since 1960s. A relative deeper and large scale open pit mines developed in last 10 years and which are mainly operated in copper ore and hard coal mines. The depth of open pit mines was mainly less than 150m before 2000’s. However, the depth and scale of open pit mines has been increasing with the mining capacity, mineral products and high economic growth in major projects. For example, Oyutolgoi open pit copper mine with depth of 400m (in further 760m), Erdenet open pit copper-molybdenum mine with depth of 495m (in further 700m) and Narynsukhait and Tavantolgoi hard-coal mines with depth of 150m-250m (in further 350m-400m) in mining operation currently.
-Chapter II- I-6
The most of deposits were explored and the feasibility studies were developed before 1990s. The main problems occurred in large-scale open pit mines in Mongolia which established before the 1990s, are optimization of open pit mine design, locations of waste dump and other surface structures due to feasibility studies and other studies developed at different politics and economic situations, the estimations of price increases of mineral products and future growth of resources are not proper to current economic and technical conditions. Furthermore, geotechnical and other base investigations and data are insufficient in many deposits it is the main problems for mining planning such as open pit optimizing, slope stability studies and appropriate large waste dump design etc. at most large scale open pit mines.
In order to develop an appropriate open pit mine and waste dump design, these investigations have been conducted. In addition, the geotechnical and economic data has to be collected and optimizing to stable and economical design of open pit and waste dumping area are urgent issues for further large-scale open pit mine development were discussed.
1.3. General background
Mining is the extraction of valuable minerals or other geological materials from the earth from an orebody, vein, seam, or reef, which forms the mineralized package of economic interest to the miner. Mineral deposits are generally extracted from the either by underground or surface mining methods with the objective of extracting the ore at a profit.
Open pit mining is one of the most important methods of surface mining in which any waste material or overburden is stripped and transported to a waste dump prior to, and sometimes during, mining in order to uncover, and gain access to the mineral deposit.
In general, mining proceeds from the top to the bottom of the orebody. Both stripping and mining are carried out in a series of horizontal layers, usually of uniform thickness, called benches. The choice between an underground mining and a surface mining method depends on the depth, grade and tonnage of the orebody and consequently on technical and economic criteria. Surface mining methods in the form of quarries or open
-Chapter II- I-7
pits are extensively used throughout the world to extract ore at or near the surface.
Mineral deposits at depth may be extracted by underground mining methods but in general, significantly higher grades are required for profitability as the depth increases.
The development and extraction of ore by open pit mining is a complex operation that may extend over several decades and require very large investments. Before extraction, it is necessary to determine the size and final shape of the pit and the waste dump at the end of its life. This final shape, or ultimate pit limit and the final dump shape represents the volume beyond which further extraction of ore and waste and dumping using current or assumed economic and technical parameters, is uneconomic.
The ultimate pit limit determines minable reserves and the total amount of waste to be removed. It is also used to determine locations for the waste dump, and surface infrastructure (such as, processing plants and access roads) and to develop a production program. Determination of the ultimate pit limit is one of the most important design considerations in open pit mining and it may be recalculated many times during the life of the mine as production prices, costs, technical considerations and geology change.
There are a number of factors which affect the size and shape of the ultimate pit. These include, geology, grade, topography, production rate, bench height, pit slopes, mining and processing costs, metal recovery, marketing and cut-off grade. Some of these factors are discussed below:
Cut-off grade. The open pit mining method is usually used for low-grade deposits in which the ore is not contained within well-defined geological boundaries. In such deposits ore and waste are defined by a cut-off grade as opposed to a geological boundary. This cut-off grade is a very important factor in mine planning as it determines the overall ore reserve and the physical location of ore as well as the amount of waste to, be removed. It is a complex function of many variables such as grade, price, pit slopes, size of mining (selection) equipment, and mining and processing costs. As the cut-off grade increases, the tonnage of ore above the cut-off decreases and its average grade increases. Up to a certain point the quantity of metal contained in the ore above the cut-off grade (product of tonnage and average grade) will remain constant. Beyond
-Chapter II- I-8
this point (and certainly for cut-off grades at or above the mean grade of the orebody) the quantity of contained metal, and hence the profit, will decline.
There are several commonly used cut-off grades. The break-even cut-off grade is one of the simplest and most widely used. This is the grade at which the, recoverable revenue is exactly equal to the cost of mining, processing and marketing. Cut-off grades may be classified as either planning or operating cut-off grades depending on the time scales to which they refer. Planning cut-off grades are usually used to define geological or minable reserves before the start of operations or for long periods of time. Operating cut-off grades are usually used during the operation to make short-term to medium-term decisions, e.g. to mine or not, to stockpile or process.
Stripping ratios. The stripping ratio is another important factor in open pit mining as it has a major bearing on profitability, scheduling and pit design. The stripping ratio is ratio of the amount of waste that must be removed in order to mine a unit quantity of ore and is usually expressed as:
𝑆𝑅 =𝑊𝑎𝑠𝑡𝑒 (𝑎𝑚𝑜𝑢𝑛𝑡) 𝑂𝑟𝑒 (𝑎𝑚𝑜𝑢𝑛𝑡)
The break-even stripping ratio (BESR) is calculated from the following equation:
𝐵𝐸𝑆𝑅 =𝑅 − 𝐶 𝑊
where:
R is the revenue per tons of ore
C is the production cost of per tons of ore W is the stripping cost per tons of waste
Bench geometry. In open pit mining, the extraction of ore and the stripping of waste material are done in a series of layers called benches. Each bench has an upper and lower horizontal level separated by a distance equal to the bench height. The exposed subvertical surfaces are called the bench faces. The bench faces described by the toe,
-Chapter II- I-9
the crest and the face angle. The bench height depends on the types of extract materials, the manner in which it is dispersed in the host rock, the size and type of equipment used to extract, the blasting method, the production rate and the geotechnical characteristics of the rock. The height is usually set as high as possible with regard to the size and type of equipment selected for the operation.
Figure 1-4 Open pit slope geometry parameters
Pit slopes. The pit slope is a major factor affecting the size and shape of an open pit.
Stability is an over-riding consideration as pit walls must remain stable during the life of the mine. The steeper the final slope can be designed the smaller the amount of waste that has to be removed. However, as slopes become steeper the probability of failure increases. An optimum mine plan should, therefore, have the steepest final pit limit commensurate with stability throughout the period of mining activity.
Pit slope angle, ultimate pit slope or overall slope angle which is the angle between the horizontal and the line connecting the toe of the lowest bench to the crest of the uppermost bench. This slope makes no allowance for safety berms and haul roads.
-Chapter II- I-10
Average pit slope angle or average ultimate pit slope which is the angle between the horizontal and the line connecting the toe of the lowest bench to the crest of the uppermost bench allowing for the haul road or access ramp and safety berms. Working pit slope angle which is the slope of the pit wall during the mining operation. This is usually smaller than the ultimate pit slope angle so as to ensure stability and provide a wider space for operation. The working pit slope increases during the mining operation until it reaches the pit slope angle at the end of mining.
In general, the overall slope is designed to be as steep as possible in order to reduce the stripping ratio. Pit slope angles may vary through the orebody and may vary with direction due to changes in geological structure and stability requirements. They may also vary with elevation. Any realistic method of pit design, pit slopes may vary though a deposit due to changes in lithology and geological structure take into account variable slope angles. The determination of pit slopes is essential and must be done before planning the pit limit. These are determined mainly by slope stability methods from geotechnical information gathered during the site investigation.
Dumping management. The largescale open pit mines move thousands of tons of material daily from the loading sources to the destination zones, whether these are massive mine dumps or, to a lesser extent, to the grinding mills. Mine dumps can be classified as leach or waste dumps, depending upon their economic viability to be processed in-place, a condition that has experienced great progress in the last decades and has reconfigured the open pit haulage network with an increase in the number of dumps.
In designing the dump, there are many ways to assign values and combine the different geometric and size parameters while respecting the safety, economic and environmental constraints. The total tonnage capacity required can have as many geometrical representations as its limitations allow. In this situation, building a mathematical optimization model is the best option to interrelate certain key variables and the first approach to calculating the values that seek to maximize the satisfaction of a linear programming objective. As most of the dumps are emplaced on irregular topographies,
-Chapter II- I-11
a second approach has to contrast the values got by the generalized model and correct them, if necessary, by a series of successive iterations and projections to the field.
The truck-shovel mining operation generally constitutes approximately 50% to 60% of the total open pit mining cost (Nel, et al., 2011). The typical truck-shovel operation encompasses a loading unit which extracts/handles material, and a haulage unit for material transport. The truck-shovel mining method is popular due to increased flexibility and is capable of consistent high productivity in surface mining operations.
The continual improvements and technological development of truck-shovel operations has resulted in increased utilization of this extraction method within the mining industry. The main benefit of running a truck-shovel operation is the improved flexibility of the mining system, resulting in better suitability and selective mining of complex ore deposits, varying ore depths, varying overburden thicknesses and is not restricted to ore deposit size. An additional benefit is that the initial capital investment required to employ a truck-shovel operation can be lower compared to other methods depending on operational scale, however truck-shovel includes higher operating costs per bank cubic m (Mitra and Saydam, 2012).
The transport and dumping of waste material is a substantial cost component of truck- shovel operations. Therefore a significant amount of research has been conducted regarding the optimization of waste dump design standards and implementation aspects.
However, the time constraints associated with the rapid expansion of open pit mining operations does not allow for target waste dump design optimization at specific locations. Hence a risk factor or compromise is generally associated with the development and costs of waste dump implementation. The ideal mining operation consists of optimal fleet productivity, utilization and availability, along with the lowest attainable mining cost.
Unfortunately, systematic studies on interration between appropirate design, optimization of open pit and waste dumping were limited especially in large scale and long lifetime mining projects in Mongolia. The code for design of open pit and dumping of mining industry in Mongolia mentioned only about how to select dumping area, how to set up the parameters of dumping operation, and for stability of dumping area.
-Chapter II- I-12
However, open pit coal mines do not pay enough attention to development and planning for dumping area. For example, in Erdenet Cu-Mo open pit mining, the development of waste dumping were dumped on the further’s pit boundary and then, last 5 years re- located over 15 M.m3 of waste with 40 M.$ of costs and this is not only example in Mongolian minings. Therefore, the systematic research on the optimization of large scale open pit mining and appropriate design of waste dumping is valuable and urgent.
1.4. Literature review
The procedure, open pit mine designing and planning that can be started just after ultimate pit determination and cut-off grade calculation which both of them directly depend on final product price of the mine. The ultimate limits of an open pit define its size and shape at the end of the mine's life. In addition to defining total minable reserves and determining total profitability, these limits are needed to locate the waste dump, processing plant and other facilities. They are also required for the design of overall production schedules within the planned pit shape. There are numbers of algorithms have been developed to determine the optimal pit shape/boundary all with a common objective: to maximize the overall mining profit within the designed pit limit. This chapter presents a literature review and survey of the previous work including an assessment of the methods for optimal pit design together with the methods of slope design used in open pit mining.
Optimization is a scientific approach to decision making through the application of mathematical methods and the use of modern computing technology. It concerns the maximization or minimization of an objective function, e.g. maximization of profit or minimization of cost, subject to a set of constraints being imposed by the nature of the problem under study (Francisco, 2010).
The objective of optimal open pit design methods/algorithms is to determine the ultimate pit shape/boundary for an ore body together with the associated grade and tonnage that optimize some specified economic and/or technical criteria whilst satisfying practical operational constraints. The most common criteria used in optimization are: maximum net profit, maximum net present value, maximum
-Chapter II- I-13
metal/mineral content and optimal mine life. Many attempts have been made to devise a general theory of cut-off grades within the context of which an optimal sequence of cut-off grades can be defined and, in practice, determined, for the life of a mine. The most advanced approach is that of Lane (1964 and 1988) which is based on the assumption that there are three stages in the mining operation comprising mining, concentrating or processing, and refinery and/or marketing. Each stage has its own associated costs and a certain capacity. (Khalokakaie, 1999) The effective optimum cut- off grade is, the middle value of the three optimum cut-off grades. Lane's method is regarded as a landmark in the determination of optimum cut-off grades. His method, however, relies on the assumption that prices, costs and recovery remain constant throughout the operation. Dowd (1973), Dowd and Xu (1995) and Whittle and Wharton (1995) have coded Lane's method into a computer program.
Optimizers generate optimal solutions assuming that the data given as input is correct, which is not the case in mining due to the uncertainty around the economic value of a block. Conventional approaches to the optimal design of open pit mines, do not incorporate uncertainty into the process because they make use of a single estimated orebody model generated through kriging (Goovaerts, 1997) as input to the optimization model. Past efforts in the area of conventional approaches are Johnson (1968), Dagadalen and Johnson (1986) and Hochbaum (2001). Dimitrakopoulos (1998) highlights that due to the smoothing effect present in any estimated type orebody model, as in the case of a kriged model, the histogram and variogram show lower variability than the actual data which leads to not meeting production targets and NPV forecasts.
Dimitrakopoulos et al. (2002) discuss the effect of estimated orebody models on non- linear transfer functions used to schedule production throughout the whole life of mine and the risk that arises from not accounting for geological uncertainty.
The Lerch and Grossman algorithm. Lerch and Grossmann (1965) introduced an efficient algorithm to find the optimal pit limits algorithm, which is based on three- dimensional graph theory, is the most commonly used optimization algorithm which takes into account the influence of a grade block model, operating costs, product prices, slope geometry, etc. Then, within this framework scheduling is carried out by breaking the pit space into pushbacks. Pushbacks are represented by a set of connected blocks
-Chapter II- I-14
that facilitate the mining operation in terms of safety slope requirements, minimum working width required by mining equipment and maximization of the NPV of the project through the adequate management of stripping ratios.
Since then many algorithms have been developed for determining optimal pit outlines.
Some authors, namely, Kim (1978), Dowd and Onur (1993), Gill, Robey and Caelli (1996) have provided surveys and comparative studies of these methods. Kim classified the various methods of optimal design as "rigorous" and "heuristic" techniques. He used the word "rigorous" for the methods that have mathematical proofs such as graph theory and dynamic programming (Khalokakaie, 1999).
The Lerch-Grossman algorithm, it is also used in mining optimization software as the industry standard, for example in Gemcom’s Whittle software, to find the optimal pit and pushbacks. The algorithm uses different revenue factors to generate a value-based mining sequence strategy to design pit shells. Early pit shells are constructed using high-grade blocks and a low stripping ratio.
The results also consider practical considerations such as haul road access, cut-off grades and processing, etc. To maximize the use of block modelling functions and optimize the pit design process, block modelling and slope stability analysis have to be fully integrated. This is a logical extension to assign mines rock types and grades to every block. This process will be further optimized by defining every block location especially those blocks with high value of NPV. The Lerch and Grossmann algorithm is based on two theorems:
1. The maximum closure of a normalized tree is the set of that tree's strong vertices 2. A normalized tree can be found such that the set of strong vertices in this tree constitutes a closure of the graph so the set of strong vertices is the maximum closure of the graph with the highest NPV.
This method converts the revenue block model of the deposit into a directed graph which is a simple diagram consisting of a set of small circles, called nodes or vertices, and a set of connecting arcs (lines with direction) used to indicate the relationship between the vertices. A vertex represents each block. Each vertex is assigned a mass
-Chapter II- I-15
that is equal to the net value of the corresponding block. Vertices are connected by arcs in such way as to represent the mining constraints. These arcs indicate which blocks should be removed before a particular block can be mined.
Figure 1-5 Directed graph Lerch-Grossman
Computer based methods. A 3D program called GEOVIA Whittle™, introduced by Whittle (1985), was a computer based implementation of the Lerch and Grossmann method which used a block model, whose blocks have economic values representing the net cash flow that result from mining the block in isolation. However, the resulting optimal pit did not use discounted cash flows.
The Floating Cone method, which is the simplest and fastest technique to determine optimum ultimate pit limits to which variable slope angle can be easily applied, repeatedly searches for and checks the total value of block groups forming inverted cones. Total cones are identified for mining if their total value was positive. This procedure is iterated until no more positive cones are recognised. However, this method cannot guarantee the final pit is optimum. Other block groups (as mentioned above) also implemented a two and-a-half dimensional Lerch and Grossmann algorithm (Dimitrakopoulos et al., 2002; Osanloo et al., 2008a; Asad and Dimitrakopoulos, 2013).
-Chapter II- I-16
The 4D (and subsequently Four-X) programs also use the same Lerch and Grossmann technique to generate a set of nested optimal pits. Each pit that is optimal is used to guide different mining schedules. Financial analysis of these programs which consider discounted cash flows allows selection and sensitivity analysis of the best pit (Dowd, 1994; NPV – Scheduler, 2001; Osanloo et al., 2008a; Askari-Nasab et al., 2011) Dump design methodology. Three major destination groups, characterized by a cut-off grade criteria and ore type, represent the places in the mine where the material receives specific treatment after its delivery from the pit: leach dumps, waste dumps and mill (Hustrulid, Kuchta, & Martin, 2013). Dump leaching facilities are built to receive and treat low-grade ore by the use of solution agents, while waste rock dumps store uneconomic material. Dump leaching technologies have developed over the last decades, allowing the mining industry to build larger and higher dumps faster than ever (Smith, 2002), since they have proven to be an efficient method of treating oxide and sulfide ores, an attractive way to treat large low-grade deposits (Dorey, Van Zyl, &
Kiel, 1988). As a result, an increase in the number of dumps, which are the most visual landforms left after mining (Hekmat, Osanloo, & Shirazi, 2008) has reconfigured the open pit mines network organization and landscape.
1.5. The objective of research project
A relative deeper open pit mines developed in last 10 years in Mongolia. However, geotechnical investigations, data and practical experience are insufficient in many activity deeper open pit mining and this is main cause of geotechnical, planning, operating and economic problems occurred at some open pit mines. A case point is the Erdenet Cu-Mo open pit mine in northern Mongolia, which currently faces the design of overall slope angles for current pit depth around 300 meters and to final mining depth around another 300 meters. The design problem and the lack knowlegde regarding the behavior of relative deeper pit design for optimzation of open pit and dumping area was the starting point for this work.
The objective of the work presented in this thesis was attempt to develop an innovative method to optimization of appropriate design of open pit and dumping using
-Chapter II- I-17
geotechnical, geochemical and economic data and its at one of major mining project, Erdenet Cu-Mo porphyry deposit.
1.6. Study approach
The steps of studies to approach the solution for the objective of study were commenced from the difficulties of planning, stability, operational and economics of large scale open pit mine and development of waste rock dumping site to understand their optimization relations. Subsequently, the optimization and determining ultimate pit limit and further prospects pit limits in large scale open pit mine and their roles in development and planning of waste dumping were conducted, following by the engineering application of the findings. Technically, the study was conducted by performing data processing i.e. geological, geotechnical, economical and mining operational, and by numerical analyzing of the data at obtained from the field.
1.7. Organization of the thesis
This dissertation consists of 7 (seven) chapters in which the contents are described as follow:
Chapter 1 explains the information about the country and mining sector in Mongolia, problem descriptions of large scale open pit mines and the general background of studies including the processes of optimization procedures of open pit mine and dumping, problem description and literature review and survey of previous studies, objective and outline of dissertation are proposed.
Chapter 2 discusses the information about the country and mining sector in Mongolia, general description of literature review and survey of previous research, objective and outline of dissertation are proposed.
Chapter 3 discusses the optimization procedures for dynamic open pit boundary shells based at case investigation of Erdenet mining and numerical simulation by Surpac,
-Chapter II- I-18
Whittle, Slide and Dips software using engineering, geotechnical properties and economic data.
Chapter 4 discusses the formation mechanism of benches on dumping area. It consists of a field investigation at Erdenet open pit mine, experiment methods and results, and simulation for the effect of dumping operation on stability of dumping area
Chapter 5 discusses the optimization and consideration of buffer zone distance between the large scale open pit and dumping area consists of failure effects and stability consideration.
Chapter 6 presents a methodology to model and optimize the design of a mine dump by minimizing the total haulage costs. The methodology consists on optimization of a dump model based on the multiple relevant parameters and solves by minimizing the total cost using programming and determines a preliminary dumping design.
Chapter 7 concludes the results of this study, including the recommendations for dumping management in largescale open pit mining optimization and planning.
References
Batbold, B., (2012). Impacts of mining activities in Mongolia on the soil and water environments. (Doctoral thesis). Yonsei University.
Batchuluun, A., and Lin, J. Y., (2010) A step forward in the economic growth of the country: Analysis of mining sector development. Global Conference on Business and Finance Proceedings, 5(1), 168-179.
Batchuluun, A., and Lin, J. Y., (2010) An analysis of mining sector economics in Mongolia. Global Journal of Business Research, 4(4), 81-93.
Dimitrakopoulos, R., Farrelly, C.T., Godoy, M., (2002). Moving forward from traditional optimization: grade uncertainty and risk effects in open-pit design.
Mining Technology 111 (A), 82–8.
Dimitrakopoulos, R., Martinez, L., Ramazan, S., (2007). A maximum upside/minimum downside approach to the traditional optimization of open pit mine design. Journal of Mining Science 43, 73–82.
-Chapter II- I-19
Dirk, J. A., Van Zyl., Kiel, J. E., (1988). Introduction to evaluation, design and operation of precious metal heap leaching.
Dagdelen, K., Mohammed, W.A.A., (1997). Multi mineral cutoff grade optimization with option to stockpile. Proceedings of the SME Annual Meeting, Society for Mining, Metallurgy and Exploration Inc., Littleton, 1–12.
Dowd, P. A. (1976), Application of dynamic and stochastic programming to optimize cut-off grade and production rates. Transactions of the Institution of Mining and Metallurgy 85, (Section A, Min. industry), 85, A22-A31.
Dowd, P., (1994). Risk assessment in reserve estimation and open pit planning.
Transactions of the Institution of Mining and Metallurgy 103, A148–A154.
Dowd, P., Onur, A.H., (1992). Optimizing open pit design and scheduling. 23rd APCOM symposium, 411-422.
Dowd, P., Onur, A., (1993). Open pit optimisation: I. Optimal open pit design.
Transactions of the American Institute of Mining and Metallurgical Engineers, A94–104.
Goovaerts P, (1997), Geostatistics for Natural Resources Evaluation. Oxford Univ.
Press, New York, 512.
Hekmat, A., Osanloo, M., Shirazi, A., (2008), A new approach for selection of waste dump site in open pit mines, Journal of mining technology, 117(1).
Hekmat, A., Osanloo, M., Shirazi, A., (2007), Waste dump site selection in open pit mines using fuzzy MADM algorithm, 10th International Symposium on Environment in Energy and Mineral Production, SWEMP
Hochbaum, D.S., Chen, A., 2000. Performance analysis and best implementations of old and new algorithms for the open-pit mining problem. Operations Research 48, 894– 913.
Hustrulid, W., Kuchta, M., Martin, R. (2013) Open pit mine planning and design 3rd edition.
Independent Research Institute of Mongolia NGO., (2016) Corruption risk assessment in mining sector of Mongolia. (source: www.irim.mn )
Johnson, T. B. (1968), Optimum open-pit mine production scheduling. (Doctoral thesis). Operations Research Department, University of California
-Chapter II- I-20
Johnson, T. B. and Barnes, R. J. (1988), Application of the maximal flow algorithm to ultimate pit design. Engineering design: Better results through, operations research methods, (Amsterdam: North Holland Publ. Co.), 518-531
Khalokakaie, R. (1999). Computer aided optimal open pit design with variable slope angles. (Doctoral thesis). University of Leeds.
Khalokakaie, R., Dowd, P. A., & Fowell, R. J. (2000). Lerchs–Grossmann algorithm with variable slope angles. Mining Technology, 109 (2), 77-85.
Khalokakaie, R., Dowd, P. A., & Fowell, R. J. (2000). Incorporation of slope design into optimal pit design algorithms. Mining Technology,109 (2), 70-76.
Kim, Y. C., (1978). "Ultimate pit limit design methodologies using computer models the state of the art. Mining Engineering, (30), 1454-1459
Lane, K.F., (1964). Choosing the optimum cut-off grade. Quarterly of the Colorado School of Mines, Golden, USA, 811-829.
Lerch, H., Grossmann, I.F., (1965). Optimum design of open-pit mines. Canadian Institute of Mining and Metallurgy (58), 47–54.
Mineral Resources Authority of Mongolia (MRAM) (2009) Geologic information center. Brief information of Mongolian commodities. (www.mpram.gov.mn ) Mineral Resource and Petroleum Authority of Mongolia., (2016) The annual report-
2016: Geology, mining, petroleum, heavy industry. (www.mpram.gov.mn ) Mineral Resource and Petroleum Authority of Mongolia., (2017) The annual report-
2017: Geology, mining, petroleum, heavy industry. (www.mpram.gov.mn ) Mongolian Statistical Information Service., (2017) The annual economic statistic-
2017. (www.1212.mn )
Whittle Programming., (1998). Four-X, Reference Manual, Whittle Programming, Melbourne, 385.
Whittle, J., (1998). Beyond optimization in open pit design. Proceedings of the Canadian Conference on Computer Applications in the Mineral Industries, 331- 337.
Whittle, J., (1990). Surface Mining Society for Mining Metallurgy and Exploration, Open Pit Optimization, Colorado, 470– 475.
Whittle, J., (1999). A decade of open pit mine planning and optimisation - the craft of turning algorithms into packages. Proceedings of the 28th International