Introduction
The Japanese have experienced a dramatic secular increase in height since WW II, though they have traditionally been much shorter than their European counterparts(Matsumoto, 1982 ; Hatton, 2013 ; Baten and Blum, 2014 ; etc.). Cole and Mori(2017)analyzed “secular trend patterns in child height in Japan in comparison with South Korea” by the SITAR model. The crucial findings include that the growth period has advanced in timing and shrunk in duration and that most of the height increment seen in adults had already accrued by the earlier years of age, indicating that the secular trend may represent increased growth in the long bones during infancy(ibid., p.12).
One year-olds in 1975, for example, aged to two year-olds in 1976, 10 year-olds in 1984, and in turn 20 year-olds in 1994. In identifying growth patterns in height and weight, it is biologically more realistic and maybe preferable to follow
the same birth cohorts in growth over the pe-riod in question, i.e., one year-olds in 1975 through twenty years-olds in 1994, than com-paring different ages in the same period, say 1994, for the case mentioned above. Due to the lack of available data, child height by age every annual year, on the South Korean side, Cole and Mori failed to incorporate explicitly this co-hort aspects into their analysis.
In this working paper, the authors attempted to identify the presence of cohort effects*1in child stature growth in Japan in the post-war period, using annual data for school children provided by the Japanese government Ministry of Educa-tion. The data used in the previous analyses (Mori, 2016 ; Mori, 2017, Cole and Mori, 2017 ; etc.)were derived from the National Nutrition Surveys by the Japanese government Ministry of Health and Welfare, which cover each age from 1 to 25, and 26―29, 30―39, ‐‐‐, 70+ for older ages. With substantially smaller sample sizes than the Ministry of Education surveys, the National Nutrition Surveys exhibit greater
*1 Refer to Appendix A for the concrete image of co-hort effects in the case of human height.
* Professor Emeritus, Senshu University〈 the0033@isc. sensu-u.ac.jp 〉
** Formerly Economist, Economic Research Service, U.S. Department of Agriculture
《Working Note》
Secular Trends in Human Height : Application of
Cohort Analysis―The Case of Post-War Japan
Hiroshi Mori
*variances in mean height for each year of chil-dren in selected survey years. In contrast, the School Children Health Statistics Surveys by the Ministry of Education are huge in sample size, covering all schools of the entire nation every year. One of disadvantages of the school dren surveys is that they lack the data for chil-dren younger than the first graders in the pri-mary school, 6 years of age, and older than the senior high-school students, 17 years of age in Japan. On the other hand, the surveys furnish the data for school children in pre-war years back to 1900, except for a few years during WW II.
Basic Structures of Cohort Analysis for So-cial Sciences
The authors have long been engaged in de-mand analyses of food products. Individual con-sumption of any food, rice, meat, or fish, for ex-ample, varies not only by the economic circum-stances prevailing at the time of survey―period effect but also by the age of individuals―age effect. In countries, which have undergone rapid economic and social changes, like post-war Japan, individual consumption also proved to vary appreciably by the experiences the sub-jects were accustomed when the eating habits were formed―cohort effects(Schrimper, 1979 ; Mori eds., 2001 ; Mori et al., 2009 ; Mori and Saegusa, 2010 ; Mori, Inaba, and Dyck, 2016 ; etc.).
Children grow in height at different speed by age until they reach maturity, boys generally at 20 years and girls at 17―18 years and height change levels off until the age of late 50s or early 60s―age effect. While age-related growth proceeds, conditions such as, good nutrition or poor hygienic circumstances tend to affect the growth speed positively or negatively―period
effect. As widely conceived in human biology (Cole, 2003 ; Deaton, 2007 ; etc.), the early years of life are key determinants of adult height. Cole and Mori, based on the statistical observations of child height in Japan and South Korea during the post war era, state that “most of the height increment seen in adults had al-ready accrued by the age of 1.5 years”, as men-tioned earlier(2017, p.1). It should be most likely that the circumstances which prevailed when one comes out into life(a few months of pregnancy included)may be one of the key de-terminants of adult height―cohort effect. After the fashion common in additive cohort analysis ( Glenn, 1977 ; Mori and Saegusa, 2010 ; Young et al., 2008 ; etc.), one’s height at i years of age at period j is approximated in model(1)as below :
Yij=B+Ai+Pj+Ck+Eij…! Where :
Yij:mean height of individuals of i years of age at time j
B:grand mean effect
Ai:age effect attributable to i years of age Pj:period effect attributable to time j Ck:cohort effect attributable birth cohort k Eij:random error
To center the parameters, we set a re-parameterization(2)below :
ΣAi=ΣPj=ΣCk…"
Model(1)can be written in the conventional matrix form of a least-square regression :
Y=Xb+ε…#
ob-servations. The oldest cohort are those in the 17 years of age group in 1955 and the newest those in the 6 years of age group in 1990, 47 cohorts : 95 parameters to be estimated in total. As is common in the ordinary cohort analysis, whenever the period, j and age group, i are specified, the third parameter, k, is automati-cally determined : the “identification problem” inherent in additive cohort analysis (Mason and Fienberg, 1985). Rejecting arbitrary choice of equality constraints for identifying purposes in the conventional cohort analyses, such as age effect for 9 years = age effect for 10 years, or period effect for the year 1985 = period ef-fect for the year 1990, for example, we follow the Nakamura’s Bayesian cohort approach, based on his intuitively natural assumption, “gradual changes between successive parame-ters” for the entire sets of parameters, age, pe-riod and cohort effects, equation(4), subject to the ABIC minimization(for mathematical eluci-dation, refer to Akaike, 1980 ; Nakamura, 1986).
wi Σ(Ai−Ai+1)2+wj Σ(Pj−Pj+1)2+wk Σ(Ck−
Ck+1)2
→min! !
Data and Empirical Results
As mentioned earlier, the data for mean height of male and female children from 1955 to 1990 are derived from the Japanese government Ministry of Education School Children Health Statistics Surveys. The Surveys furnish the data for the older age groups than 17 years, high-school seniors, 18 through 21 years old until the year of 1971 but no later than that. In rec-ognition of the casual observation that even boys tend to slow down in height growth after they graduate from high-school, this limitation of mean height by age groups may not be of serious concern.
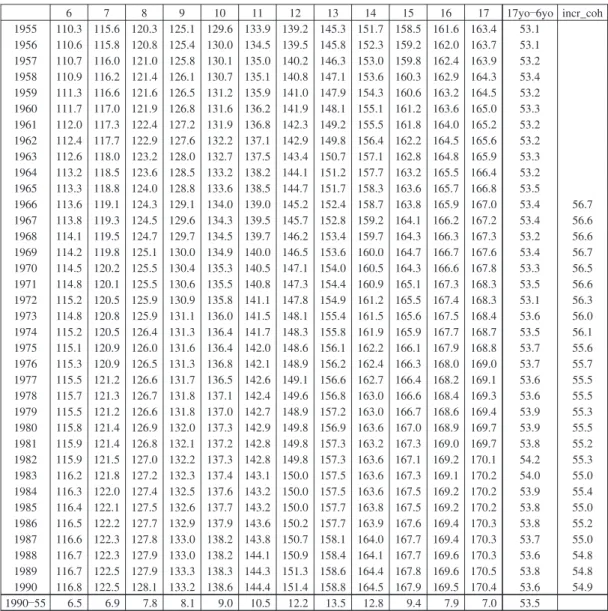
As expressed in model(1), it is stipulated that the period effect for any specific year should be the same in magnitude, regardless of age groups. If the economy flourishes in the year(s), j, resulting in abundant food supply, these cir-cumstances are taken to affect height growth of all ages equally in magnitude, which may be somewhat questionable by common sense*2. Model (1) is only an approximation, maybe poor, to the real social changes observed over a long period of time(Yang et al., 2008, p. 1733). Table 1 provides changes in mean height of male school children, from 6 years to 17 years of age for 36 years from 1955 to 1990, in the form of a standard cohort table(Table 2 pro-vides the height data for female school chil-dren). Glancing over Table 1 horizontally along the age axis, one can notice the differences(in mean height)between the selected age groups, 6 years and 17 years, the youngest and the old-est age groups, for example, as provided in the 2nd last column, which average 53.5 cm over the entire period from 1955 to 1990. When we select the last year, 1990, the difference is 53.6 cm, very close to the entire period average of 53.5 cm. In view of the biological fact that those in the age group of 6 years in 1979 moved to the age group of 17 years in 1990, these co-horts, on average(to be omitted hereafter), grew from 115.5 cm in 1979 to 170.4 cm in 1990 by 54.9 cm. Take another case of 1966. The cohort, who were 17 years old and 167.0 cm in 1966, were 6 years old and 110.3 cm in 1955, with a difference amounting to 56.7 cm over the period, 3.3 cm bigger than the differ-ence between the oldest and the youngest age groups in the same year of 1966, implying that
with the age given, the older cohorts should have been somewhat shorter than the newer cohorts, which should be partially reflected in the differences in cohort effects. The observed difference between any chosen age groups in different years may thus represent a compound of age, period and cohort effects with possible errors.
Table 3 provides the analytical results of stan-dard cohort table of changes of mean height of male students, 6 to 17 years of age from 1955 to 1990, as provided in Table 1, decomposed into age, period and cohort effects by Naka-mura’s Bayesian cohort model. Over the entire period under investigation, from 1955 to 1990, Japan’s economy kept growing very fast and Table 1 Changes in mean height of school booys=6―17 years of age, 1955 to 1990
6 7 8 9 10 11 12 13 14 15 16 17 17yo―6yo incr_coh 1955 110.3 115.6 120.3 125.1 129.6 133.9 139.2 145.3 151.7 158.5 161.6 163.4 53.1 1956 110.6 115.8 120.8 125.4 130.0 134.5 139.5 145.8 152.3 159.2 162.0 163.7 53.1 1957 110.7 116.0 121.0 125.8 130.1 135.0 140.2 146.3 153.0 159.8 162.4 163.9 53.2 1958 110.9 116.2 121.4 126.1 130.7 135.1 140.8 147.1 153.6 160.3 162.9 164.3 53.4 1959 111.3 116.6 121.6 126.5 131.2 135.9 141.0 147.9 154.3 160.6 163.2 164.5 53.2 1960 111.7 117.0 121.9 126.8 131.6 136.2 141.9 148.1 155.1 161.2 163.6 165.0 53.3 1961 112.0 117.3 122.4 127.2 131.9 136.8 142.3 149.2 155.5 161.8 164.0 165.2 53.2 1962 112.4 117.7 122.9 127.6 132.2 137.1 142.9 149.8 156.4 162.2 164.5 165.6 53.2 1963 112.6 118.0 123.2 128.0 132.7 137.5 143.4 150.7 157.1 162.8 164.8 165.9 53.3 1964 113.2 118.5 123.6 128.5 133.2 138.2 144.1 151.2 157.7 163.2 165.5 166.4 53.2 1965 113.3 118.8 124.0 128.8 133.6 138.5 144.7 151.7 158.3 163.6 165.7 166.8 53.5 1966 113.6 119.1 124.3 129.1 134.0 139.0 145.2 152.4 158.7 163.8 165.9 167.0 53.4 56.7 1967 113.8 119.3 124.5 129.6 134.3 139.5 145.7 152.8 159.2 164.1 166.2 167.2 53.4 56.6 1968 114.1 119.5 124.7 129.7 134.5 139.7 146.2 153.4 159.7 164.3 166.3 167.3 53.2 56.6 1969 114.2 119.8 125.1 130.0 134.9 140.0 146.5 153.6 160.0 164.7 166.7 167.6 53.4 56.7 1970 114.5 120.2 125.5 130.4 135.3 140.5 147.1 154.0 160.5 164.3 166.6 167.8 53.3 56.5 1971 114.8 120.1 125.5 130.6 135.5 140.8 147.3 154.4 160.9 165.1 167.3 168.3 53.5 56.6 1972 115.2 120.5 125.9 130.9 135.8 141.1 147.8 154.9 161.2 165.5 167.4 168.3 53.1 56.3 1973 114.8 120.8 125.9 131.1 136.0 141.5 148.1 155.4 161.5 165.6 167.5 168.4 53.6 56.0 1974 115.2 120.5 126.4 131.3 136.4 141.7 148.3 155.8 161.9 165.9 167.7 168.7 53.5 56.1 1975 115.1 120.9 126.0 131.6 136.4 142.0 148.6 156.1 162.2 166.1 167.9 168.8 53.7 55.6 1976 115.3 120.9 126.5 131.3 136.8 142.1 148.9 156.2 162.4 166.3 168.0 169.0 53.7 55.7 1977 115.5 121.2 126.6 131.7 136.5 142.6 149.1 156.6 162.7 166.4 168.2 169.1 53.6 55.5 1978 115.7 121.3 126.7 131.8 137.1 142.4 149.6 156.8 163.0 166.6 168.4 169.3 53.6 55.5 1979 115.5 121.2 126.6 131.8 137.0 142.7 148.9 157.2 163.0 166.7 168.6 169.4 53.9 55.3 1980 115.8 121.4 126.9 132.0 137.3 142.9 149.8 156.9 163.6 167.0 168.9 169.7 53.9 55.5 1981 115.9 121.4 126.8 132.1 137.2 142.8 149.8 157.3 163.2 167.3 169.0 169.7 53.8 55.2 1982 115.9 121.5 127.0 132.2 137.3 142.8 149.8 157.3 163.6 167.1 169.2 170.1 54.2 55.3 1983 116.2 121.8 127.2 132.3 137.4 143.1 150.0 157.5 163.6 167.3 169.1 170.2 54.0 55.0 1984 116.3 122.0 127.4 132.5 137.6 143.2 150.0 157.5 163.6 167.5 169.2 170.2 53.9 55.4 1985 116.4 122.1 127.5 132.6 137.7 143.2 150.0 157.7 163.8 167.5 169.2 170.2 53.8 55.0 1986 116.5 122.2 127.7 132.9 137.9 143.6 150.2 157.7 163.9 167.6 169.4 170.3 53.8 55.2 1987 116.6 122.3 127.8 133.0 138.2 143.8 150.7 158.1 164.0 167.7 169.4 170.3 53.7 55.0 1988 116.7 122.3 127.9 133.0 138.2 144.1 150.9 158.4 164.1 167.7 169.6 170.3 53.6 54.8 1989 116.7 122.5 127.9 133.3 138.3 144.3 151.3 158.6 164.4 167.8 169.6 170.5 53.8 54.8 1990 116.8 122.5 128.1 133.2 138.6 144.4 151.4 158.8 164.5 167.9 169.5 170.4 53.6 54.9 1990―55 6.5 6.9 7.8 8.1 9.0 10.5 12.2 13.5 12.8 9.4 7.9 7.0 53.5
steadily, furnishing favorable environmental cir-cumstances for stature growth of children, i.e., better nutrition and living conditions : posi-tively inclined period effects. For those readers who are not accustomed to cohort analyses, a brief paragraph will follow to elucidate how to interpret the results of the cohort decomposi-tion. Select randomly boys of 10 years old in
1960, for example. They belong to the cohort_ 12(Table 3). Based on model(1), we can pre-dict mean height of these subjects as below :
Y10_1960=B+A10+P1960+C12
=143.59−8.85−2.16−0.95=131.63 against observed value, 131.6(Table 1) Take another example of boys of 16 years old in 1985, the cohort_31.
Table 2 Changes in mean height of school girlls=6―17 years of age, 1955 to 1990
6 7 8 9 10 11 12 13 14 15 16 17 17yo―6yo incre_coh 1955 109.3 114.6 119.4 124.5 129.5 134.9 141.0 145.7 148.9 151.7 152.6 153.2 43.9 1956 109.6 114.7 119.9 124.7 130.1 135.8 141.6 146.1 149.3 151.9 152.7 153.2 43.6 1957 109.7 115.0 120.1 125.2 130.2 136.3 142.2 146.6 149.6 152.1 152.8 153.3 43.6 1958 109.9 115.2 120.4 125.5 131.0 136.6 142.8 147.1 149.9 152.3 153.1 153.5 43.6 1959 110.3 115.6 120.8 126.0 131.5 137.6 143.1 147.6 150.3 152.6 153.3 153.6 43.3 1960 110.6 115.9 121.1 126.3 132.0 138.1 144.0 148.1 150.7 152.7 153.3 153.7 43.1 1961 111.0 116.3 121.5 126.7 132.4 138.6 144.3 148.8 151.1 153.0 153.5 154.0 43.0 1962 111.4 116.6 121.8 127.1 132.6 138.9 144.9 149.0 151.6 153.3 153.7 154.0 42.6 1963 111.6 117.0 122.2 127.4 133.3 139.3 145.4 149.5 151.8 153.9 154.2 154.4 42.8 1964 112.2 117.6 122.7 128.0 133.5 140.0 146.1 149.9 152.3 153.9 154.4 154.7 42.5 1965 112.5 117.8 123.0 128.4 134.1 140.4 146.3 150.3 152.5 154.0 154.6 154.8 42.3 1966 112.7 118.1 123.4 128.8 134.6 141.0 146.8 150.7 152.8 154.3 154.7 155.0 42.3 45.7 1967 112.9 118.3 123.7 129.1 135.0 141.4 147.2 151.0 153.1 154.5 155.0 155.2 42.3 45.6 1968 113.1 118.6 123.9 129.3 135.3 141.7 147.6 151.4 153.4 154.7 155.1 155.3 42.2 45.6 1969 113.4 119.0 124.2 129.7 135.7 142.1 148.0 151.7 153.7 154.8 155.2 155.4 42.0 45.5 1970 113.6 119.3 124.6 130.1 136.2 142.9 148.4 152.1 154.2 155.1 155.4 155.6 42.0 45.3 1971 113.7 119.3 124.7 130.3 136.4 143.2 148.5 152.4 154.2 155.4 155.9 156.0 42.3 45.4 1972 114.3 119.7 125.2 130.6 136.8 143.2 149.0 152.6 154.5 155.3 155.6 155.8 41.5 44.8 1973 114.0 120.0 125.4 130.9 137.1 143.7 149.2 152.7 154.5 155.5 155.8 156.0 42.0 44.6 1974 114.5 119.8 125.8 131.1 137.4 143.9 149.5 153.0 154.7 155.6 156.1 156.2 41.7 44.6 1975 114.4 120.1 125.5 131.6 137.6 144.2 149.6 153.2 155.0 155.7 156.2 156.3 41.9 44.1 1976 114.6 120.2 125.8 131.2 138.0 144.4 149.9 153.3 155.1 155.9 156.3 156.5 41.9 44.0 1977 114.6 120.3 125.9 131.5 137.7 144.9 150.1 153.5 155.3 156.1 156.4 156.6 42.0 43.9 1978 114.6 120.4 125.8 131.6 138.2 144.4 150.4 153.8 155.5 156.1 156.5 156.6 42.0 43.7 1979 114.7 120.4 126.0 131.7 138.1 145.0 150.2 154.0 155.6 156.2 156.6 156.7 42.0 43.6 1980 114.9 120.6 126.2 131.9 138.3 144.9 150.6 154.0 156.0 156.6 156.9 157.0 42.1 43.6 1981 115.1 120.8 126.1 131.9 138.2 145.0 150.5 154.2 156.0 156.6 156.9 157.1 42.0 43.5 1982 115.2 120.8 126.3 132.0 138.3 145.0 150.6 154.2 156.0 156.6 157.3 157.3 42.1 43.6 1983 115.5 121.0 126.6 132.2 138.4 145.2 150.7 154.3 156.1 156.9 157.3 157.4 41.9 43.1 1984 115.6 121.2 126.8 132.4 138.7 145.4 150.8 154.4 156.2 156.8 157.4 157.6 42.0 43.6 1985 115.7 121.4 126.9 132.6 138.8 145.5 150.9 154.4 156.3 157.0 157.4 157.6 41.9 43.1 1986 115.8 121.5 127.1 132.8 138.9 145.6 151.0 154.4 156.3 157.1 157.5 157.7 41.9 43.3 1987 115.8 121.4 127.1 132.7 139.2 145.8 151.2 154.6 156.3 157.1 157.6 157.8 42.0 43.2 1988 115.9 121.6 127.2 132.9 139.3 145.9 151.2 154.6 156.3 157.0 157.5 157.8 41.9 43.2 1989 116.0 121.8 127.3 133.1 139.5 146.1 151.4 154.8 156.4 157.1 157.6 157.8 41.8 43.2 1990 116.0 121.8 127.4 133.1 139.5 146.3 151.5 154.7 156.4 157.2 157.6 157.9 41.9 43.2 1990―55 6.7 7.2 8.0 8.6 10.0 11.4 10.5 9.0 7.5 5.5 5.0 4.7 42.3
Y16_1985=B+A16+P1985+C31
=143.59+23.44+1.64+1.14=169.81 against observed value, 169.2(Table 1) We can also predict mean height of a chosen age in the later years after the period covered in the above analysis, say boy 17 years of age in 1995, within the framework of model(1) (Mori and Clason, 2004 ; etc.).
Y17_1995=B+A17+P1995+C?
17 years-olds in the year 1995 were born in 1978 and belong to the cohort_ 41. Judging from the trend in the last 10 years of the analy-sis, the period effect for the year 1995 should be close to that for 1990, 2.2, or maybe slightly less.
Then,
Y17_1995= 143.59 + 24.71 + 2.20 + 1.39 = 171.89 : 1.09 cm taller than 17 year-olds in 1995, 170.8 cm, as actually observed(School Health Statis-tics, 1995).
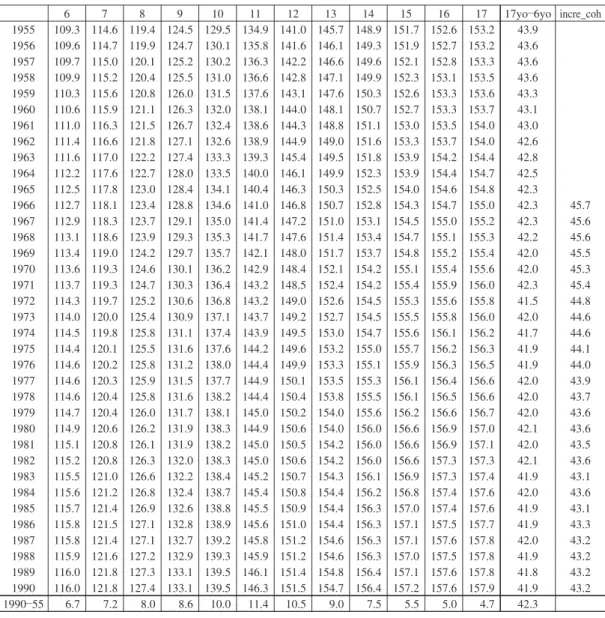
Table 4 provides the results of changes in mean height of female students, 6 to 16 years of age from 1955 to 1990, decomposed into age, period and cohort effects. The age of 17 years is omitted from the analysis in the considera-tion that girls tend to slow down in height growth earlier than boys.
Table 4 provides the results for school girls, age 6 to 16 years, 1955 to 1990, which are simi-lar in pattern to the results for boys, age 6 to 17 years(Table 3), i.e., regarding period ef-fects : the earlier years carry decreasingly negative sign from −3.1 cm in 1955―1957, turn-ing positive in the late 1960s and keep gradu-ally growing to 0.95 cm in the mid 1970s and then begin to slightly increase to 1.10 cm and keep staying for the last some 10 years ; re-garding cohort effects : the older cohorts are estimated to carry negative sign, gradually in-creasing from −2.0 cm to 0 in the middle,
co-hort_24 and then start increasing steadily to 1.9 cm toward the newer cohorts_40―45.
Discussion
Children in Japan increased in height conspicu-ously in the post-war era. Based on the Japa-nese government Ministry of Education School Children Health Statistics Surveys, the mean height of school boys and girls of 17 years of age in 1938―39*3 averaged 162.4 and 152.5 cm, respectively in the pre-war years. Ten years af-ter the end of WW II, when the economy had recovered to the pre-war level, as mentioned earlier, boys and girls of the same age are re-ported at 163.3 and 153.1 cm(1954―55 aver-ages), respectively. Children grew appreciably taller since then until the early 1990s or so(Ta-bles 1―2).
Analyzing secular growth patterns of child height in Japan and South Korea by SITAR in the past fifty years, Cole and Mori(2017)state that most of the height increment seen in adults had already accrued by age 1.5 years (p.1 and p.12). In this cohort analysis of child height growth in the post-war era in Japan, we do not have the data for 1 and 2 years, with the youngest at 6 and the oldest at 17 years. Cole’s assertion could be approximately rephrased that most of the height increment in adults had accrued by age 6 years. In the framework of co-hort analysis, most of the height increment seen in the oldest children, 17 years for boys and 16 years for girls is to be expressed in changes in cohort effects. As provided in the bottom line of Table 1 for boys, mean height of 17 years increased by 7.0 cm from 163.4 in 1955 to 170.4 cm in 1990, whereas that of 6 years increased by 6.5 cm from 110.3 to 116.8
cm over the corresponding period, i.e., it looks as if most of the height increment had accrued by age 6 years. If one compares the mean height of 10 years in 1955 and 1990, the incre-ment is measured at 10.5 cm and those aged 13 years increased by 13.5 cm over the same pe-riod. The pattern of height growth seems to vary by age and the year of observation. In the case of height growth of girls from 6 years to 17 years over the same period, from 1955 to 1990, 17 years increased by 4.7 cm from 153.2 to 157.9 cm, whereas 6 years increased by 6.7 cm from 109.3 to 116.0 cm over the same pe-riod, substantially greater than the case for 17 years.
Visually inspecting growth patterns of child height, as provided in Tables 1 and 2, caution needs to be paid to the biological fact that chil-dren, 6 to 17 years of age, in the same row were born in different years, having undergone different environmental circumstances from their prenatal period to their 6th birthday. 17 year-olds in 1966 were born in 1949 and reached 6 years in 1955, when the food supply was still scarce with per capita caloric intake of less than 2,000 kcal/day, whereas 7 year-olds in 1966 were born in 1959 and grew to 6 years in 1965, when food supply was much more plenti-ful with per capita caloric supply of 2.400 kcal/ day(Appendix Table 2 Japanese government Ministry of Agriculture, Food Balance Sheets). The environmental circumstances prevailing in one’s early years of life, 0 to 6 years in the il-lustration above, are expected to reflect in adult height some 15 years later, around 1980. Having observed rapid changes in food con-sumption over the half century in and after WW II, the authors are inclined to presume that food consumption, not only in terms of to-tal caloric intake but also intakes of proteins
and fresh produce, during ones’ adolescence should affect ones’ height growth. The height increment seen in adults, 17 years of age for boys and 16 years for girls in this analysis, should have been affected by the environmental circumstances prevailing not only in the early years of life but also in late adolescence, al-though possibly to a lesser extent. For exam-ples : boys’ mean height, 17 years in 1967 and 1983, at 167.2 and 170.2 cm, should reflect how tall they were 6 years of age in 1956 and 1972, i. e., 110.6 and 115.2 cm, respectively but also various environmental factors(Steckel, 1995), mainly quantity and quality of food consump-tion, which are characterized as period effects in the framework of additive cohort analysis. With the sum to zero constraints, equation(2), the younger ages have proved decreasingly negative, whereas the older ages increasingly positive in age effects, with the difference be-tween 6 and 17 years = 24.71−(−29.92)= 54.63, 1.13 cm larger than the average of actu-ally observed differences over the entire period under investigation( boys : bottom row, Table 1). With respect to period effects, the first 15 years from 1955 to 1969 have proved decreas-ingly negative, from −3.44 to −0.14 and fol-lowing 21 years very gradually increasing posi-tive from 0.03 for 1970 to 2.24 for 1990. On the other hand, the cohort effects proved equally important as the period effects, i.e., estimated effects for the oldest cohorts, cohort_0 to 8 av-erage at −3.60 cm, for the middle cohorts, C_ 21 to 25 at +0.63 cm and the newest, C_42―46 at 1.17 cm, with the difference between the newest and oldest cohorts amounting to 6.73 cm, very close to 7.0 cm, the difference of mean height of 17 years between 1955 and 1990(Column 13, Table 1).
differ-ence in estimated age effects between the old-est and the youngold-est=17.00−(−26.02)=43.02 cm, 0.7 cm larger than the average of actually observed difference over the entire period. With respect to period effects, the first 12 years from 1955 to 1966 have proved decreasingly negative, from −3.63 to −0.18 and the follow-ing 11 years increasfollow-ingly positive from 0.02 to 1.01, and then positive but leveling off to 1.10 in the last year, 1990. With respect to cohort ef-fects, the first 24 cohorts decreasingly negative from −2.0 to −0.05 and turned increasingly positive from 0.09 to 1.95 to the newest cohort, totaling to approximately 4.0 cm from the old-est to the newold-est, slightly smaller than 5.0 cm, the difference of mean height of 16 year-olds between 1955 and 1990( bottom row, Column 12, Table 2).
In either case of boys or girls, the estimated cohort effects seem to capture most of the in-crement of height seen in the oldest children. Either for boys or girls, the newest some 10 co-horts have proved almost unchanged in magni-tude. Japan’s economy kept growing strongly since the mid―1950s to the early 1990s, when the bubble burst, followed by nearly 2 decades of stagnation. Therefore, the period effects are not expected to turn upward after 1990. It may look predictable that children in Japan would not grow any taller in height after 1990 and ac-tually they have not.
Conclusions
It is widely accepted that the environmental cir-cumstances prevailing during the early years of life are key determinants of adult’s height. This premise is based on the tacit assumption that the circumstances should stay more or less the same until one ages to maturity in height. If na-tional food consumption, particularly by
chil-dren in their growing years, improves radically, or vice versa(as shown vividly in Appendix Ta-ble 2 Changes in per capita caloric supply from selected food groups, 1934―38 to 1999 in Ja-pan), increments in height would be greater or less, than otherwise. The changes in growth patterns of height can be measured more real-istically by following the same cohorts over the entire childhood, rather than comparing chil-dren of different age groups in the selective years. In this respect, the framework of additive cohort analysis, commonly used in sociology and food consumption, could be of some rele-vance, in collaboration with the conventional framework, such as SITAR, for example. Model (1) is only an approximation to changes in child height. Nevertheless, to repeat, it is a bio-logical fact that one year olds in 1956 aged to 10 years in 1965 and the 20 years in 1975. Envi-ronmental circumstances during these 20 years differ substantially between countries and co-horts under investigation. Findings of this pa-per may suggest that changes in environmental factors during one’s infancy to young adult need to be explicitly incorporated into analysis of changes seen in adult height over the period in question.
◆ ◆ ◆ ◆ ◆
Appendix A : cohort effects in the case of adults height :
Cohort refers to the years of birth for the sake of statistical clarity in common cases but cohort effects are determined not necessarily in the years of birth.
(kg/capita) Period/ age groups 10―14 15―19 20―24 25―29 1970 10.5 15.0 17.0 16.0 1975 8.5 12.5 16.0 18.0 1980 6.5 7.0 11.0 13.5 1985 ― ― ― ― 1990 ― ― ― ― years of life.
Ref. Table Changes in per capita consumption of a selected food product by age groups, 1970 to 1990
It is widely accepted in human biology that the environmental circumstances prevailing in the first years of life should be the key determi-nants of adult height. Due to the data availabil-ity, the youngest age groups to start with are 6 years-old in this analysis, implying that we are implicitly assuming that “the first years of life” should extend to 6 years of age from the first years.
References
Akaike, H.(1980) “Likelihood and the Bayes Proce-dure,” in Bayesian Statistics, eds. J. Benard, M. De-Groot, D. Lindley, and A. Smith, Valencia, Univer-sity Press, 143―166.
Baten, J. and M. Blum(2014)“Why are you tall while others are short? Agricultural production and other proximate determinants of global heights,”
Euro-pean Review of Economic History, 18, 144―65. Clason, Dennis(1999―2010). Professor, University
Sta-tistics Center, New Mexico State University, Las Cruces, NM.
Cole, D. J.(2003)“The secular trend in human physical growth : a biological view,” Economics and Human
Biology, 1, 161―168.
Cole, T. and H. Mori(2017)“Fifty years of child height and weight in Japan and South Korea : Contrasting secular patterns analyzed by SITAR, ” American
Journal of Human Biology, 1―13. <https : //doi.org/
10.1002/ajhb.23054>
Deaton, Angus(2007)“Height, Health, and Develop-ment,” PNAS , vol. 104, no. 33, 13232―13237. Glenn, Norval D.(1977)Cohort Analysis, Beverly Hills,
CA., Sage Publications.
Hatton, Timothy J.(2013)“How have Europeans grown so tall?” Oxford Economic Papers(Advance Access published September 1),Oxford University Press, 1 ―24
Japanese Government, Economic Planning Agency (1956)White Paper on Econoomy_1955, Tokyo. ―――, Ministry of Education, School Children Health
Statistics Survey, Annual Report, various issues, To-kyo..
―――, Ministry of Health and Welfare, National
Nutri-tion Survey, Annual Report, various issues, Tokyo. ―――, Ministry of Agriculture, Forestry and Fisheries,
Food Balance Sheet, Annual Report, various issues, Tokyo.
Mason, W. and S. Fienberg(1985)Cohort Analysis in
Social Research : Beyond the Identification Problem, New York : Springer-Verlag.
Matsumoto, K.(1982)“Secular acceleration of growth in height in Japanese and its social background,”
Annals of Human Biology, 9, 399―410.
Mori, Hiroshi eds.(2001)Cohort Analysis of Japanese
Food Consumption―New and Old Generations,
Sen-shu University Press, Tokyo.
Mori, H. and D. L. Clason(2004)“A Cohort Approach for Predicting Future Eating Habits : the Case of At -home Consumption of Fresh Fish and Meat in an Aging Japanese Society,” International Food and
Ag-ribusiness Management Review, Vol. 71(1), 22―41. Mori, H., D. L. Clason, K. Ishibashi, Wm. D. Gorman,
and J. Dyck(2009)“Declining Orange Consump-tion in Japan : GeneraConsump-tional Changes or Something Else?” Economic Research Report, No, 71, ERS/ USDA.
Mori, H. and Y. Saegusa(2010)“Cohort Effects in Food Consumption : What They Are and How They Are Formed,” Evolutionary and Institutional Economics
Review, 7(1), 43―63. <http : //link.springer.com/ar-ticle/10.4441.eier.7.43>
Fish in Japan,” Evolutionary and Institutional
Eco-nomics Review, 13(2), 363―379. <https : //dou.org/ 10.1007/s40844-016-0056-z.>
Mori, Hiroshi(2016)“Secular Changes in Body Height and Weight of Population in Japan since the End of WW II in Comparison with South Korea,” The
Monthly Bulletin of Social Science, No. 636, Senshu University, June, 13―25.
―――(2017)“Stature : Key Determinants of Positive Height Trend―The Cases of Japan and South Ko-rea,” The Monthly Bulletin of Social Science, No. 644, Senshu University, February, 21―40.
―――(2018)“Why Koreans Became Taller Than Japa-nese?” Annual Bulletin of Social Science, 52, Senshu University, 177―195.
Nakamura, Takashi(1986) “Bayesian Cohort Models for General Cohort Tables,” Annals of the Institute
of Statistical Mathematics, 38, 353―370. <http : // www.ism.ac.jp/editsec/aism/pdf/038_2_0353.pdf> Schrimper, R. A.(1979) “Demographic Changes and
the Demand for Food : Discussion,” American
Jour-nal of Agricultural Economics, 61(5), 1058―60. Steckel, Richard H.(1995)“Statue and the Standard of
Living, ” Journal of Economic Literature, XXXIII, 1903―1940.
Yang, Y., W. J. Fu, and K. C. Land(2004)“A Methodo-logical Comparison of Age-Period-Cohort Models : The Intrinsic Estimator and Conventional General-ized Models,” Sociological Methodology, Vol. 34, 75― 110.
Yang, Y., S. Schulhofer-Wohl, W. J. Fu, and K. C. Land (2008) “The Intrinsic Estimator for Age-Period-Cohort Analysis : What It Is and How to Use It,”
Appendix Table 2 Changes in per capita daily caloric supply from selected foods, 1934−1938 and 1946−1999
(kc/day)
Total grains meats fish milk veges fruit potatoes
1934―38 2068 1489 7.6 66.8 5.4 50.4 25.4 83.2 1946 1449 1112 3.0 36.0 3.0 36.0 9.0 181.0 1947 1695 1390 4.0 37.0 4.0 38.0 11.0 141.0 1948 1851 1440 4.0 41.0 4.0 40.0 15.0 184.0 1949 1927 1483 6.0 53.0 7.0 42.0 17.0 176.0 1950 1945 1527 8.0 71.0 9.0 44.0 19.0 142.0 1951 1858 1356 11.7 50.6 9.4 68.6 11.4 115.3 1952 1995 1376 14.8 61.2 13.6 67.7 16.0 143.0 1953 1933 1323 15.6 57.1 13.6 59.3 13.2 110.3 1954 1951 1336 16.7 58.7 18.2 58.8 15.0 109.2 1955 2217 1478 16.8 83.5 19.5 72.9 16.6 124.0 1956 2193 1460 19.9 79.3 22.6 70.5 22.7 117.7 1957 2270 1511 22.5 91.7 26.1 75.6 24.4 109.3 1958 2252 1466 25.7 89.1 28.9 73.0 25.0 104.8 1959 2277 1454 27.1 89.5 31.3 74.9 25.8 93.0 1960 2290 1439 27.5 86.6 35.9 84.1 28.9 81.5 1961 2335 1440 34.9 96.2 40.4 78.3 30.6 78.7 1962 2373 1441 43.3 94.2 45.8 85.6 31.1 67.3 1963 2385 1429 42.2 91.8 52.9 91.9 34.8 60.1 1964 2403 1429 46.7 77.3 57.3 86.8 39.2 58.6 1965 2408 1398 50.4 89.8 60.7 89.4 38.8 53.6 1966 2429 1361 58.2 89.6 67.5 94.3 44.0 50.7 1967 2444 1334 61.9 92.2 69.9 93.0 46.0 43.1 1968 2446 1302 61.1 93.2 72.9 993.0 52.7 42.6 1969 2447 1267 67.1 88.3 76.5 95.5 51.3 39.2 1970 2475 1238 78.0 92.2 80.9 93.3 53.4 38.8 1971 2474 1220 86.1 95.3 81.8 95.5 52.4 40.1 1972 2510 1203 92.6 95.9 83.7 95.1 61.6 40.6 1973 2513 1197 99.7 98.3 85.1 87.9 60.3 39.1 1974 2487 1187 100.3 100.3 83.7 89.4 56.4 37.8 1975 2518 1191 108.4 119.3 87.9 78.0 57.7 39.0 1976 2534 1179 114.7 118.7 94.2 79.1 55.2 40.1 1977 2554 1151 124.0 127.6 97.6 82.1 57.0 42.1 1978 2559 1133 130.9 137.2 101.5 82.5 55.9 42.9 1979 2557 1113 138.6 133.0 106.0 82.0 55.7 42.4 1980 2563 1112 138.3 133.4 107.4 80.3 53.6 41.3 1981 2562 1095 139.7 129.7 111.8 81.1 52.7 41.9 1982 2562 1083 143.0 126.3 109.9 82.7 54.9 43.3 1983 2566 1071 146.6 133.1 115.5 79.5 54.3 43.1 1984 2580 1070 149.8 132.9 117.3 82.2 49.4 42.7 1985 2597 1063 134.1 136.0 123.9 85.5 57.3 46.1 1986 2621 1051 139.8 140.6 125.0 86.4 58.8 48.0 1987 2624 1033 146.1 139.1 132.6 86.9 61.6 47.8 1988 2637 1027 150.7 139.6 142.6 86.4 61.7 47.6 1989 2642 1022 151.2 141.7 141.4 86.4 60.9 50.7 1990 2640 1020 153.4 143.1 145.9 85.4 60.4 50.7 1991 2629 1015 155.1 141.1 148.2 83.1 57.3 49.5 1992 2635 1014 159.4 137.1 146.4 84.4 62.7 50.2 1993 2625 1014 162.3 141.8 146.5 81.1 63.7 48.0 1994 2645 993 166.8 147.7 157.5 82.2 68.6 50.8 1995 2654 1003 169.4 148.4 159.5 84.2 66.0 50.2 1996 2670 1004 166.8 145.1 163.6 83.1 62.6 50.6 1997 2652 992 165.6 138.5 163.5 81.4 65.2 51.6 1998 2603 974 167.4 129.6 161.9 81.0 60.7 49.3 1999 2621 973 169.0 129.1 162.7 82.9 64.8 50.5
Notes : *1 Figures for 1946―1950 were derived from N. Kayo(editor at-large)
Basic Statistics for Japan Agriculture, 1977.