Abstract
Why there have been no such trends for demutualiza-tion as seen in the foreign countries? Mutual companies in Japan are very unique historically and internationally. Small number of mutual companies has dominated the industry for nearly 50 years. Life insurers newly found-ed are all stock companies, which suggest that stock companies are more desirable than mutual companies. At present only five mutual companies remain and their proportion of premium is 39.6% percent. The hypotheti-cal answers to the question are that they are no differ-ent than stock companies as a matter of fact and that they are too large to demutualize. This paper will exam-ine any ef fect of demutualization by reviewing a sequence of management indexes of five demutualized life insurers in Japan. It is the conclusion that the demutualization did not so much contribute to the value maximization of the company and that a remaining mutual company will have no reason to go through labor and expenses of demutualization unless they have some special reason to do that.
Keywords: demutualization; management indexes; value maxi-mization
1. Introduction
Mutual companies in Japan are rather unique in various aspects (Sugino 2011). They are only life insurers.1)
They were dominant in the life insurance industry for nearly 50 years after the World War II. There is a big gap between concept of mutualism and actuality of
prof-it-oriented company. In foreign countries, many mutual companies demutualized in 1990s but there were no such trends for demutualization in Japan. Many ques-tions and skepticism have been raised on mutual own-ership of large life insurers for decades. Those questions surrounded any reasons why most of the life insurers are mutual companies and what is the signifi-cance of their being mutual companies, as against apparent and theoretical advantage of stock ownership in the modern life insurance businesses. While Insur-ance Business Law was revised so that mutual compa-nies might converge to stock compacompa-nies in 1996, only five companies were demutualized out of 16 mutual life insurers. In 1980, the number of mutual companies was 16 out of 23 life insurers and the proportion of premium by mutual companies was 95%. In 2011, the number of mutual companies is only 5 out of total 42 life insurers and the proportion of premium by mutual companies are 48.9%.2)
The remarkable decrease of mutual companies was not due to demutualization as mentioned above. What dramatically changed the Japanese life insurance indus-try were the Heisei Life Insurance Crisis during April 1997 and March 2001 and the sweeping change of the Insurance Business Law in 1995. Seven traditional life insurers went bankruptcy during the crisis and their successors were foreign companies. As a result of deregulation in 1995, 13 companies newly entered the life insurance market. Those foreign and newly estab-lished companies are all stock companies. During some 40 years after the war (between 1950 and 1990), 20 tra-ditional life insurers dominated the life insurance mar-ket and the era is mentioned as “20-Company System.”
A Case Study on Demutualized Life
Insurers in Japan:
From Viewpoint of Comparison between Mutual
versus Stock Ownership
Fumitoshi Sugino
*Among 20 companies, 16 are mutual and 4 are stock companies. Out of 16 mutual companies, 5 companies went bankruptcy during the crisis, one company failed after the crisis, 2 companies merged and 4 companies converged to stock companies. Hence there are now 5 mutual companies and they are all traditional compa-nies.
There is a large body of literature on mutual life insurers in Japan as a result of extensive and intensive study which has lasted over a few decades and there is no decisive, definite and one sided opinion on superiori-ty and inferiorisuperiori-ty or pros and cons between mutual ver-sus stock ownership which is a reflection of the life insurance industry in Japan (Sugino 2011). During the crisis 5 mutual companies and 2 stock companies failed. As both mutual and stock companies failed, some case study was made in connection with corporate govern-ance between mutual and stock ownership because one of the major disadvantage of mutual company is consid-ered to be corporate governance. As a result of the study on those defunct companies, there was no signifi-cant difference found between mutual versus stock ownership as far as important causes of their failure were concerned (Sugino 2013). Now it is interesting and worthwhile to examine any change or effect of demutualization of the 5 companies, even though it might be rather premature to expect any conspicuous effect or outcome of demutualization in case of Dai-ichi which converged to a stock company only in 2010.
Obviously the life insurance industries in the US and Japan are quite different. For instance, in one of the recent empirical study, they used the data of 40 life insurers which demutualized during 1995 and 2004 (Erhemjamts and Leverty 2010: 1014). Between 1995 and 2004, the number of life insurers and number of mutual companies were 1,638 (1995) and 1,061 (2004) and 120 (1995) and 67 (2004) respectively. Compared to that, the number of insurance companies is extremely small and no such data is available in Japan. However, the hypotheses used in a variety of empirical study in the US, such as value maximization hypothesis and wealth expropriation hypothesis etc. as well as any out-come of such research are useful in the examination of this study. That is to say, the examination will be made based on the theoretical framework relied on those preceding study.
This paper will conclude that there are not many meaningful effects or implications as a result of demu-tualization, which will be consistent with the prevailing opinion and general observation to the effect that as a matter of fact, whether it is mutual or stock ownership does not matter so much as regards to not only corpo-rate governance but also performance of the traditional large life insurers in Japan. It also coincides with the fact that three of the 4 largest life insurers remain to be mutual companies without going through the time and expenses of demutualization.
The numbers in Table 1 were obtained from Nihon
Table 1. Number of Life Insurance Companiesa) by Year and Type
(A)b) (B)c) (C)d) (D)e) Total Mutual Stock 1908 1 15 0 0 16 1950f) 16 4 0 0 20 1980 16 4 3 0 23 2000 11 1 15 3 43 2011 5 8 16 6 42
Source: See the following notes.
a) Japan Post Life Insurance Co., Ltd. is excluded. b) (A) represents the category of traditional companies.
c) (B) represents the category of foreign companies (or branches of foreign insur-ers).
d) (C) represents the category of subsidiary companies of non-life insurers.
e) (D) represents the category of other type companies, such as non-insurance companies’ subsidiary companies (Sony, Orix etc.), and independent new compa-ny (Lifenet) etc.
Seimeihoken Kyokai Hyakunenshi (100-year History of
Japan Life Insurance Association) and Nissei-Kisoken
REPORT (NLI Research Institute). In 1908, there were
35 life insurance companies including ones under liqui-dation process and having stopped business. The num-ber shown here is the one of the companies who were members of the Life Insurance Companies Association which was established in 1908. The three foreign com-panies in 1980 were American Life Insurance Company, American Family Life Assurance Company of Colum-bus and Seibu Allstate Insurance Company. Four tradi-tional stock companies in 1980 were Heiwa, Taisho, Nihon-Dantai, Kyoei out of which Heiwa merged with a foreign company, Taisho and Kyoei went bankruptcy. In 2001, Nihon-Dantai merged with AXA Group making the number of traditional stock company zero.
Among 7 traditional stock companies in 2010, 4 are T
& D Financial, Dai-ichi Frontier, Fukoku Shinrai and Medicare which were founded by parent traditional companies in recent years.
Six category (D) companies in 2011 are Sony, Orix, Airio, Life-net, Midori and Nextia (Nissei-Kisoken Report July 2012). Life-net, Airio and Midori started operations in 2008 and Nextia is a new name of SBI-AXA from 2010. Life-net is the company founded independently without having any sponsor companies for the first time in 74 years (Iwase 2009: 18).
2. Why No Such Trend for Demutualization? The number of life insurers excluding the Japan Post is 42 out of which the number of mutual insurers is 5 (see Table 1). While the number of mutual companies is only 5, the total amount of premium by mutual
compa-Table 2. Proportion of Premium Income and Assets by Company Type (2011)
Number Premium (Trillion yen) Share (%) Asset (Trillion yen) Share (%) (A) 5a) 14.23 39.6 116.2 35.6 13 20.33 68.4 170.9 73.3 (B) 16 6.96 23.4 43.0 18.4 (C) 7 1.46 4.9 13.5 5.8 (D) 6 0.97 3.3 5.8 2.5 Total 42 29.73 100 233.3 100
Source: Prepared by the author based on Nissei-Kisoken REPORT, July 2012 etc. a) This is the number of mutual companies.
Table 3. Traditional Mutual and Stock Insurers
Traditional Life Insurers as of March 2012
Mutual Companies (Prem. : Million Yen) Stock Companies (Prem. : Million Yen)
1. Nippon Life (5,367,387) 1. Dai-ichi Life (3,055,324)
2. Meiji-Yasuda (5,183,13) 2. Taiyo (903,280)
3. Sumitomo (2,589,857) 3. Daido (719,827)
4. Fukoku (589,599) 4. Mitsui (581,650)
5. Asahi (505,453) 5. Fukoku Shinrai (360,917)
6. Dai-ichi Frontier (306,696) 7. T & D Financial (66,389) 8. Medicare (50,486)
Total Premium : 14,253,459 Million Yen Total Premium : 14,253,459 Million Yen
nies is ¥14,235 billion (48.9 % of all life insurers) and the amount of assets is ¥116,246 billion (35.6% of all life insurers) (see Table 2). Therefore the presence of mutual companies is still significant in Japan. This is because the majority of traditional large insurers remain to be mutual companies (see Table 3).
As stated above, 42 life insurers in Japan consists of 5 mutual companies and 37 stock companies. Thirty-sev-en stock companies comprise of 4 demutualized compa-nies, 4 subsidiary companies of large traditional life insurers, 16 foreign companies, 7 subsidiary companies of non-life insurers and 6 other category companies. Thirty-three companies are the ones newly founded in the 1970s and later (see Table 1). It is worth noting that those newly established companies are all stock compa-nies and no mutual company was ever created after the 14 traditional insurers. Even such a company as Life-net was founded as a stock company, while it is the compa-ny pursuing policyholders’ interest to the extreme by selling life insurance at half price of the conventional life insurers. These facts imply that mutual companies
do not have so much significance in the modern days and that the traditional mutual companies are not so much different from stock companies as a matter of fact.
There was a dramatic change in the life insurance industry in Japan before and after 2000 (see Table 1). The number of companies doubled and they were diversified into 4 different categories. Among other things, the number of mutual companies remarkably decreased from 16 to 5 (see Table 4). There were two major reasons for this decrease. First, as many as 7 life insurers went bankruptcy in Japan during the 4 years between April 1997 and March 2001. It was unprece-dented phenomenon in the history of insurance indus-tries in Japan and was called the “Heisei (the era started since 1989) Life Insurance Crisis.” Out of 7 insurers, 5 insurers were mutual and 2 insurers were stock companies (see Table 5). In lieu of the defunct life insurers, foreign insurers entered the market by taking over their businesses resulting in the increase of foreign insurers (see Table 6).
Table 4. Dominance by Mutual Companies
Percentage of Mutual Cos. by Premium Number of Mutual Companies 1980 95% 16 1997 89% 15 2000 85% 11 2011 40% 5
Source: Data of 1997 was obtained from Birkmaier and Laster (1999: 18) and data of other years from Seimei-Hoken Tokei-Go for respective years.
Table 5. Demography of 7 Bankrupt Insurers
Company History Form Size Lines Group
Nissan (16) 1909–1997 (89) mutual M C G (Hitachi-Nissan)
Toho (14) 1898–1999 (102) mutual M P F (Ota family)
Daihyaku (15) 1914–2000 (87) mutual M P G (Kawasaki)
Taisho (20) 1913–2000 (88) stock S P Independent
Chiyoda (10) 1904–2000 (97) mutual L C G (Satsuki)
Kyoei (12) 1935–2000 (66) stock L C I (Founder)
Tokyo (17) 1895–2001 (107) mutual M P G (Nomura)
Source: Prepared by the author based on Uemura (2008) etc.
Notes: The parenthesis after company name is ranking by income in 1996 (see Table 6).
Second, there was material reform of insurance regu-lation by the sweeping revision of the Insurance Busi-ness Law in 1994. In Japan, it was prohibited that life insurers undertake non-life insurance and non-life insurers operate life insurance businesses. As one of the major deregulation, the law was amended so that they can do life or non-life insurance business by mak-ing subsidiary life or life insurers. As a result, non-life insurers formed 11 subsidiar y non-life insurance
companies in 1996 (see note b) of Table 6).
On the other hand, the mutual companies demutual-ized were only five which were Daido in 2002, Yamato in 2002, Taiyo in 2003, Mitsui in 2004, and Dai-ichi in 2010. Thus main reason for decrease of mutual compa-nies was not demutualization in Japan. In other words, there was no such trend for demutualization in other countries in spite of disproportionally large presence of mutual companies (see Tables 7 and 8) and some
Table 6. 20-Company System and 7 Bankrupt Insurers in 1996a)
Company Name Form Premium Income
(billion yen) At present/successor
1 Nipponmutual ¥5,893 mutual
2 Dai-ichi mutual ¥3,884 stock (2010)
3 Sumitomo mutual ¥3,428 mutual
4 Meiji mutual ¥2,519 merged (mutual)
5 Asahi mutual ¥1,713 mutual
6 Mitsui mutual ¥1,586 stock (2004)
7 Yasuda mutual ¥1,501 merged (mutual)
8 Taiyo mutual ¥1,281 stock (2003)
9 Daido mutual ¥1,105 stock (2002)
10 Chiyoda mutual ¥860 AIG
11 Fukoku mutual ¥858 mutual
12 Kyoei stock ¥814 Prudential(US)
13 Nippon Dantai stock ¥670 AXA (2001)
14 Toho mutual ¥598 GE Edison
15 Daihyaku mutual ¥500 Manulife
16 Nissan mutual ¥225 Aoba
17 Tokyo mutual ¥211 Taiyo/Daido
18 Heiwa stock ¥84 Foreign company
19 Yamato mutual ¥56 stock (2002)
20 Taisho stock ¥48 Azami
20 companies total ¥27,834 (95%)
Others: 24 companiesb) ¥1,520 (5%)
Total: 44 companies ¥29,354
Source: Prepared by the author based on Seimei-Hoken Tokei Go (Statistics of Life Insurance Business in Japan) 1997.
a) This is the year where you can see the industry picture before the crisis and the reform of Insurance Business Law started to change it dramatically.
assertion to the effect that it should improve access to capital market, provide managers with more free hands on business developments, help avoid bankruptcy, and serve for national economy (Tsuru 2000: 99).
This is quite contrary to the demutualization trend in other countries. In the US, many mutual life insurers converted into stock ownership in 1980s and 1990s (see Table 9). Especially towards the end of 1990s and the beginning of 2000s, large life insurance companies were demutualized resulting in only one mutual compa-ny in the top 10 life insurance companies and three mutual companies in the top 20 life insurance
compa-nies. It is due to the change of product or service port-folio from life insurance to pension insurance, from life insurance to financial services, and deregulation of financial services due to the enactment of Gramm-Leach Bliley Act (Tsuru 2000: 91-92).
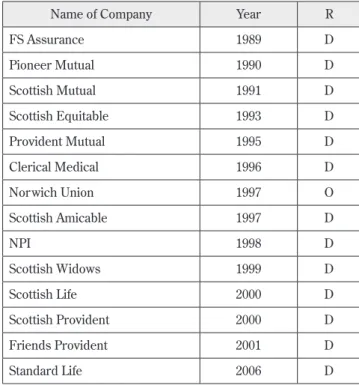
In the UK, a majority of mutual life insurance compa-nies was demutualized in 1990s and 2000s with only a few small mutual companies remaining (see Table 10). Life insurance companies in UK developed mostly as long term savings institutions and the competition with other institutions such as banks and home savings and loan institutions were intensified owing to the
deregula-Table 7. Market Share of Property and Casualty Mutual Company (1997)
United States Japan United Kingdom Germany France
33% 3% 8% 16% 37%
Source: Birkmaier and Laster (1999: 6).
Table 8. Market Share of Life/health Mutual Companies (1997)
US Japan UK Germany France
Number of Mutuals 100 15 47 53 17
Market Share 35% 89% 33% 26% 5%
Source: Birkmaier and Laster (1999:18).
Table 9. Demutualization in US
Name of Company Year R
Maccabees 1989 D
Equitable Life 1992 D
Midland Mutual Life 1994 D
State Mutual 1995 O
Guarantee Life 1995 O
MONY 1998 O
Standard Insurance Co. 1999 O
John Hancock 2000 O
Metropolitan (Metlife) 2000 O
Phoenix Home Life 2001 O
Prudential 2001 O
Principal 2001 O
Source: Tsuru (2000: 92), reason column, etc. added by the author.
Table 10. Demutualization in UK
Name of Company Year R
FS Assurance 1989 D Pioneer Mutual 1990 D Scottish Mutual 1991 D Scottish Equitable 1993 D Provident Mutual 1995 D Clerical Medical 1996 D Norwich Union 1997 O Scottish Amicable 1997 D NPI 1998 D Scottish Widows 1999 D Scottish Life 2000 D Scottish Provident 2000 D Friends Provident 2001 D Standard Life 2006 D
tion of financial services under the Financial Services and Markets Act of 2000.
When they demutualized, they were sponsored by home savings and loan institutions or banks with the only exception of Norwich Union which was independ-ent and changed to stock ownership for strategic rea-sons. It is interesting that there was activism of policyholders, so called carpet bagger behind demutu-alization of some companies such as Friends Provident, Scottish Provident and Standard Life (Tsuru 2000: 108-110).
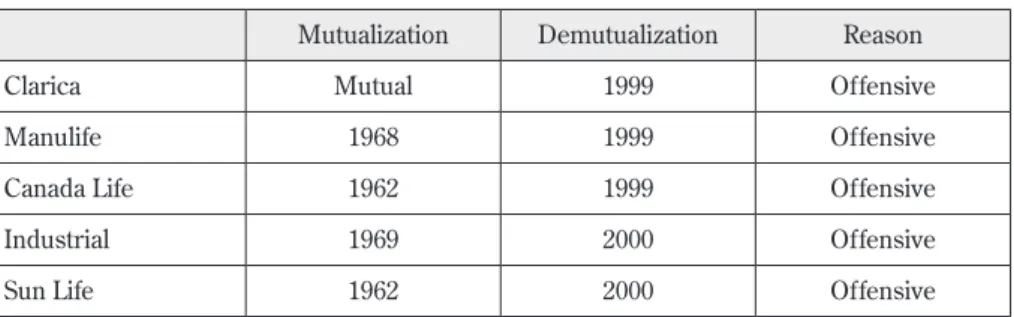
In Canada, life insurance companies have become mutual companies so as to prevent foreign interests from merging and acquiring them in 1950s and 1960s. On the contrary, however, they have again chosen to go back to stock ownership under the movement towards financial conglomerate around 2000. Five mutual com-panies including top four comcom-panies have converted into stock companies as shown in Table 11 (Tsuru 2000: 97).
In Australia, top 3 mutual life insurance companies have been demutualized remaining only one mutual company. They are National Mutual in 1995, Colonial Mutual in 1997 and AMP in 1998. There has been only one, relatively small mutual company named CUNA Mutual in Australia. In South Africa, Sanlam and Old Mutual, the two largest mutual life insurance compa-nies, were demutualized in 1998 and 1999 respectively. Swiss Life, the biggest life insurance company founded in 1857 were demutualized in 1997 (Birkmaier and Last-er 1999: 4).
In Germany and France, there has been no such trend for demutualization, because mutual companies in both countries are relatively small and mostly a part of business group having strong ties peculiar to mutual community (Tsuru 2000: 99)..
While the exact reasons for demutualization may dif-fer according to various companies, they are basically categorized into two groups. One is defensive reason to cope up with financial or managerial difficulty3) and
another is offensive reason to gain competitive strength or to improve corporate governance (Mizushima 2001: 5-6 ; Tsuru, 2000: 94 ; Ono 2004: 97-99). Please see the reason column (shown as “R”) in the Tables 9, 10, and 11. In the UK (Table 8), Scottish Provident, Friends Provident and Standard Life have demutualized as a result of the carpet baggers activity. .
In Japan too, there was some shift from life insurance to pension insurance or to savings type insurance etc. Then why was there no such trend for demutualization in Japan? Some hypothetical answers to the question are the uniqueness and nature of mutual company in Japan (Sugino 2011). For instance, there is a gap between concept and actuality, or mutual company is no different than stock company in case of large traditional life insurers in Japan. Its presence is so prevalent his-torically and at present, or they are too large and mature to demutualize.
3. Existing Study
1) Gap between concept and actuality
As mutual companies have grown into large companies, it has evoked very strong interest and questions among many scholars as to what is mutual company and what type of company it should be and how it will develop in the future (Mizushima 2001: 6). This is because the gap has been generated between the concept of mutual company and its operation in the real world as unavoid-able consequences of historical developments (Mizush-ima 1989: 31).
The concept of mutual company consists of mutual sharing of expenses and self-governance by policyhold-ers (Mizushima 2001: 7). In other words, mutualism means nonprofit enterprise as well as mutual assistance among policyholders (Yoneyama 2001: 9). The advan-tage of mutual company is to be able to avoid conflict of interest between policyholder and stockholder and also to be able to overcome uncertainty pertaining to long term insurance contract (Chano 2001; Iguchi 2000).
Table 11. Demutualization in Canada
Mutualization Demutualization Reason
Clarica Mutual 1999 Offensive
Manulife 1968 1999 Offensive
Canada Life 1962 1999 Offensive
Industrial 1969 2000 Offensive
Sun Life 1962 2000 Offensive
Mutualism was not so conspicuous or it was not so considered as characteristics peculiar to mutual compa-ny before the war as it was so regarded after the war (Mizushima 2001: 21; Yoneyama 2001). That is to say, large mutual companies after the war have fully taken advantage of it as their raison d’etre, because one of the most important products for them was the long term life insurance. While there seems to be general consen-sus that mutual companies in the actuality are not in line with the concept of mutual company, there are some opinions that support mutualism as a backbone of the present mutual companies.
Some of the views are as follows. What is really nec-essary for mutual company is to shift the paradigm of management so as to make policyholder interest first priority, for instance to return hidden assets to policy-holder (Mizushima 2001: 14). Mutual company at pres-ent lacks attitude to abide by real “sharing expenses” policy (Mizushima 2001: 15). Even stock company pur-sues customer satisfaction, then, what is mutual compa-ny’s customer satisfaction? (Mizushima 2001: 22). Mutual company is the method to protect policyholder interest in view of the nature and long term contract of insurance (Iguchi 2000: 13).
2) Corporate governance
Discussions and study on corporate governance in mutual companies has started in 1960s, which is much earlier than corporate governance in general has become one of the most important issues in the wide range of social science both in Japan and other coun-tries in 1990s. This is because corporate governance is indispensible element of mutualism as stated above. It goes without saying that governance by policyholders cannot be easily done in mutual companies if the num-ber of policyholders goes up to 10 million to 14 million in case of large companies and 1 million to 3 million in case of medium company. Even though they have invented the system of the representatives meeting, it does not function as expected because representatives are chosen by company and many policyholders are not conscious of their right and duty as important stake-holder being equivalent to stockstake-holder.
Under the circumstances, it is not realistic to regard governance by policyholders as essential ingredient of mutualism or mutual company and to characterize mutual company as nonprofit enterprise (Maeda 1995: 122, 127). It is the limitation on governance by policy-holders (Mizushima 2001: 14) and representatives meeting does not function as expected to make govern-ance effective (Iwasaki 1989: 5; Takao 1999: 38).
In 1990s, seven life insurance companies went
bank-ruptcy. One of the reasons for their failure was ineffec-tive corporate governance. Among seven companies, there were both mutual companies and stock compa-nies.4) Thus you cannot attribute it solely to mutual
ownership. Rather it was found out as a result of investi-gation based on oral history that one of the major caus-es of the failure was lack of proper management which suggests that there was no corporate governance regardless of whether it was mutual or stock ownership (Uemura 2008). In Japan, there was no effective corpo-rate governance by stockholders due to absence of sep-aration of execution and supervision. Therefore, so far as corporate governance in the past 50 years is con-cerned, there should have been no difference between mutual company and stock company.
Theoretically speaking, even though there is equally ineffective control over the manager, stock form is bet-ter than mutual form, because the inbet-terests of manager and shareholder might be concomitant as to conserva-tion of wealth and growth of the company while the interests of manager and policyholder are mostly adverse on those matters (Hetherington 1969: 1102-1103). Anyway, as a matter of fact, there have been so many regulator y reforms introduced in Japan to strengthen corporate governance since 1990s.5) Hence,
if they are serious to improve corporate governance, there is no question that stock company is more advan-tageous than mutual company.
3) Diversified views in Japan
There are many different views as to the issues of mutual versus stock ownership of life insurers in Japan. The followings are some of them.
• While there is some notable tendency that more and more life insurance companies in overseas countries are demutualized recently, I do not see so much significance in demutualization of Japanese companies (Iguchi 2000: 2).
• It is not reasonable that you make comparison between mutual companies and stock companies just from viewpoint of efficiency (Chano 2001).
• It is not ver y significant to make unilateral comparison between them (Okamura 2006: 226). • As a result of empirical study in the US, there has
been no clear conclusion that either is more efficient than others (Chano 2001).
• There is no evidence that it is a historical certainty that the number of mutual companies will be decreased (Tanaka 2002: 38).
• It is not always true that trend for demutualization is universe. There are many mutual companies in the world who are well run, respected by customers and competitors alike (Birkmaier and Laster 1999: 34). • Modern nature of mutual company is to prioritize
policyholder interest under complete control by manager because expense sharing policy and self-governance by policyholders are no more part of mutualism in the present mutual company in Japan. Therefore what does really matter is manager’s ethics and strong leadership to ser ve for such purposes (Mizushima 1992: 16-17; Mizushima 2001: 14).
• Because the interests of manager and policyholder do not necessarily coincide, it is up to regulatory development whether mutual company will really pursue policyholder interest (Hetherington 1969: 1102-1103). In Japan, on the contrary, what actually precluded mutual companies from achieving policyholder interest in 1980s was government policy to protect the industry as a whole (Mizushima 2001: 10-13).
• As for corporate governance of mutual company, Japan might be ahead than UK in that some measures are incorporated to make its governance system comparable to stock company and that the procedures of councils meeting and policyholders meeting have been built in the system (Hisamatsu 2006 : 70).
• Based on the empirical study to find out any difference in risk taking behavior between mutual versus stock, and “keiretsu” affiliation versus non-keiretsu life insurers in Japan, it was concluded that mutual and keiretsu companies have less risk taking attitudes than stock and non-keiretsu companies respectively (Yanase et al. 2008). In connection with this study, another interpretation was proposed to the effect that it was due to the scale of company rather than company form and affiliation reasons because mutual and keiretsu companies were far larger than stock and non-keiretsu companies (Kofuji 2010). 4) Extensive study in the US
On the issues of mutual versus stock forms, extensive study has been made by many scholars and research-ers for long time in the US6) and some of the
represent-ative views on various issues are as follows. As will be shown here, different theories such as adverse selec-tion theory, moral hazard theory, and managerial dis-cretion theory are entangled in construing coexistence of mutual and stock forms, and due to the mixed evi-dence, you cannot say one way or another conclusively
on whether mutual or stock ownership is more efficient or superior as a form of insurance company (MacMinn and Ren 2010).
• There could be adverse selection of customers where customers prefer stock form when risk is high, which is characterized as expropriation of policyholder capital (Laux and Mauermann 2006).
• When the risk is low, mutual form is selected so as to enjoy cheaper premium (Smith and Stutzer 1990). Actually there is some evidence that stock insurers tend to underwrite higher risks by lines of business or geographically (Lamm-Tennant and Starks 1993; Mayers and Smith 1988; 1994).
• At the time of insurance crisis, no insurance was available for certain liability risks and mutual form such as Risk Retention Group was the solution. This is the example of adverse selection of owners (Doherty and Dionne 1993). From investors point of view, stock form is the preference when risks are more predictable and capital is accessible (Mayers and Smith 2002; Viswanathan and Cummins 2003). • Stock form does not provide such incentive for risk
management as mutual form does and mutual form is more appropriate in connection with the moral hazard of policyholders (Smith and Stutzer 1995). • As for moral hazard of owners, claims agents are
employed to prevent the owners from delaying claims payment (Kim, Mayers, and Smith 1996). • The owners of stock insurers sometimes tr y to
maximize the investment return at the expense of the interest of policyholders (Merton 1974; 1977).
• As one of the examples of risk-shifting moral hazard of owners, there is some evidence that stock insurers do not utilize so much reinsurance as mutual insurers (Mayers and Smith 1990).
• Stock insurers choose riskier activities (Lamm-Tennat and Starks 1993).
• Stock insurers take significantly more risk in response to the adoption of insurance guarantee funds (Lee, Mayers, and Smith 1997).
• Moral hazard of managers such as managerial discretion problem occurs when ownership and management are separated (Jensen and Meckling 1976; Fama and Jensen 1983).
• Based on the survey of about 60 largest insures, the rate of proxy voting at mutual insurers was extremely low compared to stock insurers (Green and Johnson 1980).
risks in terms of lines of business and geographically (Mayers and Smith 1986).
• In case of life insurance sector, however, there is some mixed evidence on the managerial discretion hypothesis to the effect that mutual insurers exert less managerial discretion but that the majority of life insurers businesses are life insurance and individual insurance and most of assets are held in separate accounts (Pottier and Sommer 1997).
• Executives of mutual insurers are less compensated than executives of stock insurers because the latter is required more managerial discretion, which supports the managerial discretion hypothesis (Mayers and Smith 1992).
• Mutual insurers have more number of outside directors of board because they do not have such mechanism of corporate governance as stock insurers have (Mayers , Shivdasani, and Smith 1993; He and Sommer 2010).
• Managerial discretion is not the sole factor to explain the structure of ownership in life insurers (Pottier and Sommer 1997).
• Any function and significance of mutual insurers are better explained by the adverse selection and moral hazard of customers than managerial discretion hypothesis or agency theory (Smith and Stutzer 1995).
• Whether mutual or stock form is more efficient depends on its business model and types of products etc. in case of the US property and casualty insurers (Cummins, Weiss, and Zi 1999).
• There is no difference of efficiency between mutual and stock form based on the studies regarding the Japanese property casualty insurers (Jeng and Lai, 2005), Spanish insurers (Cummins, Rubio-Misas, and Zi 2004), the US life insurers (Cummins and Zi 1998; Boose 1990).
5) Reason for demutualization
In the US, there are more than one thousand life insur-ers and scores of mutual companies converged to stock ownership. On the other hand, there were only 20 or so life insurers and just five mutual companies demutual-ized in Japan. Furthermore there was no such situation as Product Liability Crisis or Insurance Crisis where the issues of availability and affordability of insurance emerged as a social problem. A supply of insurance has been basically stable and continuous in Japan and there has been no noticeable underwriting cycle in Japan contrary to the US. Under the circumstances, most of the hypotheses based on theories of adverse selection or moral hazard are not very realistic to apply to the
Japanese life insurers for empirical study purposes. That is to say, any reason for coexistence of both mutu-al and stock companies and comparison of efficiency between mutual and stock ownership are not so much questioned as far as life insurers in Japan are con-cerned.
Then what is more relevant for life insurers in Japan is the question why mutual insurers would converge to stock ownership and what is effect of demutualization. While the number is small, there were 5 mutual compa-nies demutualized and whether or not the remaining large mutual companies will also demutualize in the future is a question evoking some research interest. According to what Japanese life and nonlife insurance industries put together, there are four reasons for demutualization. They are to improve access to capital market, to have free hands on business developments, to avoid bankruptcy (raised by only life insurance com-panies) and to serve for national economy (Tsuru 2000: 99).
As stated above, dozens of mutual companies demu-tualized since 1900s in the US, for which an important incentive was access to capital market so as to facilitate an acquisition, etc. and mutual companies are no less efficient than stock companies according to empirical study of 33 life insurers before and after demutualiza-tion (McNamara and Rhee 1992: 223,235-236). It was also found that after demutualization the weight of non-participating insurance increased (McNamara and Rhee 1992), which is consistent with the Daido’s case in Japan.
There may be the demutualization initiated by man-ager who wants to maximize their compensation and to manage the company without much restraint (Viswana-than and Cummins 2003; Mayers and Smith 2004). Likewise, it was substantiated that mutual company executives were less paid than stock company execu-tives (Mayers and Smith 1992).
As a result of the empirical study of 41 companies from 1966 through 1984, it was concluded that there is no systematic difference but a strong significant differ-ence of regulatory regimes between mutual and stock companies (Boose 1990). Thus it appears that there is no strong evidence that either form of company is more advantageous than other form as a result of empirical study in the US.
insurers converted to the stock ownership and the per-centage of total assets held by mutual companies declined from 36% to 10% (Erhemjamts and Leverty 2010: 1012).
The common hypotheses regarding motivation for demutualization are grouped into value maximization theory and expropriation wealth theory (Mayers and Smith 1986 Erhemjamts and Leverty 2010). Value maxi-mization theory consists of access to capital theory (Butler, Cui, and Whitman 2000; Viswanathan and Cummins 2003) and operating efficiency theory (May-ers and Smith 1988; 1994). While efficiency theory has not been extensively examined, some evidence was proposed to the effect that efficiency did not improve after demutualization which took place between 1984 and 1995 (Jeng, Lai, McNamara 2007). This is consist-ent with the above findings of McNamara and Rhee (1992).
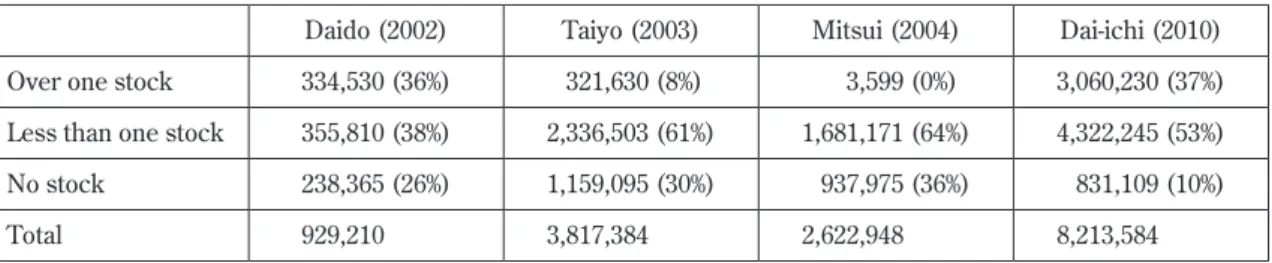
With regards to wealth expropriation theory, the poli-cyholders of Dai-ichi were appropriated 10 million of stocks with the total value of 1.4 trillion yen and it does not appear that policyholders of Dai-ichi and other demutualized companies do not have any complaint that their wealth were expropriated, which is quite con-trast to the US where lawsuits were filed against Pru-dential and Metlife in connection with their reorganization. The number of policyholders or the proportion of the policyholders who did not receive any stock or monetary compensation for their contribution
to the surplus are from 10% of Dai-ichi to 36% of Mitsui (see Table 12).
Under the circumstances, the following analysis will be made based on the theoretical framework of value maximization hypotheses by using the management indexes from the Seimei-Hoken Tokei-Go for both preceding and following years of the demutualization. The questions on any effect and purposes for which the management indexes are available and shown in Table 13.
4. Analysis 1) Daido Life
Daido was founded as a stock company by merging of Asahi Life, Gokoku Life and Hokkai Life in 1902 and restarted as mutual company in 1947. Their premium was ¥1,105 billion and ranked number 9 as of March 1996 (see Table 6). They originally targeted personal lines of business but shifted to commercial lines in the early 1970s (Uemura 2000: 170–173). They developed commercial businesses in rather unique way by making alliance with various business associations or US life insurers. They have strong customer bases of medium and small corporations. Daido has higher level of sur-plus, solvency margin ratio and profitability among large and medium life insurers. They did not so much rely on depreciated value of shares as other insurers, which mitigated any impact by plunging of stock prices.
Table 12. The Number of Policyholders Who Received the Stock or Money
Daido (2002) Taiyo (2003) Mitsui (2004) Dai-ichi (2010)
Over one stock 334,530 (36%) 321,630 (8%) 3,599 (0%) 3,060,230 (37%)
Less than one stock 355,810 (38%) 2,336,503 (61%) 1,681,171 (64%) 4,322,245 (53%)
No stock 238,365 (26%) 1,159,095 (30%) 937,975 (36%) 831,109 (10%)
Total 929,210 3,817,384 2,622,948 8,213,584
Source: Table 15–17 (NLI 2011: 369) modified by the author.
Table 13. Questions and Management Index
Question on Effect and Purposes Management Index
Whether there was a growth? Premium, Ratio of New Business
Whether value was maximized? Return on Assets
Whether efficiency was improved? Expense Ratio, Ratio of Cancellation,
Whether access to capital was achieved? Surplus
Whether financial stability was enhanced? Solvency Margin Ratio
They entered into agreement of business alliance with Taiyo in 1999 (see Table 14).
[1] Premium (billion yen)
After the demutualization the premium has decreased constantly year by year and now it is the level of about half of the preceding years. The premium of 2011 is ¥582 billion while it was ¥1,308 billion in 2001. The ratio of new business was sim-ilar with the previous year for several years after demutualization and during the recent years it lowered than before. Based on these data, there is no evidence that the demutualization contribut-ed to the growth.
[2] Return on Assets (%)
The ROA ratio has been generally not so much different before and after the demutualization. [3] Expense Ratio (%)
The expense ratio deteriorated yearly with 14.3 % of 2011 against 10.2% of 2001. So it was not the case that the efficiency was enhanced by the demutualization.
[4] Cancellation Ratio (%)
The ratio of cancellation increased about 2 points in 2008 and 2009 but it recovered to the same lev-el of 2002 in 2011. So you cannot say that the demutualization was not well received by the poli-cyholders.
[5] New Business Ratio (%)
A development of the ratio of new business has been a little downward after the demutualization. [6] Surplus (billion yen)
What was remarkably improved were surplus and solvency margin ratio. The amount of surplus steadfastly grew and it was ¥194.2 billion in 2011 although it was ¥86.4 billion in 2001.
[7] Solvency Margin Ratio (%)
Solvency margin ratio exceeded 1000% after the demutualization while it was 772% in 2001.
2) Yamato Life Insurance Co., Ltd.
Yamato Life Insurance Co. Ltd. was one of 20 traditional insurers. It was a small mutual company with its rank-ing No.19 and the premium income berank-ing ¥56 billion. The predecessor company of Yamato was founded as a draft insurance company in 1911. It converted to Yama-to Life Insurance Co. Ltd in 1945 and restarted as Yam-ato Life Mutual Company in 1947. YamYam-ato was restructured into two companies with one being Yamato (old) which only dealt with old businesses and another being Azami which was founded jointly with Softbank Finance to succeed Yamato’s new businesses in 2001. Taisho which was the smallest stock company among 20 traditional insurers with the premium income of ¥48 billion transferred its portfolio to this Azami. Then Azami and Yamato (old) merged giving birth Yamato (new) in 2001. Yamato (new) was also an unlisted stock company.
Yamato went bankruptcy in 2008. It was not included in the Heisei Life Insurance Crisis because it took place after the crisis was over and under the world credit cri-sis due to Lehman shock. The reason for the failure was their investment inclined to high risk securities (Kofuji 2010b). At Yamato, the average assumed inter-est rate was 3.35%. Their invinter-estment into public and corporate bond was 18.1% with stock being 14.6%, for-eign securities being 23.9%, loan being 9.6% in 2007, whereas they were 37.3%, 7.4%, 12.1%, 20.8% in 2002. This shows that the investment shifted from public and corporate bond and loan to more risky stock and for-eign securities. The stock and forfor-eign securities increased from7.4% to14.6% and from 12.1% to 23.9% respectively. On the contrary, the public and corporate
Table 14. Data of Management Efficiency and Solvency: Daido
Data 2000 2001 2002 2003 2004 2005 2006 2007 2008 2009 2010 2011 [1] 1,072 1,308 963 928 884 871 865 843 811 640 657 582 [2] 2.19 1.03 1.47 2.11 1.89 1.87 2.31 2.21 (-)1.81 1.50 1.95 1.86 [3] 10.0 10.2 11.0 11.7 12.3 12.6 12.9 13.6 14.1 12.8 14.5 14.3 [4] 10.0 10.1 9.6 9.7 8.8 8.8 10.4 10.2 11.5 11.5 10.1 9.4 [5] (-)0.1 11.8 11.9 11.1 11.2 10.9 11.0 11.9 9.6 9.2 9.6 9.4 [6] 56.5 86.4 53.34 86.7 101.8 132.1 166.2 186,8 161.5 175.7 183.7 194.2 [7] 757.6 772.0 860.2 1034.9 1037.2 1254.4 1320.6 1096.3 820.7 1120.6 720.6 851.9
Source: Seimei-Hoken Tokei Go (Statistics of Life Insurance Business in Japan) for respective years.
bond and loan reduced from 37.3% to 18.1% and from 20.8% to 9.6% respectively.
Kofuji (2010b) proposed the observation that this was one example of a stock company having more risk taking tendency than mutual company. At the same time, Kofuji (2010b) pointed out that the president of Yamato (new) did not have insurance but securities business background. Like the 7 insurers failed in the Heisei Life Insurance Crisis, the failure of Yamato (new) was ultimately attributable to poor management by the president. Because Yamato (new) was unlisted company, there appeared to have been no proper gov-ernance by shareholders. Therefore you cannot assert that the company was more risk taking thanks to stronger corporate governance, which was the finding by Keizai Zaisei Hakusho (Economics Finance White-paper by Japanese Government) of 2008. In case of Yamato (new), the president was almighty and not so capable as to avoid bankruptcy. If that is the case, the corporate form whether it is mutual or stock ownership should not be relevant to its corporate governance and solvency.
A change and development of management indexes before and after demutualization are as follows (see Table 15).
[1] Premium (billion yen)
The amount of premium increased in 2002 and 2003 but it went down to the previous level. Both in 2000 and 2004, it was ¥39 billion with the ones of 2007 being ¥35 billion.
[2] Return on Assets (%)
The ROA ratio went very high during four years after the demutualization. This is considered to be due to the aggressive investment leading up to
the bankruptcy. [3] Expense Ratio (%)
The expense ratio deteriorated after the demutu-alization. However the ratio has been extraordi-narily high compared to other companies throughout the years before and after the demu-tualization.
[4] Cancellation Ratio (%)
The ratio of cancellation has been improved after the demutualization.
[5] New Business Ratio (%)
The ratio of new business is not very much differ-ent before and after the demutualization.
[6] Surplus (billion yen)
The amount of surplus slightly increased after the demutualization. However the amount itself is extremely small in comparison to the other com-panies.
[7] Solvency Margin Ratio (%)
Data is not available to make comparison. 3) Taiyo Life
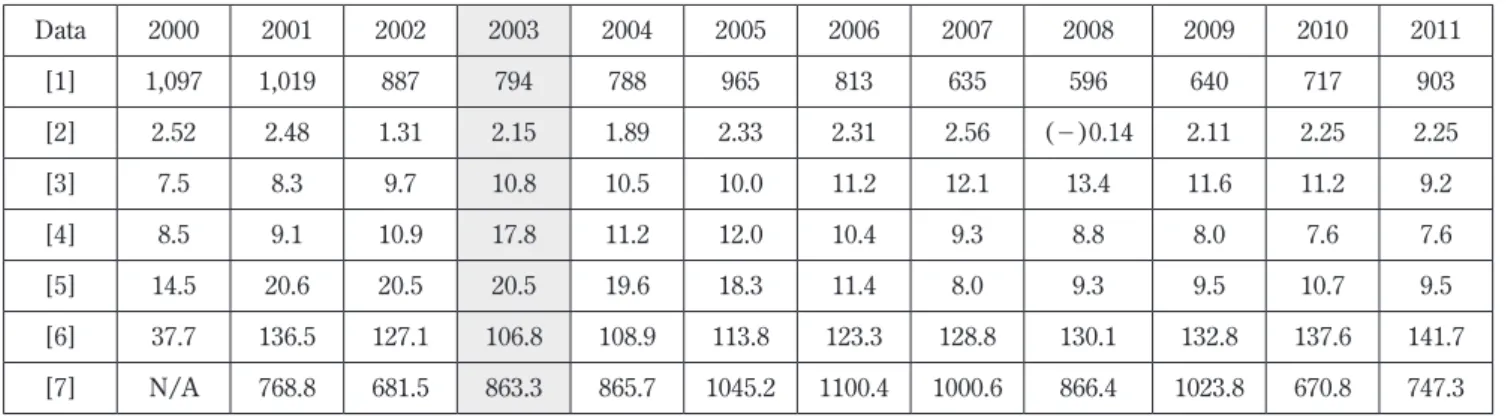
Taiyo was founded as a stock company in 1893 and restarted as a mutual company in 1948. Their premium volume was ¥1,281 billion and ranked number 8 as of March 1997 (See Table 6). Taiyo was specialized in family market and their lineup of products and business model was different from other traditional mutual com-panies. They sold their savings type life insurance with the term of 5 to 10 years by a combination of two sales persons visiting a family. Taiyo’s financial condition was stable with surplus of ¥15.6 billion and solvency margin ratio of 873% as of March 1998. They reached an agree-ment with Daido to form a business alliance in 1999
Table 15. Data of Management Efficiency in Yamato
Data 2000 2001 2002 2003 2004 2005 2006 2007 [1] 39 30 44 48 39 34 33 35 [2] 3.64 2.32 3.22 4.14 4.48 6.17 4.16 2.10 [3] 21.2 53.7 24.6 22.1 21.6 23.3 25.4 27.4 [4] 20.7 44.2 18.1 18.0 14.3 12.5 12.0 12.5 [5] 13.3 77.2 15.7 12.6 10.5 11.8 14.6 12.7 [6] 0.8 0.001 (-)0.5 0.4 0.1 1.5 2.8 3.5
[7] N/A N/A N/A 489.7 523.5 740.7 836.2 555.4
Source: Seimei-Hoken Tokei Go (Statistics of Life Insurance Business in Japan) for respective years.
aiming to establish a holding company together in the near future (see Table 16).
[1] Premium (billion yen)
The amount of premium shrank from 2003 to 2004 and from 2007 to 2009. It differs from the case of Daido where it dwindled to less than half. However it is evident that the demutualization did not help growing the company. Likewise the ratio of new business slightly decreased after the demutualization.
[2] Return on Assets (%)
The ROA has been relatively high throughout the years before and after the demutualization. But it is not the case that the years after demutualiza-tion are higher than before it.
[3] Expense Ratio (%)
The expense ratio is higher in the years after demutualization. So the demutualization did not work well for efficiency as far as the expense cost is concerned.
[4] Cancellation Ratio (%)
It is conspicuous that the ratio of cancellation is especially high in 2003.
[5] New Business Ratio (%)
The ratio of new business was higher than that in 2003. However it is not likely that the policyhold-ers made any particular reaction to the demutual-ization.
[6] Surplus (billion yen)
The amount of surplus is generally the similar level before and after the demutualization.
[7] Solvency Margin Ratio (%)
The solvency ratio was 681.5% in 2002 but it exceeded 1000 % from 2005 through 2007 and in 2009.
4) Mitsui Life
Mitsui Life was demutualized in April 1, 2004. Mitsui was one of the top 7 traditional insurers in Japan (see Table 6). Mitsui was struggling for rather weak sales channels and financial bases in 1990s and 2000s. Their solvency margin ratio went down to 491.8% as of March 1998. While banks and non-life insurers belonging to Mitsui and Sumitomo groups merged, Mitsui Life could not merge with Sumitomo Life, because it was a pre-requisition for such merger to re-strengthen their financial bases. Mitsui chose to demutualize so as to solidify their financial bases and improve profitability (see Table 17).
[1] Premium (billion yen)
The amount of premium significantly decreased year by year to the level of half of the previous years. The ratio of new business also gradually deteriorated from 5.9% of 2000 to 3.7% of 2011. The demutualization was not effective in expedit-ing the growth.
[2] Return on Assets (%)
The ROA was 1.86% in 2000 and 1.86% in 2011. The years subsequent the 2004 were generally better than the preceding years from 2001 through 2003.
[3] Expense Ratio (%)
The ratios of expense in the subsequent years were similar to those of preceding years while they deteriorated in 2008 through 2011. The aver-age of the former 4 years is 15.4% and the averaver-age of the latter 8 years is 15.2%.
[4] Cancellation Ratio (%)
The ratios of cancellation improved after the demutualization with the average of the preced-ing 4 years bepreced-ing 12.1% and the average of the subsequent 8 years being 8.2%.
Table 16. Data of Management Efficiency and Solvency: Taiyo
Data 2000 2001 2002 2003 2004 2005 2006 2007 2008 2009 2010 2011 [1] 1,097 1,019 887 794 788 965 813 635 596 640 717 903 [2] 2.52 2.48 1.31 2.15 1.89 2.33 2.31 2.56 (-)0.14 2.11 2.25 2.25 [3] 7.5 8.3 9.7 10.8 10.5 10.0 11.2 12.1 13.4 11.6 11.2 9.2 [4] 8.5 9.1 10.9 17.8 11.2 12.0 10.4 9.3 8.8 8.0 7.6 7.6 [5] 14.5 20.6 20.5 20.5 19.6 18.3 11.4 8.0 9.3 9.5 10.7 9.5 [6] 37.7 136.5 127.1 106.8 108.9 113.8 123.3 128.8 130.1 132.8 137.6 141.7 [7] N/A 768.8 681.5 863.3 865.7 1045.2 1100.4 1000.6 866.4 1023.8 670.8 747.3
Source: Seimei-Hoken Tokei Go (Statistics of Life Insurance Business in Japan) for respective years.
[5] New Business Ratio (%)
The ratio of new business is lower for the follow-ing years than the precedfollow-ing years (the average of preceding years is 5.9% as against 3.1% of the following years).
[6] Surplus (billion yen)
The amount of surplus considerably grew only for 3 years after the demutualization with the average of preceding 4 years being ¥50.5 billion and the average of following three years being ¥170.0 bil-lion. However it worsened to ¥22.5 billion in 2008 and ¥27.1 billion in 2009.
[7] Solvency Margin Ratio (%)
Likewise the solvency margin ratio slightly improved only for several years.
5) Dai-ichi Life
Daiichi Life, the oldest mutual company and the second largest life insurance company in Japan was demutual-ized in April 1, 2010. This is the largest IPO in the histo-ry of the Tokyo stock exchange market. The number of stocks issued was 10 million. The total value of them was ¥1.4 trillion. This is the largest stock company in Japan in terms of number of the shareholders. There are 8.21 million policyholders out of which 7.38 million is entitled to receive their share of the assets either by stock or cash with the remaining 0.83 million receiving no share. Some 1.2 million to 1.3 million policyholders were to choose receiving stocks in the amount of ¥40 billion and 6 million policyholders would receive cash in the total amount of ¥1 trillion. The number of the shareholders has turned out to be 1.37million.
The offered price of IPO was ¥140,000 and first market price was ¥160,000. As of April 30, the price was ¥160,500 with only five days when the price was below
¥160,000 in the first 20 days (Nihon Keizai Shimbun, May 1, 2010). The price has never gone down below ¥140,000 which might be some evidence of the demutu-alization being well received in the stock market. Whether or not there was expropriation or change of wealth is a subject of future study.7)
It is rare that the mutual company having over 8 million policyholders is converted into a stock company not just in Japan but also in the world.8) For instance, the
number of policyholders was 2.3 million in case of Standard Life, over 2 million in case of Friends Provi-dent, 750,000 in case of Scottish Provident and 600,000 in case of Equitable in U.K. (Tsuru 2000: 108-112). When Daido, Taiyo, and Mitsui were demutualized, the number of policyholders was 930,000, 3.82 million and 2.62 million respectively (Shukan Kinyu Zaisei Jijo, April 7, 2008, p.13).
This is an epoch-making event in the history of life insurance industry in Japan because 4 largest life insur-ers in Japan were all mutual companies making it diffi-cult to compare efficiency etc. between mutual and stock ownership on equal footing. This study was partly motivated by the fact that we now have large stock insurer as well as mutual insurers. At that time, Nippon was sure that they would continue to be a mutual com-pany while Meiji Yasuda and Sumitomo were closely monitoring the development and studying the issues. Now that 3 years have passed, this paper examined any effects of demutualization chronologically and compara-tively based on the data of management efficiency of both Dai-ichi and Nippon as benchmark data (see Table 18).
[1] Premium (billion yen)
The average amount of premium from 2004 through 2009 was ¥3,177 billion and the amount
Table 17. Data of Management Efficiency and Solvency: Mitsui
Data 2000 2001 2002 2003 2004 2005 2006 2007 2008 2009 2010 2011 [1] 1,286 1034 953 920 899 965 813 800 744 640 657 582 [2] 1.86 (-)0.13 0.37 0.99 1.56 2.19 1.93 1.82 (-)1.55 1.50 1.95 1.86 [3] 13.3 16.8 14.1 13.3 12.0 11.8 14.0 15.0 16.4 18.1 16.7 17.5 [4] 11.1 13.8 12.0 11.6 9.2 8.8 8.2 7.8 8.2 8.4 7.4 7.4 [5] 5.9 5.8 6.4 5.3 4.4 3.1 2.7 2.5 2.8 3.0 3.7 3.7 [6] 62.8 60.1 42.4 36.5 43.4 122.2 198.2 180.5 22.5 27.1 40.9 55.9 [7] N/A 510.7 410.4 654.6 663.9 744.3 906.6 696.1 602.0 702.1 425.8 486.7
Source: Seimei-Hoken Tokei Go (Statistics of Life Insurance Business in Japan) for respective years.
for 2010 and 2011 was ¥3,056 billion making it 96.2% of the preceding years. For the same peri-od, the amount of Nippon was ¥4,878 billion, and ¥4,896 billion for 2010 and ¥5,368 billion for 2011 with the average being ¥5132 billion after demu-tualization which is 105.2%. Thus demudemu-tualization did not contribute to the growth of the company at all.
[2] Return on Assets (%)
Although there were the years Dai-ichi achieved the ratio comparable to Nippon (2005, 2006, 2007), the ratio for 2010 and 2011 were inferior to those of Nippon (1.78 and 1.99 versus 2.23 and 2.15). This tells us that demutualization did not very well contribute to improvement of ROA. [3] Expense Ratio (%)
What is conspicuous here is that the ratio for 2006 and 2007 are fairly high and that the ratio of 2010 and 2011 recovered to the level of 2004. However the ratio for the following years has not been so good as the ones of Nippon. It appears that the demutualization did not help improve the expense ratio.
[4] Cancellation Ratio (%)
The ratio has been lowering year by year slightly but no significant difference between Dai-ichi and
Nippon. This is the data which contradict the the-ory that the ratio might be worsened by demutu-alization.
[5] Ratio of new business
The ratio has slightly increased being comparable or a little better than Nippon.
[6] Surplus
The amount of surplus dramatically increased after the demutualization and it is better than Nip-pon.
[7] Solvency Ratio (%)
The ratio has become the level of half for the fol-lowing years but this is due to the change of regu-lation and it is better than Nippon.
5. Conclusion
The major findings brought by the above analysis are summarized as follows (see Table 19).
[1] Premium
All four companies experienced decrease of pre-mium after the demutualization with the decrease of two companies being very significant percent-age. This suggests that the demutualization did not contribute to the growth of the company. Between 2001 and 2011, the premium income of
Table 18. Data of Management Efficiency and Solvency: Dai-ichi and Nippon
Data 2004 2005 2006 2007 2008 2009 2010 2011 [1] Dai-ichi 3,530 3,400 3,293 3,098 2,904 2,837 3,056 3,056 Nippon 4,829 4,842 4,854 4,889 5,036 4,817 4,896 5,368 [2] Dai-ichi 1.95 2.11 2.40 2.4 0.22 2.17 1.78 1.99 Nippon 2.42 2.37 2.41 2.45 0.80 2.36 2.23 2.15 [3] Dai-ichi 12.1 12.3 13.2 14.3 15.3 15.5 13.9 13.9 Nippon 11.3 11.1 11.3 11.3 11.2 11.9 11.7 10.7 [4] Dai-ichi 9.0 8.3 8.0 7.2 6.9 6.9 5.7 6.0 Nippon 9.1 8.6 8.3 7.7 7.4 7.2 6.6 6.4 [5] Dai-ichi 5.8 5.7 4.9 4.3 4.3 4.3 4.6 4.5 Nippon 5.9 5.5 4.4 3.3 3.6 3.9 4.0 4.4 [6] Dai-ichi 221.0 253.3 265.8 269.9 309.6 184.4 403.0 416.9 Nippon 314.4 350.1 408.1 395.7 300.5 369.4 346.4 342.2 [7] Dai-ichi 891.6 1095.5 1161.8 1016.6 768.1 953.5 547.7 575.9 Nippon 975.2 1257.9 1324.9 1156.8 904.4 1006.0 529.1 567.0
Source: Seimei-Hoken Tokei Go (Statistics of Life Insurance Business in Japan) for respective years.
all life insurers increased from ¥26,185, 887 mil-lion to ¥29,122,312 milmil-lion (see Table 20).
[2] ROA
The ROA ratio was almost similar before and after the demutualization on all four companies. There was no apparent effect on performance and profitability of the company as a result of demutualization.
[3] Expense Ratio
In the two of the five companies, the expense ratio has deteriorated with the remaining three companies having not much difference. This means the demutualization did not improve effi-ciency of the company.
[4] Cancellation Ratio
A development of cancellation ratio is mixed among the companies with one having experi-enced improvement and one having experiexperi-enced setback.
[5] New Business Ratio
The ratio of new business is on the same level for three to four years before demutualization and two years of the following years.
[6] Surplus
What showed remarkable change is the amount
of surplus. The amount of surplus dramatically increased in two companies with one company having increase for short period and decrease for long period and with another company posing no change.
[7] Solvency Ratio
Most of the companies achieved improvement of solvency ratio after the demutualization.
As stated above, the demutualization brought adverse effects on growth, efficiency (expense ratio), and development of new business. With regards to ROA, the effects are neutral on all four companies except for Yamato. It could be said that the high ROA of Yamato was a result of the demutualization but that because of the same reason it went bankruptcy. Yamato was a small company and the situation surrounding the demutualization was unique and different from other companies. The demutualization showed a rather favorable effect on the ratio of cancellation which is inconsistent with the theor y that demutualization should not be well taken by policyholders. It definitely contributed to the improvement on surplus and solven-cy. This is a big picture of the five companies demutual-ized.
However if you take a look at each company
individu-Table 19. Scorecard by Index and Company
Company
Index Daido Yamato Taiyo Mitsui Dai-ichi
[1] Growth (-) (-) (0) (-) (-) (-) (-) [2] ROA (0) (+) (0) (0) (0) [3] Expense Ratio (-) (-) (-) (0) (0) [4] Cancellation (0) (+) (-) (+) (+) [5] New Business (-) (0) (0) (-) (0) [6] Surplus (+) (+) (+) (0) (+)a) & (-)b) (+) (+) [7] Solvency (+) N / A (+) (+) (+)
Source: Prepared by the author.
Notes: (-) means decrease or aggravation. (-) (-) means significant decrease or aggravation. (0) means no change or similar level. (+) means increase or improvement. (+)(+) means significant increase or improvement. a) short period. b) long period
Table 20. Premium Growth of All Life Insurers
(unit: million yen)
Year Company Premium Income Policies in Force Total Assets
2001 40 ¥26,185,887 ¥1,664,615,643 ¥184,370,910
2011 42 ¥29,122,312 ¥1,212,633,811 ¥233,264,185
ally, you will come across another picture. Five life insurers are very much different each other in terms of size and circumstances under which the demutualiza-tion was made. Daido and Taiyo merged after the demutualization. That is to say, merger of the both com-panies creating the holding company was their purpos-es of demutualization. In that sense the demutualization was successful. The purpose of Yamato was also merger with Taisho. However it went bankruptcy after the demutualization. It appears that Mitsui who was suffer-ing from poor performance demutualized for defensive purposes. Because they avoided bankruptcy and has survived to date by obtaining capital from the compa-nies belonging to the Mitsui-Sumitomo group, demutu-alization turned out to be favorable to them. The largest shareholder of Mitsui is the Mitsui Sumitomo Bank and has received the directors and officers from the bank and Sumitomo Life. Although it was demutualized, it is an unlisted company. On the contrary, Dai-ichi did not seem to have so specific reasons as other companies than more general purposes of strategy, corporate cul-ture etc. In this connection, it is very interesting how Dai-ichi will change in comparison to the remaining large mutual companies in the long run.
As the reason and purposes for demutualization are diverse, any nature and extent of effects as a result of demutualization might likewise different according to the companies. Under the circumstances, it can be con-cluded that although the demutualization might have served for very specific purposes of each insurer, it did not directly influence or improve its efficiency of the company and that you cannot say that stock company is more advantageous than mutual company in enhancing its value. It was once considered that the tion of Dai-ichi might be a pivotal event for demutualiza-tion in Japan (Sugino 2011). However as long as Dai-ichi or other demutualized companies did not prove themselves that they improved growth, efficiency, prof-itability etc. thanks to demutualization, the rest of tradi-tional mutual companies will have no reason to go through the labor and expenses of demutualization except that they have some special reason to do that, which is generally compatible with the majority of opin-ions in the preceding studies.
This is the paper presented at the 17th Asia-Pacific Risk and Insurance Association annual conference held in New York during July 28 through 31, 2013.
Notes
1) There were two Property and Casualty insurers in Japan
but one was demutualized and another went bankruptcy in 2000. The former is Kyoei Mutual Fire and Marine Insurance Company which had become mutual company in 1946 and went back to stock ownership in 2003.
2) If the Japan Post Life Insurance Co. Ltd. with the premium of ¥6,856,486 million is included, the proportion of mutual companies is 39.6%.
3) One example of the defensive reason is “sponsored demu-tualization” which means demutualization to receive capi-tal assistance from a sponsor (a company merging and acquiring the mutual company).
4) Nissan, Toho, Daihyaku, Chiyoda, and Tokyo were mutual companies with Taisho and Kyoei being stock companies. 5) The major change of the Commercial Code was made in
1993 and 2002 introducing outside auditors system and governance by three commissions system etc. respective-ly.
6) In the US, prominence of mutual companies in the insur-ance industry is one of the most interesting and least understood problems for the student of industrial organi-zation, since mutuals account for almost half of all life insurance in force and one quarter of all property and lia-bility insurance (Hansmann 1985:125). What is in the center of many diversified discussions is the agency theo-ry. The seminal paper on the agency theory is Michael C. Jensen and William H. Meckling, “Theory of the Firm: Managerial Behavior, Agency Costs, and Ownership Structure,”Journal of Financial Economics, 3: 305–60 (October 1976) and the pioneers who applied the agency theory to insurance industry are David Mayers and Clif-ford W. Smith (Birkmaier and Laster 1999: 7).
7) There is a great amount of literature on pricing of IPOs which shows some evidence of prevalent underpricing (Viswanathan 2006: 442).
8) The only exceptions were Metropolitan and Prudential, both of which the number of policyholders was 11 million. References
Birkmaier, U. and D, Laster (1999) “Are mutual insurers an endangered species?” Sigma, No. 4, Swiss Re.
Boose, M. A. (1990) “Agency Theory and Alternative Predic-tions for Life Insurers: An Empirical Test,” The Journal of Risk and Insurance, 57: 499–518.
Butler, R. J., Y. Cui, and A. Whitman (2000) “Insurers’ Demu-tualization Decisions,” Risk Management and Insurance Review, 2: 135-54.
Chano, T. (2001) “The Perspective of the Corporate Govern-ance in the Japanese Life InsurGovern-ance Companies,” JILI Journal, 136: 129–88.
Cummins, D. J., M. Rubio-Misas, and H. Zi (2004) “The Effect of Organizational Structure on Efficiency: Evidence from the Spanish Insurance Industry,” Journal of Banking and Finance, 28: 3110–50.
Cummins, D. J., M. A. Weiss, and H. Zi (1999) “Organizational Form and Efficiency: The Coexistence of Stock and Mutu-al Property-Liability Insurers,” Management Science 45, 1254–69.
Doherty, N. A. and G. Dionne (1993) Insurance with Undiver-sifiable Risk: Contract Structure and Organizational Form of Insurance Firms, Journal of Risk and Uncertainty, 6: 187–203.
Erhemjamts, O. and J. T. Leverty (2010) “The Demise of the Mutual Organizational Form: An Investigation of the Life Insurance Industry,” Journal of Money, Credit and Bank-ing, 42: 1011–36.
Fama, E. F. and M.C. Jensen (1983) “Separation of Ownership and Control,” The Journal of Law and Economics, 26: 301– 25.
Green, M.R. and R. F. Johnson (1980) “Stocks versus Mutuals: Who Controls?” Journal of Risk and Insurance, 47: 165–74. Hansmann, H. (1985) “The Organization of Insurance
Compa-nies: Mutual versus Stock,” Journal of Law, Economics, and Organization, 1: 125–53.
He, E. and D. W. Sommer (2010) “Separation of ownership and control: Implicaion for Board Composition,” Journal of Risk and Insurance, 77: 265–95.
Hetherington, J. A. C. (1969) “Fact v. Fiction: Who Owns Mutual Insurance Companies?” Wisconsin Law Review, 4: 1068–103.
Hisamatsu, T. (2006) “Trends of Corporate Governance of The U.K. Mutual Life Insurance Companies,” Journal of Life Insurance Management (Seimeihoken Keiei), 74: 55–72.
Iguchi, T. (2000) “Mutual Life Insurance Company and Its Corporate Governance,” Bunken Journal, 133: 1–22. Iwasaki, R. (1989) “Introduction to Panel Discussion on the
Problems of the Mutual Insurance Company,“ Journal of Insurance Science, 527: 1–6.
Iwase, D. (2009) Seimeihoken No Karakuri, Bungei Shunju. Jeng, V. and G. C. Lai (2005) “Ownership Structure, Agency
Costs, Specialization, and Efficiency: Analysis of Keiretsu and Independent Insurers in the Japanese Nonlife Insur-ance Industry, ” The Journal of Risk and InsurInsur-ance, 72: 105–58.
Jeng, V., G. C. Lai, and M. J. McNamara (2007) “Efficiency and Demutualization: Evidence from the U. S. Life Insur-ance Industry in the 1980s and 1990s,” The Journal of Risk and Insurance, 74: 683–711.
Jensen, M. C. and W. H. Meckling (1976) “Theory of the Firm: Managerial Behavior, Agency Costs and Ownership Structure,” Journal of Financial Economics, 3: 305–60. Kim, W-J., D. Mayers, and C. W. Smith, Jr. (1996) “On the
Choice of Insurance Distribution Systems,” The Journal of Risk and Insurance, 63: 207–27.
Kofuji, Y. (2010a) “Organizational Structure and Risk Taking of Life Insurance Industry in Japan: On the Another Inter-pretation of Yanase, Asai, and Lai (2008),” Senshu Business Review, 5: 1–8.
Kofuji, Y. (2010b) “Bankruptcy of Yamato Life Insurance Company and Demutualization of Life Insurance,” JILI Journal, 172: 1–24.
Lamm-Tennant, J. and L. T. Starks (1993) “Stock versus Mutu-al Ownership Structures: The Risk Implications,” The Journal of Business, 66: 29–46.
Laux, C. and A. Muermann (2006) “Mutual versus Stock Insurers: Fair Premium, Capital, and Solvency,” CFS Working Paper Series.
Lee, S-J., D. Mayers, C. W. Smith (1997) “Guaranty Funds and
Risk-Taking Evidence from the Insurance Industry,” Jour-nal of Financial Economics, 44: 3–24.
MacMinn, R. and Y. Ren (2010) “Mutual versus stock Insur-ers: A Synthesis of Theory and Empirical Work,” unpub-lished paper.
Maeda, M. (1995) “Reason for Existence of Mutual Insurance Companies and Fundamental Attributes Thereof,” Bunken Journal, 111: 118–31.
Mayers, D., A. Shivdasani, and C. W. Smith, Jr. (1993) “Board Composition in the life Insurance Industry,” Simon Work-ing Papers- Historical.
Mayers, D. and C. W. Smith, Jr. (1981) “Contractual Provi-sions, Organizational Structure, and Conflict Control in Insurance Markets, The Journal of Business, 54: 407–34. Mayers, D. and C. W. Smith, Jr. (1986) “Ownership Structure
and Control: The Mutualisation of Stock Life Insurance Companies,” Journal of Financial Economics, 16: 73–98. Mayers, D. and C. W. Smith, Jr. (1988) “Ownership Structure
across Lines of Property-Casualty Insurance,” The Journal of Law and Economics, 31: 351–78.
Mayers, D. and C. W. Smith, Jr. (1990) “On the Corporate Demand for Reinsurance: Evidence from the Insurance Market,” The Journal of Business, 63: 19–40.
Mayers, D. and C. W. Smith, Jr. (1992) “Executive Compensa-tion in the Life Insurance Industry,” The Journal of Busi-ness, 65: 51–74.
Mayers, D. and C. W. Smith, Jr. (1994) “Managerial Discre-tion, RegulaDiscre-tion, and Stock Insurer Ownership Structure,” The Journal of Risk and Insurance, 61: 638–55.
Mayers, D. and C. W. Smith, Jr. (2002) “Ownership Structure and Control: Property-Casualty Insurer Conversion to Stock Charter,” Journal of Financial Services Research, 21: 117–44.
Mayers, D. and C. W. Smith (2004) “Incentives for Managing Accounting Information : Property-Liability Insurer Stock-Charter Conversions,” The Journal of Risk and Insurance, 71: 213–51.
McNamara, M. J. and S. G. Rhee (1992) “Ownership Struc-ture and Performance: The Demutualization of Life Insur-ers,” The Journal of Risk and Insurance, 59: 221–38. Merton, R. C. (1974) “On the Pricing of Corporate Debt: The
Risk Structure of Interest Rates, The Journal of Finance, 29: 449–70.
Merton, R. C. (1977) “An Application of Modern Option Pric-ing Theory, Journal of BankPric-ing and Finance, 1: 3–11. Mizushima, K. (1989) “A Critical Observation on the
Charac-ter of Mutual Company,” Journal of Insurance Science, 527: 27–42.
Mizushima, K. (1992) “Historical Change of the Mutualism in the Insurance System,” The Kokumin-Keizai Zassi (Journal of Economics & Business Administration), 165 (5): 1–18. Mizushima, K. (2001) “Does the Idea of Mutualism Draw to
an End?” Bunken Journal, 134 (1): 5–23.
Okamura, K. (2006) “Seimeihoken-Sogokaisha niokeru Shinkateki Corporate Governance nitsuite (Progressive Corporate Governance in Mutual Life Insurance Compa-ny,” Hoken-Shinka to Hoken-Jigyo (Insurance Progress and Insurance Enterprise), Keio-Gijuku Shuppankai, 197–232. Ono, R. (2004) “Demutualization of Life Insurance Companies
in the United States,” JILI Journal, 149: 89–159.