Are global value chains truly global? a new perspective based on the measure of trade in value‑added
著者 Meng Bo, Xiao Hao, Ye Jiabai, Li Shantong
権利 Copyrights 日本貿易振興機構(ジェトロ)アジア
経済研究所 / Institute of Developing
Economies, Japan External Trade Organization (IDE‑JETRO) http://www.ide.go.jp
journal or
publication title
IDE Discussion Paper
volume 736
year 2019‑02
URL http://hdl.handle.net/2344/00050698
INSTITUTE OF DEVELOPING ECONOMIES
IDE Discussion Papers are preliminary materials circulated to stimulate discussions and critical comments
Keywords:
global value chains, network, trade in value-added, input-output modelJEL classification: F6, F13, F15, D57
1: IDE-JETRO, Japan; Columbia Business School, USA ([email protected]; [email protected]);
2: Hunan University, China; 3: Development Research Center of the State Council, China.
IDE DISCUSSION PAPER No. 736
Are global value chains truly global?
A new perspective based on the measure of trade in value-added
Bo Meng
1, Hao Xiao
2, Jiabai Ye
2, and Shantong Li
3January 2019
Abstract:
Are global value chains (GVCs) truly global or are they more of a regional phenomenon? Opinions concerning this issue are widely divergent in the literature. This paper provides new perspectives on GVCs using network analysis based on the concept of trade in value-added. By using a multiregional input-output model, we first show that GVC activities can be consistently identified at the country, sector, and bilateral levels according to the number of times that factor contents cross national borders in global production sharing. This allows us to group trade-related, value-added creation activities into three networks, including traditional trade, simple GVC trade, and complex GVC trade networks. Further, we use network analysis tools based on the Asian Development Bank’s Multiregional Input-Output Tables covering 62 economies and 35 sectors between 2000 and 2017 to investigate changes in the topology and structure of different types of GVC networks. Our results show that the characteristics of GVCs largely depend on the viewpoint of the participating country (as a supplier or demander), the type of trade, and the aggregate level of trade in the corresponding networks.The Institute of Developing Economies (IDE) is a semigovernmental, nonpartisan, nonprofit research institute, founded in 1958. The Institute merged with the Japan External Trade Organization (JETRO) on July 1, 1998.
The Institute conducts basic and comprehensive studies on economic and related affairs in all developing countries and regions, including Asia, the Middle East, Africa, Latin America, Oceania, and Eastern Europe.
The views expressed in this publication are those of the author(s). Publication does not imply endorsement by the Institute of Developing Economies of any of the views expressed within.
INSTITUTE OF DEVELOPING ECONOMIES (IDE), JETRO 3-2-2, WAKABA,MIHAMA-KU,CHIBA-SHI
CHIBA 261-8545, JAPAN
©2019 by Institute of Developing Economies, JETRO
No part of this publication may be reproduced without the prior permission of the IDE- JETRO.
1
Are global value chains truly global ?
A new perspective based on the measure of trade in value-added*
Bo Meng1, Hao Xiao2, Jiabai Ye2, Shantong Li3
Abstract
Are global value chains (GVCs) truly global or are they more of a regional phenomenon? Opinions concerning this issue are widely divergent in the literature. This paper provides new perspectives on GVCs using network analysis based on the concept of trade in value-added. By using a multiregional input-output model, we first show that GVC activities can be consistently identified at the country, sector, and bilateral levels according to the number of times that factor contents cross national borders in global production sharing. This allows us to group trade-related, value-added creation activities into three networks, including traditional trade, simple GVC trade, and complex GVC trade networks. Further, we use network analysis tools based on the Asian Development Bank’s Multiregional Input-Output Tables covering 62 economies and 35 sectors between 2000 and 2017 to investigate changes in the topology and structure of different types of GVC networks. Our results show that the characteristics of GVCs largely depend on the viewpoint of the participating country (as a supplier or demander), the type of trade, and the aggregate level of trade in the corresponding networks.
Keywords: global value chains, network, trade in value-added, production sharing, international trade, input-output model
*We would like to thank Prof. Zhi Wang (George Mason Univ.) and Mr. Nadim Ahmad (OECD) for their helpful comments, ADB MRIO Team for providing us the input-output database. This research is partly supported by the IDE-JETRO’s international joint project “The Role of Technological Innovation in Global Value Chains” (2019) which is in collaboration with the World Trade Organization, the World Bank Group, the Organization for Economic Co-operation and Development, the Global Value Chains Research Center, and the China Development Research Foundation.
2 1. Introduction
The increasing presence of global value chains (GVCs) is considered by many to be one of the most important developments in 21st century international trade (Baldwin, 2012). While people may use different terms in trade economics literature such as fragmentation of production (Jones and Kierzkowski, 1990), offshore sourcing (Arndt, 1997), external orientation (Campa and Goldberg, 1997), disintegration of production (Feenstra, 1998), global production sharing (Yeats, 2001), vertical specialization (Hummels et al., 2001; Yi, 2003), outsourcing (Grossman and Helpman, 2002a,b), vertical production networks (Hanson et al., 2003), and trade in tasks (Grossman and Rossi-Hansberg, 2008) to explain GVCs, they all point to the same fact: goods are now produced “in a number of stages in a number of locations, adding a little bit of value at each stage” (Krugman, 1995). As a result of this development of GVCs in recent years, the typical ‘Made in’ labels on manufactured goods have become archaic symbols of an older era. Nowadays, most goods are “Made in the World” (WTO-IDE, 2011). According to a recent report by UNCTAD (2013), “80% of trade takes place in ‘value chains’ linked to transnational corporations.” Furthermore, Degain et al. (2017) show that about 13% of global GDP was generated through GVC production activities in 2014, up from 9.5% in 1995.
Given the increasing complexity and sophistication of global trade, there is an interesting debate: Do GVCs truly function as a global system or are they more regional? This issue is crucial to better understand the impacts on the world economy of both the two primary directions of trade liberalization (regional vs. multilateral trade) and the evolution of economic interdependence across countries over time. Concerning this issue, there are two different views in the recent international trade literature. On one hand, Los et al. (2015) found that a transition from regional production networks to the “Factory World” has appeared in almost all production chains during the period of 1995 to 2011. On the other hand, Baldwin and Lopez-Gonzales (2013) state more boldly that “supply chain trade is not global – it’s regional” and “the global production network is marked by regional blocs, which could be called Factory Asia, Factory North America, and Factory Europe.” Estevadeordal et al. (2013) also mentioned that “the regional bias stems from high transport and logistics costs that discourage value chains spanning long distances, and from trade policies—first and foremost preferential trading arrangements (PTAs), which have often been formed among neighboring countries.” However, none of these prior analyses clearly identify (1) which types of trade should belong to GVC activities, which is crucial to understand the characteristics of GVCs, (2) how the views of GVCs differ between suppliers and demanders, and (3) how the detailed topology of trade changes in GVCs networks. To provide an alternative view on this issue, this paper uses network analysis to show the topology and structural changes in GVC activities and international trade between 2000 and 2017.
Network analyses have been widely used to visually simplify and conceptualize GVC activities (see Ferrarini, 2013; Ferrantino and Taglioni, 2014; Zhou, 2016; Xiao et al., 2017). Unlike the literature on international trade and GVC-related network analyses, we separate the bilateral trade flow of value- added across countries into three kinds of networks (traditional trade networks, simple GVC trade
3 networks, and complex GVC trade networks) in terms of the number of times that factor content crosses national borders. This idea is from Wang et al. (2017), who provide a decomposition method to divide a country/sector’s GDP into different production activities. However, the definition of bilateral relations between countries used by Wang et al. (2017) is based on the real direction of international trade flows, rather than the flows of the so-called “trade in value-added” (TiVA; Johnson and Noguera, 2012) for complex GVC activities. In order to show the origin of value-added creation, and the destination of value- added absorption associated with international trade in our networks, we provide an alternative decomposition method. At the country/sector aggregate level, our method shows the same results as Wang et al. (2017), but at the bilateral level, the results differ.
Using the Asian Development Bank (ADB)’s Multiregional Input-Output (MRIO) tables, our network analysis covers 62 countries and 35 sectors from 2000 to 2017. When looking at the results for all networks at both the aggregate and individual sector levels, we found that the topology and structure of networks changed very gradually over time. Even for the comparison of network structures before and after the Financial Crisis of 2008, there was not a significant or immediately recognizable network topology change. This likely implies that the structure of global production networks expressed by the topology of country-to-country relationships is resilient even when great economic shocks affect global trade. Therefore, we focus our analysis on the years 2000 (prior to the year of China’s accession to the WTO) and 2017 (the most recent year for which the MRIO table is available) as our comparison targets for analyzing long-term structural changes1. In addition to showing the networks of the aggregate economy (all goods and all services), we also analyze certain sectors (textiles, information and communications technology, and services) as industry-specific examples.
2. Which types of production and trade activities belong to global value chains?
The method for identifying GVC activities using a multiregional input-output model is rooted in the work of Leontief (1936), who demonstrated that the complex linkages among different industries across countries can be expressed as various inter-industry, cross-country transactions organized into chessboard-type matrices, known as input-output tables. Each column in the table represents the required inputs from other industries (including imports and direct value-added) to produce the given amount of the product represented by that column. After normalization, the technical coefficient table represents the amount and type of intermediate inputs needed in the production of one unit of gross output. Using these coefficients, the gross output in all stages of production needed to produce one unit of final products can be estimated via the Leontief inverse. When the outputs associated with a particular level of final demand are known, the total value-added throughout the (global) economy can be estimated by multiplying these output flows with the value-added rate (value-added per unit of gross
1 It should be noted, these types of plots are better for capturing long-run changes on the extensive margin rather than short-run changes occur on the intensive margin.
4 output) in each country/industry.
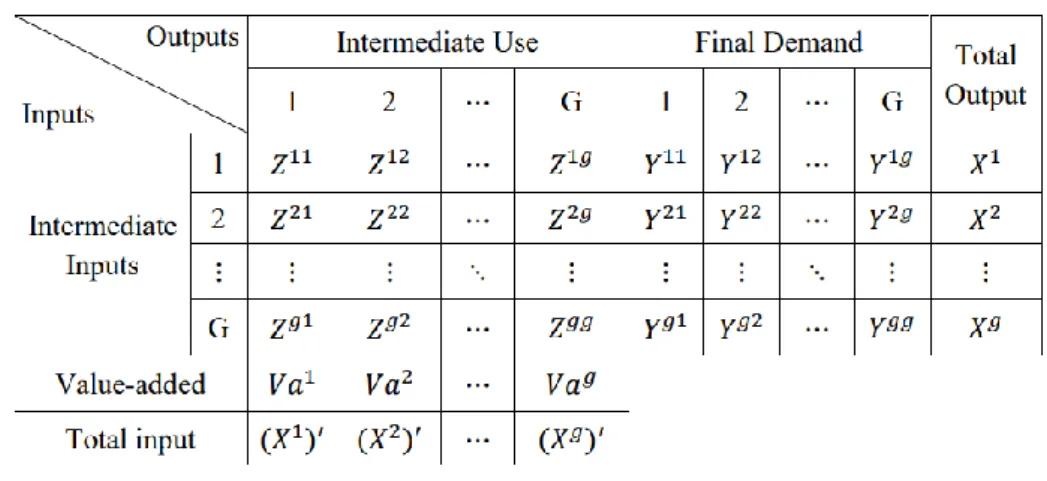
Without loss of generality and following the style of Wang et al. (2017) for easy comparison, let us consider a MRIO model for G countries and N sectors. The structure is described in Table 1.
Table 1. Layout of a conventional multiregional input-output table
Source: Wang et al. (2017)
In this example, Zsr is an N×N matrix of intermediate input flows that are produced in country s and used in country r; Ysr is an N×1 vector giving final products produced in country s and consumed in country r; Xs is also an N×1 vector giving gross outputs in country s; and Vas denotes an N×1 vector of direct value-added in country s. In this MRIO model, the input coefficient matrix can be defined as A = ZX̂−1, where X̂ denotes a diagonal matrix with the output vector X in its diagonal. The value-added coefficient vector can be defined as V = VaX̂−1. The gross output production and use balance, or the row balance condition, of the above MRIO table can be written as:
A ∙ X + Y = X. (1)
Rearranging Equation (1), we reach the classical Leontief (1936) equation
X = B ∙ Y, (2)
where B = (I − A)−1 is the well-known (global) Leontief inverse matrix representing the induced output by one unit of final demand through the whole global production network. Both sides of the above equation can also be expressed as the following matrix form:
[
X11 ⋯ X1G
⋮ ⋱ ⋮
XG1 ⋯ XGG
]
=[
B11 ⋯ B1G
⋮ ⋱ ⋮
BG1 ⋯ BGG
]
∙[
Y11 ⋯ Y1G
⋮ ⋱ ⋮
YG1 ⋯ YGG
]
, (3)5 where, Xsr is an N×1 vector representing the induced output of country s by the final demand of country r. This can be stated as
Xsr =
∑
Gt Bst∙ Ytr. (4)Thus, each country’s output vector can be rewritten as
Xs =
∑
GrXsr = Xss+∑
Gr≠sXsr.
(5)Multiplying both sides of Equation (3) with (I − A)−1, we get
[
I − A11 ⋯ −A1G
⋮ ⋱ ⋮
−AG1 ⋯ I − AGG
]
∙[
X11 ⋯ X1G
⋮ ⋱ ⋮
XG1 ⋯ XGG
]
=[
Y11 ⋯ Y1G
⋮ ⋱ ⋮
YG1 ⋯ YGG
]
. (6)Obviously, each element of the right-hand side of Equation (6) can be rewritten in the following form:
(
I − Ass)
∙ Xsr−∑
Gt≠sAst∙ Xtr = Ysr. (7)Multiplying both sides of Equation (7) with Lss= (I − Ass)−1, which represents the domestic Leontief inverse of country s (induced output of domestic products by one unit of final demand), we get:
Xsr = Lss∙
∑
t≠sG Ast∙ Xtr+ Lss∙ Ysr.
(8)Without loss of generality, when r = s in the above equation, we get the following:
Xss = Lss∙
∑
t≠sG Ast∙ Xts+ Lss∙ Yss.
(9) Using Equations (8) and (9), Equation (5) can be rewritten as:Xs= Xss+ ∑Gr≠sXsr
= (Lss∙ ∑Gt≠sAst∙ Xts+ Lss∙ Yss) + ∑Gr≠s(Lss∙ ∑Gt≠sAst∙ Xtr+ Lss∙ Ysr)
= Lss∙ Yss+ Lss∙ ∑r≠sG Ysr+ Lss∙ ∑Gt≠sAst∙ Xts+ Lss∙ ∑Gr≠s∑Gt≠sAst∙ Xtr (10) Using Equation (4), Equation (10) can be rewritten as:
Xs= Lss∙ Yss+ Lss∙ ∑Gr≠sYsr+ Lss∙ ∑Gt≠sAst∙ Xts+ Lss∙ ∑Gr≠s∑Gt≠sAst∙ Xtr
= Lss∙ Yss+ Lss∙ ∑r≠sG Ysr+ Lss∙ ∑Gt≠sAst∙∑ BGu tu∙ Yus+ Lss∙ ∑ ∑G Ast∙ ∑ BGu tu∙ Yur
G t≠s
r≠s
6
= Lss∙ Yss+ Lss∙ ∑Gr≠sYsr+ Lss∙ ∑Gr≠sAsr∙Lrr∙ Yrr+ Lss∙ ∑Gt≠sAst∙∑ BGu tu∙ Yus
+ Lss∙ (∑r≠sG ∑Gt≠sAst∙ ∑ BGu tu∙ Yur− ∑Gr≠sAsr∙ Lrr∙ Yrr) (11)
Multiplying both sides of Equation (11) with the value-added diagonal matrix and rearrange the results, we get
(Vas)′ = V̂s∙ Xs = V̂⏟ s∙ Lss∙ Yss
(1):V_D
+ V̂⏟ s∙ Lss∙ ∑Gr≠sYsr
(2):V_RT
+ V⏟ ̂s∙ Lss∙ ∑Gr≠sAsr∙ Lrr∙ Yrr
(3a):V_GVC_R
+ V⏟ ̂s∙ Lss∙ ∑Gr≠sAsr∙ ∑ BGu ru∙ Yus
(3b):V_GVC_D
+ V̂s∙ Lss∙ (∑ ∑G Ast∙ ∑ BGu tu∙ Yur
G t≠s
r≠s − ∑Gr≠sAsr∙Lrr∙ Yrr)
⏟
(3c):V_GVC_F
(12)
Clearly, a country’s domestic vaue-added can be decomposed into three types of production activities as shown below.
(1) Production of domestically produced and consumed value-added (V̂s∙ Lss∙ Yss). This is the domestic value-added used to satisfy domestic final demand that is not related to international trade, and no cross-country production sharing is involved. We label it as V_D for short. As an example, this type of activity could include value-added produced by China’s metal sector in the form of Chinese-made smartphones purchased by Chinese consumers.
(2) Production of domestic value-added embodied in final product exports (V̂s∙ Lss∙ ∑Gr≠sYsr).
This is the domestic value-added used to satisfy foreign final demand that does not involve any cross-country production activities. It crosses a national border for consumption, so it is very similar to the traditional “Ricardian” type trade, the “French wine in exchange for England cloth” to use the phrase from Borin and Mancini (2015). We label this as V_RT for short. As an example, this activity could include value-added by China’s metal sector that is embodied in Chinese-made smartphone exported to Japan and purchased by Japanese consumers.
(3) Production of domestic value-added embodied in exports of intermediate goods and services.
This category is the domestic value-added that relates to production activities outside the source country, and is the source country’s contribution to global production. We label this as V_GVC for short. It can be further split into three categories:
(3a) Domestic value-added absorbed by the trading partner country without further border crossing. Value-added of country s embodied in intermediate exports that are used by a trading partner to produce its domestic final products, which are then consumed in the direct importing country r. In this case, domestic value-added crosses a national border only once, with no indirect exports via third countries or re-export activities involved. We label this as V_GVC_R for short. As an example, this type of activity could include the value-added by China’s metal sector that is embodied in Chinese-made car
7 parts, which are then imported by Japan and used in Japan’s auto sector to produce cars that are purchased by Japanese consumers.
(3b) Returned (re-imported) domestic value-added that is absorbed domestically. The value- added of country s that is embodied in intermediate exports that are used by the importing country r to produce either intermediate (possibly via a third country in the production chain) or final goods and services that are ultimately shipped back to the source country s as imports and consumed there. In this case, production sharing via intermediate trade happens between home and foreign countries and results in two or more cross-border transactions. We denote this scenario as V_GVC_D. As an example, this case could include value-added by China’s metal sector that is embodied in Chinese-made car parts that are exported to South Korea to produce more complex car parts, which are used by Japan to produce cars, which are later imported by China and purchased by Chinese consumers. In this case, even if South Korea is substituted by Japan, or Japan by South Korea or China, the definition of (3b) still holds.
(3c) This category includes two parts as shown in Equation (12). The first part represents the value-added by country s that is induced by the final demand of country r for imports from a third country u. This implies that the value-added by country s needs to first be embodied in its intermediate products that are exported directly to country t (including country r), which will be further directly and indirectly used by country u (including country r) to produce final products for satisfying the final demand of country r. With the second part which equals to minus (3a), it is easy to see that (3c) represents the value-added of country s that is absorbed by country r via third countries (factor contents move across country borders at least twice). As an example, this case can include the situation where China (country s) exports metal products to Japan (country t), and then Japan uses these products to produce hard disks, which are imported by Mexico (country u) to produce smartphone for consumption by US consumers. In the above example, when Japan is replaced by Mexico or the US and Mexico is replaced by Japan or the US, but Japan and Mexico are not replaced by the US at the same time, the example still reflects the activities represented in category (3c) – namely, production sharing via intermediate trade happens between home and foreign countries with more than two cross-border transactions.
Following Wang et al. (2017), we use the term GVC-related trade henceforth to refer to domestic value-added in intermediate products that contribute to production activities outside the source country.
GVC-related trade can be further divided into simple and complex cross-country production sharing activities based on the number of border crossings of the source country’s domestic value-added. For category (3a), value-added in intermediate exports that cross borders only once represents relatively simple cross-country production sharing activities, while categories (3b) and (3c) measure domestic value-added that crosses national borders at least twice, representing relatively complex cross-country production sharing activities.
More importantly, it can be seen below that the decomposition of category (3c) in Wang et al.
(2017) equals ours but with a different form:
8 (Vas)′ = V̂s∙ Xs
= V̂⏟ s∙ Lss∙ Yss
(1):V_D
+ V̂⏟ s∙ Lss∙ ∑Gr≠sYsr
(2):V_RT
+ V⏟ ̂s∙ Lss∙ ∑Gr≠sAsr∙ Lrr∙ Yrr
(3a):V_GVC_R
+ V⏟ ̂s∙ Lss∙ ∑Gr≠sAsr∙ ∑ BGu ru∙ Yus
(3b):V_GVC_D
+ V⏟ ̂s∙ Lss∙ ∑Gr≠sAsr(∑ BGu ru∙ ∑t≠sG Yut− Lrr∙ Yrr)
(3c):V_GVC_F
. (13)2
This difference is due to no usage since every corresponding item in both Equations (12) and (13) is the same at the country/sector level. However, at the bilateral level, the terms for category (3c) in the different equations give very different economic explanations and different figures as well. By removing the summation for r in Equations (12), categories (2), (3a) and (3c) can be expressed bilaterally as the value-added of country s that is absorbed by a part of the final demand of country r. Thus, the sum of categories (2), (3a), and (3c) can be expressed bilaterally as the value-added of country s that is absorbed by the total final demand of country r. This is consistent with the definition of TiVA at the bilateral level proposed by Johnson and Negara (2012). It should be noted that the same transformation does not work for the (3c) term in Equation (13) when removing the summation for r. In other words, the category (3c) term in Equation (13) cannot be expressed at the bilateral level as TiVA (a kind of flow of value-added) from source country s to absorption country r. It is for this reason that we propose Equation (12) as a new decomposition for GVCs analysis in the paper.
3. Method for visualizing networks in GVC analysis
In order to simplify the identification of the hubs of various networks from the perspectives of importers and exporters separately, we provide two types of networks. The first uses a specific country as a supply hub if the majority of most countries’ value-added imports is from that country. The second uses a specific country as a demand hub if the majority of most countries’ value-added exports goes to that country. In our network figures, the size of the bubble represents the share of a country’s value-added exports or imports in the world total value-added exports or imports. The share of value-added flow between each trading partner in the world total value-added flow is represented by the thickness of the linkage. The arrow of the linkage shows the direction of the value-added flow. It should be noted that whether or not there is a linkage appearing in the trade patterns in the network figures depends on two standards. Taking the example of supply hub-related networks, we use the following criteria: (1) if country A takes the largest share of value-added imports from country B, there will be a linkage from A to B; or (2) if country A’s share of country B’s value-added imports is larger than 25%, there will be a
2 For the ease of explaining trade in value-added at the bilateral level, Eq. (13) is from Wang et al. (2017)’s previous version (Wang et al., 2016 Sep), which is consistent to Wang et al. (2017)’s current version expressed in the matrix form.
9 linkage from A to B. The first standard is the so-called “Top 1” threshold widely used in network analyses to identify the most important linkages. The second standard is used to adjust the density of the network and thus can avoid omitting other important linkages.
4. Empirical Results
4.1 Supply hubs of trade in value-added in various networks
4.1.1 Supply hubs of trade in value-added in various networks at the aggregate level
As shown in the upper-left part of Figure 1.1, in 2000 there were three large regional supply hubs in the traditional trade networks: the US, Germany, and Japan. The US is surrounded by the two NAFTA countries, Canada and Mexico; three large Asian countries, Japan, South Korea, and India; and two other large economies, Brazil and Australia. Japan can also be considered as a regional supply hub in the Asia-Pacific region, since Japan is the most important value-added supplier through final products trade for the US, China, South Korea, Chinese Taipei, Thailand, Singapore and many Asian countries.
Germany is the largest supply hub in the European area because the majority of value-added imports through final products for almost all European countries comes from Germany. When zooming in on the figure, we can also find several small regional hubs in Europe, including the UK, France, Italy, Spain, and Russia; similarly, for the Asia-Pacific region, China, South Korea, India, Thailand, and Singapore, which have more than two important linkages with other countries, are also smaller regional hubs.
Comparing the situation of 2000 with that of 2017 (the upper-right part of Figure 1.1), it seems there are no significant changes in the network topology in Europe and North America, but dramatic changes can be found for Asia. Specifically, during this time period, China took over Japan’s position and grew into a global supply hub of value-added exports through final products trade. China has not only important linkages with other hubs, such as the US and Germany, but it is also surrounded by both its Asian neighbors (Japan, South Korea, Chinese Taipei, and almost all other Asian countries) and other emerging countries (Russia, Brazil, India). When comparing the magnitude and direction of value- added flows across countries over time, we can see that the rise of China has brought remarkable changes to the Asia-Pacific region, but the three regional blocs concerning value-added creation through traditional trade, Factory Europe, Factory Asia, and Factory North America can still easily be identified.
On the other hand, compared to the situation in 2000, each bloc in 2017 connects directly through hub- to-hub linkages. In this sense, we can say that all traditional trade networks have become much more global.
The middle-left part of Figure 1.1 shows the simple GVC trade networks for all goods and services in 2000. Compared with traditional trade networks, the US is a global supply hub with important outflow linkages to the other two regional hubs, Germany and Japan. Within each region, some remarkable differences can be observed when comparing the traditional trade networks. For example, more non-NAFTA countries have the US as their main supplier of value-added through simple GVC trade. This also reflects the fact that US-made intermediate products have been largely used as
10 inputs for many countries to produce domestically consumed final products directly and indirectly. This is even the case for the UK, which is a sub-hub in Europe in the traditional trade networks, but becomes a sub-hub of the Asia-Pacific region linking with the US in the simple GVC trade networks.
When comparing the situation in 2000 with that in 2017 (the middle-right part of Figure 1.1), a remarkable structural change in the simple GVC trade networks can be observed. There is no longer any important linkage between any two hubs: simple GVC activities become relatively more concentrated within Europe, North America, and Asia. For example, the US and Germany connect with each other indirectly through the Netherlands. In other words, Factory Europe, Factory Asia, and Factory North America have become much more isolated. In addition, the number of countries surrounding the US decreased dramatically, with most of the surrounding linkages moving to China.
Germany maintains its position as a regional supply hub in Europe with more surrounding countries.
China took over Japan’s position and assumed a portion of the US positions to become the second largest supply hub in terms of both the magnitude of its value-added exports and the number of surrounding countries.
In complex GVC trade networks (see the bottom panel of Figure 1.1), the US dominated the value-added exports as a global hub in 2000. This reflects two facts. First, the US had the largest capacity to produce intermediate products and exports for the world market. Second, US-made intermediate goods had relatively high technology since the US value-added was embodied in international trade that crossed national borders at least two times. This also indicates how most countries’ final demand in 2000 were indirectly dependent on US-made intermediates through complex GVC trade networks. Germany in 2000, unlike its role in the other types of networks, had only a few European countries in its complex GVC trade networks (most of them were from Eastern Europe). Japan was a regional supply hub with large magnitude of value-added exports (see the bubble size), but was only surrounded by a very limited number of countries (most of Japan’s value-added exports went to the US for these complex networks). In 2017, a dramatic structural change in these networks can be seen.
Namely, China took over most of the Asian partners from the US and grew into the regional supply hub with the largest magnitude of value-added exports. Germany also took over many European partners from the US, and enhanced its presence as a regional supply hub. Clearly, China, and Germany enhanced their participation in complex GVC trade networks by building up strong linkages with their neighbors. Given this fact, we could say that complex GVC trade networks are becoming much more regionally concentrated. This may imply that geographic distance matters in the globally fragmented production system, especially for complex GVC trade, since intermediate goods transferring multiple times across national borders can increase costs greatly due to the transaction costs from tariffs and non-tariff barriers. In addition, the relatively active development of regional trade agreements, compared with the slow process of WTO-based negotiations, drove the reduction of tariff and non-tariff barriers inside these regions and thus may also have contributed to building more complex GVCs at the regional level. At the same time, regional trade agreements also follow rules-of-origin which likely promote complex GVC activities.
11 4.1.2 Supply hubs of trade in value-added in various networks for selected sectors
When focusing on a specific sector, very different topologies and structural changes over time can be found. Figure 1.2 shows networks for the textile sector. Obviously, there were many regional supply hubs in traditional trade networks in the year 2000. Inside Europe, in particular, there were three main regional supply hubs in the textile sector, Germany, Italy, and the UK, that exported value-added to their trading partners through final goods trade. Germany and the UK connected indirectly through Turkey. India was also a sub-supply hub with inflow linkage from the UK and outflow linkages to Nepal and Bangladesh. The presence of Italy, a country that traditionally has had a strong fashion sector, can be clearly identified in these networks. This sector network is very different from the networks at the aggregated level shown in Figure 1.1, in which Italy’s presence in the textile sector is largely masked.
For the year 2017, a dramatic structural change in textile trade networks can be observed.
China grew into the largest, unique global supply hub and pushed away all the other regional hubs and surrounding countries to the periphery of the traditional trade networks. This phenomenon is consistent with the fact that the textile final goods made in China can be found everywhere in the world. Various reasons can be used to explain this phenomenon. China already had the production capacity for textiles in its early stages of development, and was thus able to easily join GVCs by exporting more textile final goods when tariff and non-tariff barriers decreased after its WTO accession. In addition, China also has a very high comparative advantage in exporting textiles given its large labor force and relatively lower wages. In addition, the industrial transformation from developed countries through foreign direct investment (FDI) also helped China become the largest exporter of textile products in the world. China’s textile sector also plays a dominate role in the simple and complex GVC trade networks in 2017, not just in the traditional trade networks. This implies that China is gradually making industrial upgrades in its textile sector and can thus export more intermediate goods to other countries through both simple and complex GVC trade. In the simple GVC trade networks, we can still identify some regional hubs, such as Germany, Italy, the US, Turkey, South Korea, Thailand, Vietnam, and India, but for the complex GVC trade networks, China appears to be the primary supply hub. This may imply that China is no long satisfied to be a large final goods exporter for textiles with relatively low value-added gains in traditional trade networks; instead, China has been able to produce and export more value-added in the textile sector through direct intermediate exports or embodying them in other intermediate goods through complex GVC trade. In other words, the rise of China in the textile sector has made the whole system much more global, since almost all regional blocs have faded away from the three network types.
Figure 1.3 shows the value-added export networks for the ICT (information and communications technology) sector. The network topology experienced dramatic changes between 2000 and 2017. In 2017, China grew into a global supply hub and took over Japan’s position in both traditional trade and simple GVC trade networks, and also took over the leading positions of both Japan and US in the complex GVC trade networks. Within Asia in 2017, Japan, South Korea, and Chinese Taipei all played very important roles as sub-hubs. The US was still a regional supply hub that maintained
12 important linkages with a limited number of countries in the traditional and simple GVC trade networks, and has been an isolated small hub surrounding China in the complex GVC trade networks. Japan’s presence decreased very dramatically, as it moved from a global supply hub in the traditional trade networks and a regional supply hub in the simple and complex GVC trade networks to a lesser role on the periphery of the Asia-Pacific region. These trends can be explained by the so-called industrial hollowing out of the ICT sectors in the US and Japan (especially for final goods production), which was accompanied by large-scale international FDI transfer from these countries to China. The latter factor should be considered as one of the most important driving forces of change since, even in recent years, more than half of China’s ICT exports have been produced by foreign invested enterprises. In addition, China’s ICT sector has been able to export more value-added through both simple and complex GVC trade. This may indirectly provide evidence of ongoing industrial upgrades in China’s ICT industries since more complex intermediate ICT products are being made in China. We can also see that Germany’s presence as a regional supply hub in complex GVC trade networks has increased. This reflects the fact that the ongoing regional integration in Europe through ICT-related complex production networks has involved more Eastern European countries that use Germany as their most important intermediate goods supplier.
Figure 1.4 shows value-added export networks for the services sector. In the traditional trade networks in 2000, the US was the largest supply hub with important outflow linkages to Canada and Japan and indirect connections with the other supply hub, Germany, through third countries (Ireland and the UK). In 2017, the US was still a regional supply hub, but with fewer direct outflow linkages to Asia than in 2000. Germany maintained its presence as a regional supply hub with important linkages to other sub-regional hubs such as France and Italy. Germany lost its linkage with the sub-regional hub of Russia, but added a linkage with the new sub-regional hub, Poland, in Europe. China took over Japan’s position in Asia and grew into a large supply hub with an important presence in exporting services sector value-added to the US and other Asian economies in the traditional trade networks. This is not surprising since in 2017 China was the largest final goods exporter, which embodied the value- added of China’s domestic services, despite the fact that China does not export a large amount of services directly to the world market.
In simple GVC trade networks, the US maintained its role as the largest supply hub, but lost some important trading partners such as the UK, which linked with European networks as a sub-supply hub, and Japan, South Korea, Hong Kong, and Australia, which joined the Asia networks surrounding China. In 2017 there was no longer any direct linkage between the US and Germany, but they did indirectly link with each other through the Netherlands. China took over most of Japan’s role in the sphere and became a regional supply hub with important inflow linkage from the US and outflow linkages to other Asian economies. This implies that more value-added in China’s services sector is directly and indirectly exported to other Asian economies and used to produce final goods, but China still largely relies on US-made intermediate services when producing domestically used final goods. In complex GVC trade networks, the US still dominants value-added exports as a global supply hub,
13 despite the enhanced presence of Germany and China. This is probably due to the following two facts concerning the ongoing servitization of manufacturing in the US. First, the US has a relatively high comparative advantage in exporting high-tech and complex intermediate goods and thus more value- added from the domestic services sector can be embodied in the GVCs. Second, producing these high- tech intermediate goods in the US requires more inputs from domestic services sectors such as business supporting services and financial intermediates.
4.2 Demand hubs of trade in value-added in various networks
4.2.1 Demand hubs of trade in value-added trade in various networks at the aggregate level
Tuning our view to how countries act as important importers of value-added via different routes of international trade, we can easily find the demand hubs in various networks. The upper part of Figure 2.1 shows the structural change of traditional trade networks between 2000 and 2017. Obviously, in 2000, the US was the sole global demand hub surrounded by both Asia Pacific economies and some European counties, and with important inflow linkages from the regional demand hubs of Germany, the UK, and Japan. This clearly represents how the US and Germany import final goods through global and regional traditional trade networks, respectively. This structure did not change so much over time, but the rise of China as a new regional demand hub in Asia with the strongest outflow linkage to the US was a significant development by 2017. A similar pattern of change can also be found in the simple GVC trade networks (the middle part of Figure 2.1). In contrast with the traditional trade networks, China has grown to become a regional demand hub in simple GVC trade networks with additional inflow linkages from Asian economies, as well as from certain emerging countries such as Russia and Brazil.
In the complex GVC trade networks (the bottom part of Figure 2.1), the US was the sole global demand hub in both 2000 and 2017. While Germany and China both enhanced their presence in terms of the magnitude of imported value-added (see bubble size) in 2017, the situation remains the same that just a few countries had them as important trading partners in the complex GVC trade networks. This is because of the large scale of US final demand, and also reflects the fact that US final demand can induce more of its non-direct trading partners’ value-added through complex production sharing across countries.
4.2.2 Demand hubs of trade in value-added in various networks for selected sectors
At the sector level, more variation in the structural change of networks can be found. As shown in Figure 2.2, in the textile sector, China built an important outflow linkage to the US. This clearly shows how China made final products that were highly demanded in US final demand. Germany’s presence as a regional demand hub has decreased while Russia became an important regional demand hub with inflow linkages from some Eastern European and Central Asian countries. In the simple GVC networks, China developed an outstanding presence as a regional demand hub with important outflow linkage to the US
14 and inflow linkages from most Asian economies. The presence of France and Russia clearly increased in terms of both the magnitude of their imported value-added and the increasing number of surrounding countries. At the same time, Italy changed from one of the largest regional demand hubs for textiles in Europe to an isolated country. In the complex GVC trade networks, the US dominated all textile trade networks as a unique global demand hub in both years.
Figure 2.3 shows the situation for the ICT sector. In the traditional trade networks, China grew to become the second largest demand hub for ICT with both large magnitudes of value-added imports (bubble size) and more important inflow linkages from Japan, South Korea, Chinese Taipei, German, and Norway, and the strongest outflow linkages to the US. A similar pattern for China can also be found in the simple GVC trade networks for the ICT sector. While the US lost many inflow linkages from Asia, it still maintained many inflow linkages from other economies in the simple GVC trade networks. In the complex GVC trade networks for the ICT sector, the US clearly maintained its position as a demand hub surrounded by most countries, while the rise of China as a new demand hub also became quite noticeable. A similar situation can also be seen for the services sectors (Figure 2.4). This is not surprising since China has grown into the second largest economy, and, at the same time, Chinese purchasing power increased by 9.2 times in terms of GDP per capita and 5.7 time in terms of GDP (PPP) per capita from 2000 to 2017. China’s final demand (including household consumption and capital formation) can no longer be satisfied only by domestic suppliers; more foreign suppliers are now able to get more value- added by providing both final and intermediate goods and services through GVCs to the Chinese market.
5. Conclusion
The rise of global value chains (GVCs) has significantly changed the nature of international trade.
Nowadays, more than two-thirds of world trade occurs through GVCs in which production crosses at least one border, and typically many borders, before final assembly. At the same time, the structural change in GVCs has become more difficult to illustrate given the increasing complexity and sophistication of cross-border production sharing and the global fragmentation of production. When using traditional trade statistics, it is no longer possible to answer fundamental economic questions such as “who produces what for whom” in such a highly globalized world. Thanks to the recent development of TiVA (Trade in Value-added) as a measure for GVCs, this paper has shown that the creation, transfer and absorption of value-added via international trade can be fully and consistently traced in three routes: traditional trade, simple GVC trade, and complex GVC trade, according to the number of times factory contents cross national borders. This further inspired us to use network analysis tools to investigate whether the rise of GVCs is more of a global or regional phenomenon and how the topology and interdependency of countries in GVCs via TiVA have evolved over time.
According to our empirical results, we can conclude that what GVCs look like largely depends on the country’s perspective (supplier or demander) and the type and aggregating level of the corresponding production system. From the perspective of global production networks, we can see that
15 the rise of China has dramatically changed the whole topology of GVCs from both the demand and supply sides at both the aggregated and individual sector levels. This clearly reflects the fact that China is no longer just a “factory” exporting huge amounts of final goods to the world; China has emerged as a new “superpower” through rapid industrial upgrading, which is reflected in the large scale of its exports and imports of intermediate goods and services via both simple and complex GVC trade networks. In other words, more countries, especially in Asia, have become highly dependent on China’s supply of value-added and its demand for value-added directly and indirectly via GVCs. Another interesting finding that is not so remarkable, but can be clearly observed in our results, is that most of China’s final demand in the past was previously satisfied by its own domestic suppliers, whereas nowadays imports play a greater role in meeting this demand. Because of this and due to China’s rapid increase in purchasing power, China has become one of the most important demanders of value-added through final goods trade for several other countries. In relation to this, China organized the first International Import Expo in 2018, and more than 3,600 businesses and exhibitors from 172 countries and regions participated.3 China has also announced plans to import $10 trillion worth of goods over the next five years.4 While China’s per capita GDP is still lower than most developed countries (US$8,827 for China versus US$59,532 for the US in 2017 according to data from the World Bank Group), given China’s potential for positive economic growth, the ongoing process of further opening-up, and its large population size, it is not difficult to imagine that China will become an important demand hub even in traditional trade networks as a large buyer of final goods in the near future. No doubt, this will also significantly change the world map of economic interdependence, as well as the distribution pattern of countries’ influential power in many senses.
Along with the evolution discussed above, Japan has been pushed to the periphery of almost all networks and has become a sub-supply and sub-demand hub in Factory Asia, which is now dominated by China. Furthermore, the presence of the US as a supply hub in the Asia-Pacific region has declined remarkably, but it still remains the world’s largest demand hub, especially in complex GVC trade networks. Factory Europe has remained relatively stable, with Germany maintaining its dominant role as both a supply and demand hub of value-added, and more Eastern European countries becoming more integrated into European trade networks.
Finally, it should be noted that all of the discussion above and findings are based on the creation and absorption of value-added across countries at the aggregate and sector levels, rather than detailed inter- or intra-firm levels. The activities of multinational corporations, one of the key features of present- day GVCs, cannot be fully captured due to the limitation of the data used.
3 CNBC News, November 7, 2018 (https://www.cnbc.com/2018/11/07/ciie-china-puts-on-a-trade-show-but-the-west-isnt- buying.html)
4 Reuters Business News, November 28, 2018 (https://www.reuters.com/article/us-spain-china/china-to-widen-market- access-for-foreign-investors-president-xi-idUSKCN1NX161)
16 Figure 1.1 Supply hubs of trade in value-added in various networks at the aggregate level
Traditional trade networks (all goods and services)
2000 2017 Simple GVC trade networks (all goods and services)
2000 2017 Complex GVC trade networks (all goods and services)
2000 2017
17 Figure 1.2 Supply hubs of trade in value-added in various networks for the textile sector
Traditional trade networks (textiles sector)
2000 2017 Simple GVC trade networks (textile sector)
2000 2017 Complex GVC trade networks (textile sector)
2000 2017
18 Figure 1.3 Supply hubs of trade in value-added in various networks for the ICT sector
Traditional trade networks (ICT sector)
2000 2017 Simple GVC trade networks (ICT sector)
2000 2017 Complex GVC trade networks (ICT sector)
2000 2017
19 Figure 1.4 Supply hubs of trade in value-added in various networks for the services sector
Traditional trade networks (services sector)
2000 2017 Simple GVC trade networks (services sector)
2000 2017 Complex GVC trade networks (services sector)
2000 2017
20 Figure 2.1 Demand hubs of trade in value-added in various networks at the aggregate level
Traditional trade networks (all goods and services)
2000 2017 Simple GVC trade networks (all goods and services)
2000 2017 Complex GVC trade networks (all goods and services)
2000 2017
21 Figure 2.2 Demand hubs of trade in value-added in various networks for the textile sector
Traditional trade networks (Textile sector)
2000 2017 Simple GVC trade networks (Textile sector)
2000 2017 Complex GVC trade networks (Textile sector)
2000 2017
22 Figure 2.3 Demand hubs of trade in value-added in various networks for the ICT sector
Traditional trade networks (ICT sector)
2000 2017 Simple GVC trade networks (ICT sector)
2000 2017 Complex GVC trade networks (ICT sector)
2000 2017
23 Figure 2.4 Demand hubs of trade in value-added in various networks for the services sector
Traditional trade networks (Services sector)
2000 2017 Simple GVC trade networks (Services sector)
2000 2017 Complex GVC trade networks (Services sector)
2000 2017
24 Reference
Arndt, S.W. (1997). Globalization and the open economy, The North American Journal of Economics and Finance, 8(1):71-79.
Los, B., Timmer, M.P. and Gaaitzen J. de Vries (2015). How global are global value chains? A new approach to measure international fragmentation, Journal of Regional Science, 55(1): 66-92.
Baldwin, R. (2012). Global Supply Chains: Why They Emerged, Why They Matter, and Where They Are Going, Working Paper FGI-2012-1, Fung Global Institute.
Baldwin, R. and Javier Lopez-Gonzalez (2013). Supply-Chain trade: A portrait of global patterns and several testable hypotheses, NBER Working paper 18957, National Bureau of Economic Research.
Borin, A. and Mancini, M. (2015). Follow the Value Added: Bilateral Gross Exports Accounting. Working paper of Banca D'Italia, 1026.
Campa, J. and Goldberg, L. (1997). The Evolving External Orientation of Manufacturing Industries:
Evidence from Four Countries. NBER Working Paper, 5919.
Degain, C., Meng, B., Wang, Z. (2017). Recent trends in global trade and global value chains. Global Value Chain Development Report: Measuring and Analyzing the Impact of GVCs on Economic Development. Washington, DC: World Bank.
Feenstra, R.C. (1998). Integration of Trade and Disintegration of Production in the Global Economy, Journal of Economic Perspectives, 12(4): 31-50.
Ferrarini, B. (2013). Vertical trade maps, Asian Economic Journal, 27(2): 105–123.
Ferrantino, M.J. and Taglioni, D. (2014). Global value chains in the current trade slowdown, World Bank Economic Premise, 137.
Estevadeordal, A., Blyde, J., Suominen, K. (2013). Are Global Value Chains Really Global? Policies to Accelerate Countries’ Access to International Production Networks. In: The E15 Initiative.
Strengthening the multilateral trading system. InterAmerican Development Bank. Bali.
Grossman, G. and Helpman, E. (2002a). Outsourcing in a Global Economy. NBER Working Paper, 8728.
25 Grossman, G. and Helpman, E. (2002b). Integration versus Outsourcing in Industry Equilibrium.
Quarterly Journal of Economics, 117: 85-120.
Grossman, G. and Rossi-Hansberg, E. (2008). Trading Tasks: A Simple Theory of Offshoring. The American Economic Review, 98(5): 1978-1997.
Hanson, G., Mataloni, Jr. R. J., Slaughter, M. J. (2003). Vertical Production Networks in Multinational Firms. NBER Working Paper, 9723.
Xiao, H., Sun, T., Meng, B., Cheng, L. (2017). Complex network analysis for characterizing global value chains in equipment manufacturing, PlosOne, 12(1): e0169549.
Hummels, D., Ishii, J. Yi, K. (2001). The Nature and Growth of Vertical Specialization in World Trade.
Journal of International Economics, 54:75–96.
Johnson, R. and Noguera, G. (2012). Accounting for Intermediates: Production Sharing and Trade in Value-added, Journal of International Economics, 86(2):224-236
Jones, R. and Kierzkowski, H. (1990). The Role of Services in Production and International Trade: A Theoretical Framework. in R. Jones and A. Krueger, eds., The Political Economy of International Trade, Basil Blackwell, Oxford.
Krugman, P. (1995). Growing World Trade: Causes and Consequences. Brookings Papers on Economic Activity.
Leontief, W. (1936). Quantitative Input and Output Relations in the Economic System of the United States. The Review of Economic and Statistics, 18: 105-25.
UNCTAD (2013). World Investment Report 2013 Global Value Chains: Investment and Trade for Development, United Nations Conference on Trade and Development, United Nations Publication ISBN 978-92-1-112868-0.
Wang, Z, Wei S.J., Yu, X, Zhu, K. (2016). Characterizing Global Value Chains, Stanford Center for International Development Working Paper, 567.
Wang, Z, Wei S.J., Yu, X, Zhu, K. (2017). Measures of Participation in Global Value Chain and Global Business Cycles, National Bureau of Economic Research Working Paper 23222.
26 WTO-IDE (2011). Trade Patterns and Global Value Chains in East Asia: from Trade in Goods to Trade in Tasks, Printed by the WTO Secretariat.
Yeats, A. (2001). Just How Big is Global Production Sharing? in L. Cheng and H. Kierzkowski, eds., Globalization of Trade and Production in South-East Asia, New York: Kluwer Academic Press.
Yi, K.M. (2003). Can Vertical Specialization Explain the Growth of World Trade? Journal of Political Economy, 111(1): 52-102.
Zhou M, Wu G, Xu H. (2016). Structure and formation of top networks in international trade, 2001–
2010, Social Networks, 44: 9–21.
27 Appendix Country Code
Code Country Code Country Code Country Code Country
AUS Australia GBR United Kingdom NOR Norway KAZ Kazakhstan
AUT Austria GRC Greece POL Poland MON Mongolia
BEL Belgium HRV Croatia PRT Portugal SRI Sri Lanka
BGR Bulgaria HUN Hungary ROM Romania PAK Pakistan
BRA Brazil IDN Indonesia RUS Russia FIJ Fiji
CAN Canada IND India SVK Slovak Republic LAO Lao People's Democratic Republic CHE Switzerland IRL Ireland SVN Slovenia BRN Brunei Darussalam
CHN China ITA Italy SWE Sweden BTN Bhutan
CYP Cyprus JPN Japan TUR Turkey KGZ Kyrgyz Republic
CZE Czech
Republic KOR Korea TAP Taiwan, China CAM Cambodia
DEU Germany LTU Lithuania USA United States MDV Maldives
DNK Denmark LUX Luxembourg BAN Bangladesh NPL Nepal
ESP Spain LVA Latvia MAL Malaysia SIN Singapore
EST Estonia MEX Mexico PHI Philippines HKG Hong Kong, China
FIN Finland MLT Malta THA Thailand
FRA France NLD Netherlands VIE Viet Nam