An Investigation of University English Instructors' Attitudes toward Computers and E-learning
Setsuko Mori Yoshihiro Omura
Information and Internet technology increasingly serves a significant role in education. In the information system industry, Pollack (2003) (cited in Yuen & Ma, 2008) argues electronic learning (e-learning) is one of the most important developments in recent years. Yuen and Ma (2008) mentioned that nearly 95% of higher education institutions use some kind of electronic learning.
However, in Japan, according to the report referred to as Shiritsudaigakukyouin no jugyou kaizen hakusho ("L t -q--*nor) Et It( " ) (2008) published by Japan
Universities Association for Computer Education, only 30 percent of the university teachers (18,418 of 65,903) and 40 percent of junior college teachers (1,521 of 3,731) said that they use information technology (IT) for teaching. However, their use of IT is mostly limited to searching information on the Internet, creating class materials, and posting syllabus. Only 10 percent use cell phones to check students' understanding of the class materials, and only five percent encourage their students to study with e-learning programs. On the other hand, 60 percent admitted that using IT for classes is effective. 20-30% said that teaching using IT helps improve students' willingness to learn, motivation to learn and presentation skills.
There are various reasons why computer assisted teaching and e-learning are not as pervasive as desired. Logistics is an obvious reason. Without an appropriate environment and technology, it is difficult to successfully introduce any e-learning programs. Gobel (2011) also reported on students' computer literacy, use, and attitudes towards CALL noting that the university students in the study preferred mobile phone technology to the computer and CALL technology offered in the university. Greenhalgh
(cited in Masiello, Ramberge, & Kirsti, 2005) contends that many institutions just follow a trend and implement information and communication technology (ICT) without considering how, what and why ICT should be implemented.
All of those reasons are clearly important; however, Lawton and Gerschner (1982) argue that teachers' attitudes towards computers can be a determining factor for the
— 193 —
ft*.NAMItl:/37—CV
successful use of computers in classrooms as well. Previous research (Koohang, 1989;
Violato, Mariniz & Hunter, 1989) suggested that teachers' attitudes affect their initial acceptance and future use of computer technology as much as their knowledge and skills in using computers. However, Reffell and Whitworth (2002) found that teachers are still reluctant to use information technology in education in an active or sustained manner.
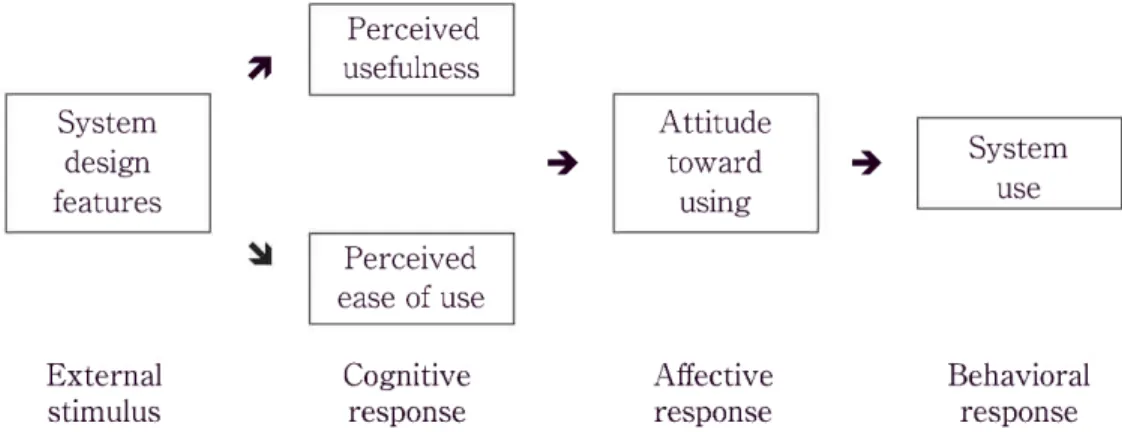
In investigating teacher attitudes towards IT, the Technology Acceptance Model (TAM) has been the most widely adopted framework. TAM was introduced by Davis (1989, 1993) who adapted it on the principles proposed by Ajzen and Fishbein (1977, 1980). Ajzen and Fishbein specified how external stimulus including the objective features of an attitude object are related to beliefs, attitudes and behavior. Based on this, Davis proposed that actual use of a given system can be determined by a user's overall attitude towards that system. Attitudes toward using the system, in turn, depend on their perceived usefulness and perceived ease of use, which is directly affected by the system design features (See Figure 1).
Perceived
70 usefulness
System Attitude
design 4 toward 4 System
features usinguse
Perceived
ease of use
External Cognitive Affective Behavioral
stimulus response response response
Figure 1. Technology Acceptance Model adopted from Davis (1993).
Davis administered a survey with 112 users of an electronic mail system to test this model. His statistical analyses showed that TAM accounted for 36 percent of variance in usage, and perceived usefulness was twice as influential as ease of usage in determining usage. Since then, TAM has been widely used for predicting the use of IT (e.g., Davis, 1993; Davis, Bagozzi, & Warsaw, 1989; Gressard & Loyd, 1985; Selim, 2003;
Vankatesh, 1999; Vankatesh & Davis, 1996; Yuen & Ma, 2002, 2008).
Gressard and Loyd (1985) found that perceived usefulness of computers can affect
— 194 —
An Investigation of University English Instructors' Attitudes toward Computers and E-learning attitudes toward computers whereas the amount of confidence with computers a teacher has may influence the actual use in classroom. Yuen and Ma (2002) also found that perceived usefulness and perceived ease of use directly influenced the intention to use computers.
Based on TAM, Liaw, Huang, and Chen (2006) proposed the 3-TUM (three-tier technology use model). According to this model, attitudes toward IT form three different tiers: "the tier of individual experience and system quality, the affective and cognitive tier, and the behavioral intention tier" (p. 3). Using 3-TUM as a theoretical framework, they administered a questionnaire with 30 instructors and found perceived usefulness and self-efficacy influenced behavioral intentions to use e-learning.
Yuen and Ma (2008) also attempted to expand TAM and came up with their own model which include five constructs: intention to use, perceived usefulness, perceived ease of use, subjective norm and computer self-efficacy. They ran this model with 152 instructors and found that the subjective norm, computer self-efficacy and perceived ease of use accounted for 68 percent of variance in intention to use the e-learning system. Contrary to previous research, however, their statistical analyses indicated that perceived usefulness did not predict instructors' intention to use.
Motivation for the Present Study
Kinki University, where this study took place, offers ALC NetAcademy, an on-line comprehensive e-learning program for both on and off campus use to all the students in Kansai area. The program has four self-learning modules: vocabulary, listening, reading, and technical English.
While 36,631 users are currently registered for the 2011 school year, it seems that the number of students who actually work on the program is quite limited. For example, in October, the month for which the most up-to-date data are available, a total of 6,291 gross users got on line, but it turned out that the same learners used the programs multiple times. In fact, only 649 users actually worked on ALC NetAcademy. Actual number of users for each month are as follows: 981 in April, 1035 in May, 957 in June, 957 in July, 64 in August, 407 in September, and 649 in October. In other words, it is found that less than one thousand students actually utilize ALC NetAcademy every month.
It is also clear that the frequency of ALC NetAcademy use is drastically different
— 195 —
ft* • :/ 37—CV
from faculty to faculty. Kinki University used to offer a unified English language program until several years ago, but now each faculty tries to implement its own program to suit the students' field of study. Thus, English language curricula are quite different from faculty to faculty. It is seen that students at the faculty of Biology- Oriented Science and Technology (Biology hereafter) worked on ALC the most. In the faculty of Biology, an average of 373, out of the total of 1985, students worked on ALC while the semester was in session (excluding the month of August), which is roughly 18.7 % of all the students. Considering the fact that only freshmen and sophomores take the core English classes, 37.4% of all the students in the faculty of Biology use ALC.
Applying the same calculation, Table 1 shows the percentage of students who use ALC in each faculty.
Table 1. ALC use among freshmen and sophomores (2011)
Faculty Biology Business Engineering Economics Literature Law
ALC
use (%) 37.4 6.2 5.3 2.2 4.7 2.0
Other faculties that are not listed here have even lower percentages of ALC use. Thus, it is clear that only students in the faculty of Biology make good use of ALC NetAcademy, while students in other faculties hardly utilize it.
Next, let us take a look at which components of ALC students used more frequently. Kinki University offers four components of ALC: Power Words, Standard, Pre-Intermediate, and Technical English. Power Words is designed to promote vocabulary learning up to 12,000 words. Standard course is the most comprehensible course, offering both listening and reading practices. Pre-Intermediate also offers listening and reading, but it is designed for TOEIC preparation. Technical English offers practices in vocabulary and writing in technical English.
The level tests both in Vocabulary and Standard are used most frequently because they are the starting points to Vocabulary and Standard courses in this program. Other than the level tests, the most popular components are Vocabulary levels 1, 2, and 3, Pre- Intermediate Listening, Reading and TOEIC preparation, and Standard Listening.
— 196 —
An Investigation of University English Instructors' Attitudes toward Computers and E-learning
Table 2. Average number of students who worked on each component
Vocabulary Standard Pre-Intermediate Technical
Component Test 1 2 3 4 Test Listen Read Listen Read TOEIC Basic
# of students 208 187 161 93 24 118 60 34 77 77 78 11
Table 2 shows the average number of students who worked on popular components per month. It indicates that students are concerned with their vocabulary learning as well as TOEIC preparation, and they work on all components, but Technical English does not seem very popular. Table 3 shows the percentage of students who revisited the program.
It is clear that more than 70 % of the students worked on the program less than 10 times.
Table 3. Number of students who worked on ALC
Frequency <3 4-10 11-20 21-30 31-50 51-70 71-100 100<
Number of
studednts 216 247 117 33 25 8 1 2
% 33.3 38.1 18.0 5.1 3.9 1.2 0.2 0.4
Base on the data mentioned above, it is obvious that ALC NetAcademy is not used as much as desired. Although there are various reasons why the self-access e-learning program, which is available both on campus and at home, is extremely underused, it is assumed that teachers play an important role in implementing e-learning in class, and encouraging students to use it outside of class. Therefore, this study attempted to investigate instructors' familiarity with and attitudes toward computers and e-learning.
Research Questions
For the purpose of this study, the following research questions were proposed for a group of instructors teaching English at a university:
1. What computer-assisted activities do teachers often use?
2. What usefulness do teachers perceive of the computer-assisted activities?
3. Is there any relationship between teachers' use and perceived usefulness of the computer-assisted activities?
4. Which sub-constructs of teacher attitudes influence teachers' use of a specific e-learning program?
5. What other factors influence teachers' use of a specific e-learning program?
— 197 —
Methods Participants
In December 2011, the questionnaire was administered on line with 129 English instructors in two departments, business and law, at Kinki University, and usable responses were received from 81 indicating approximately a 63 percent response rate.
The response rate for full-timers was 100 percent whereas the response rate for part- timers was 57.5 percent, and the response rate for the native Japanese speakers was 65.9 while the response rate for the native English speakers was 57.4 percent. Of those who actually completed the questionnaire, 67 percent were native speakers of Japanese while 33 were native speakers of English, and 57 percent were male and 43 were female
(Table 4). The classes that the Japanese teachers are currently teaching are required and elective English classes focusing more on reading and the TOEIC. On the other hand, native English speaking teachers are teaching mostly oral English classes. In other word, in investigating their use of technology and attitude towards technology, a type of class they were teaching was not taken into consideration. After removing those who missed some questions, the total number of responses analyzed was 73.
Table 4. Demographic data of respondents (n=81)
Status Nationality Sex Age
Full-time Part-time NJS NES Male Female 20-29 30-39 40-49 50-59 60-
16 65 54 27 46 35 2 15 32 23 9
Instruments
The data for this study was gathered by a means of a questionnaire formulated based on previous research (Davis, 1983, 1993; Liaw, Huang & Chen, 2006; Mandizadeh, Biemans & Mulder, 2007; Yuen & Ma, 2008). The questionnaire is mainly comprised of four parts: demographic information, computer and Internet experience, attitudes toward IT, and experience with and attitudes toward a particular e-learning program
(See the Appendix). The demographic component included teaching status, nationality, sex, age and classes the participants were currently teaching. In the part concerned with computer and Internet experience, they were asked how often they used such computer activities as Powerpoint presentation and the course management system with their students. In order to investigate teachers' attitudes towards IT, in the third
— 198 —
An Investigation of University English Instructors' Attitudes toward Computers and E-learning part of the questionnaire, the participants were first asked to rate to what extent those listed computer activities they think were useful on a 5-point Likert scale. Then they were instructed to identify to what degree they agree with the statements regarding self-efficacy (e.g., "I am good with computers"), perceived enjoyment of using computers (e.g., "I enjoy working with computers in general"), perceived usefulness (e.g., "Quality of students' learning in my course is improved by using computers"), and perceived ease of use (e.g., "Using computers as a teaching assisted tool is easy for me") again on a 5-point Likert scale. Lastly, the participants were asked whether they know about ALC NetAcademy 2 (i.e., "Do you know that Kinki University offers a self- access e-learning program called "ALC NetAcademy 2?" ), and instructed to provide information regarding how they learned about ALC NetAcademy 2. Then the participants were asked whether they actually use this program (i.e., "Do you use ALC NetAcademy 2 for your class?") and instructed to provide reasons why or why not they use this e-learning program. Although the survey questions were all in English, the Japanese instructors were instructed to provide written comments in Japanese simply for the sake of convenience in subsequent analyses. The reliability of the questionnaire assessed using Cronbach alpha was .95
Procedure
The questionnaire was created using an Internet site referred to as Survey Monkey (www. surveymonkey.com). This site allowed the researchers to create and publish the survey on line. All participants received the same e-mail request both in English and Japanese either directly from one of the researchers, or other teachers in their department, and were asked to complete and submit the survey on line. They were given 10 days to complete the survey. Since the response rate was as low as 39 percent by the first dead line, the deadline was extended for six days. Their responses were then viewed on line and converted to Excel format. The data was further converted to SPSS format, and analyzed using SPSS Statistics Base, and Text Analytics for Survey.
Results
Research Question One: Computer-assisted Activities Teachers Use
The teachers were asked to specify to what extent they used the features that
— 199 —
ft*.NAMItl:/37-CV
appeared in Table 5 on a five-point Likert scale (1: Never; 5: All the time). Table 5 shows that the majority of the teachers never use any of the functions. Comparisons of the means and percentages of those who either chose "sometimes," "often" or "all the time" indicate that "E-mail and mailing list (M=1.8, 24.6%)" and "Powerpoint presentation (M=1.7, 22%)" were used most frequently. On the other hand, least frequently used features were "Online discussion (M=1.2, 5.5%)" and "Course management system (e.g., Moodie)" (M=1.2, 4.1%). MANOVA was run in order to see if there were any significant differences in computer use among different groups. The results of MANOVA imply that there was no significant difference depending on nationality, sex and age.
Table 5. Descriptive statistics (percentages, M, SD) of teachers' use of selected features of e-learning environments (n=73)
Features 1 2 3 4 5 M SD
1 2 3 4 5 6 7 8 9 10
Presenting course material and literature on line 68.5
Powerpoint presentation 68.5
E-mail and mailing list 61.6
Course calendar and schedule on line 82.2 Course announcement and news on line 74.0
Online collaboration 84.9
Online discussion 87.7
Online test/quiz 83.6
Course management system (e.g.,Moodle) 89.0 Self-access e-learning program (e.g., ALC) 72.6
12.3 9.6 13.7 6.8 15.1 4.1 6.8 9.6 6.8 8.2
11.0 11.0 13.7 2.7 1.4 8.2 4.1 5.5 0.0 11.0
5.5 5.5 6.8 4.1 6.8 0.0 0.0 0.0 2.7 6.8
2.7 5.5 4.1 4.1 2.7 1.4 1.4 1.4 1.4 1.4
1.6 1.7 1.8 1.4 1.5 1.3 1.2 1.3 1.2 1.6
1.1 1.2 1.2 1.0 1.0 0.7 0.6 0.7 0.7 1.0 1=Never; 2=Seldom; =Sometimes; 3 4=Often; 5=A11 the time
Research Question Two: Teachers' Perceived Usefulness of Computer Assisted Activities
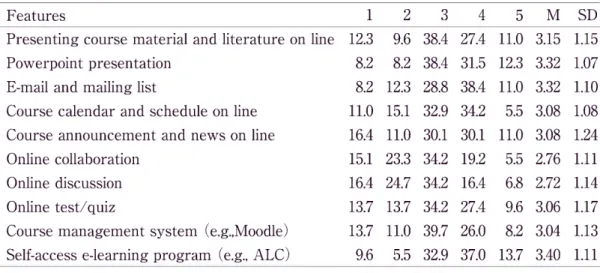
The same procedure was followed to determine teachers' perceived usefulness of the selected features of e-learning environments. The teachers were asked to specify how useful they perceive those activities to be on a five-point Likert scale (1: Not at all;
5: Very useful). As shown in Table 6, the mean scores for all but two items (Online collaboration and Online discussion) were above three, which may imply that the majority of the teachers recognize the value of these activities for teaching and learning.
Comparisons of the means and percentages of those who either chose "somewhat
- 200 -
An Investigation of University English Instructors' Attitudes toward Computers and E-learning
useful," "useful" or "very useful" indicate that self-access e-learning program (e.g., ALC) (M=3.40, 84.9%), Powerpoint presentation (M=3.32, 83.6%), and E-mail and mailing list (M=3.32, 79.5%) were believed to be most useful. On the other hand, as mentioned above, online discussion (M=2.72, 57.4%) and online collaboration (M=2.76, 58.9%) had the least added value. Again, MANOVA was run in order to see if there were any significant differences in perceived usefulness among different groups. The results of MANOVA imply that there was no significant difference depending on nationality, sex and age.
Table 6. Descriptive statistics (percentages, M, SD) of teachers' perceived usefulness of selected features of e-learning environments (n=73)
Features 1 2 3 4 5 M SD
1 2 3 4 5 6 7 8 9 10
Presenting course material and literature on line 12.3 9.6 38.4 27.4 11.0 3.15
Powerpoint presentation 8.2 8.2 38.4 31.5 12.3 3.32
E-mail and mailing list 8.2 12.3 28.8 38.4 11.0 3.32 Course calendar and schedule on line 11.0 15.1 32.9 34.2 5.5 3.08 Course announcement and news on line 16.4 11.0 30.1 30.1 11.0 3.08
Online collaboration 15.1 23.3 34.2 19.2 5.5 2.76
Online discussion 16.4 24.7 34.2 16.4 6.8 2.72
Online test/quiz 13.7 13.7 34.2 27.4 9.6 3.06
Course management system (e.g.,Moodle) 13.7 11.0 39.7 26.0 8.2 3.04 Self-access e-learning program (e.g., ALC) 9.6 5.5 32.9 37.0 13.7 3.40
1.15 1.07 1.10 1.08 1.24 1.11 1.14 1.17 1.13 1.11 1=Not at all; 2=Not very useful; 3=Somewhat useful; 4=Useful; 5=Very useful
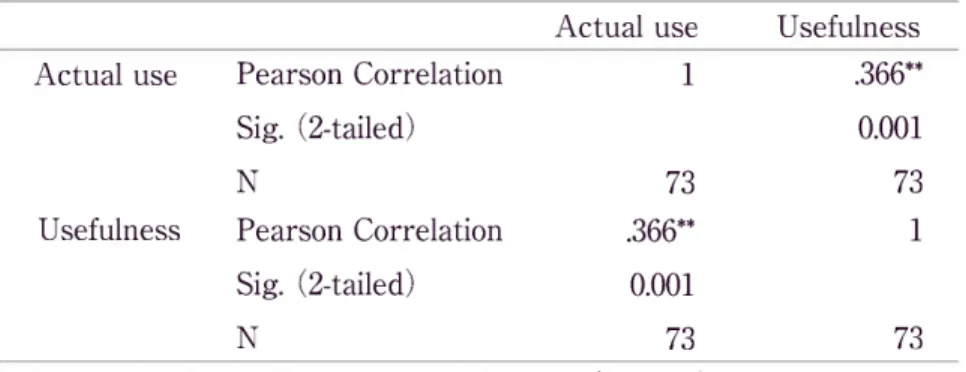
Research Question Three: Relationships between Teachers' Use and Perceived Usefulness
Correlation coefficients were computed between teachers' actual use of selected features of e-learning environments and their perceived usefulness of those features.
The result of the correlational analysis presented in Table 7 shows that the correlation between those two variables was significant. This result suggests that there is a significant relationship between how often teachers use those features and how useful they perceive those features are.
- 201 -
ft*.NAMItl:/37—CV
Table 7. Correlation between actual use and perceived usefulness of selected features of e-learning environments
Actual use Usefulness Actual use
Usefulness
Pearson Correlation Sig. (2-tailed) N
Pearson Correlation Sig. (2-tailed) N
1
73 .366**
0.001 73
.366**
0.001 73
1
73
** Correlation is significant at the 0.01 level (2-tailed).
Research Question Four: Influence of Teacher Attitudes on their Use of E-learning Program
As table 8 shows, although almost 80 percent of the teachers have at least heard about the ALC e-learning program, 85 percent mentioned that they seldom or never use the program.
Table 8. Descriptive statistics of teachers' familiarity with ALC and actual use of ALC
1 2 3 4 5 M SD
ALC familiarity ACL use
19.1 72.6
45.2 12.3
35.6 10.9
NA 2.7
NA 1.3
2.16 1.48
0.73 0.90
ALC familiarity: 1=I don't know; 2=I've heard about it; 3=1 know the details of the program ACL use: 1=Never; 2=Seldom; 3=Sometimes; 4=Often; 5=All the time
A linear regression analysis was conducted to evaluate the prediction of actual use of the ALC e-learning program from teacher attitudes toward computers and e-learning in general. Teacher attitudes were operationalized as means of four attitudinal categories, namely self-efficacy (e.g., "I am good with computers"), perceived enjoyment of using computers (e.g., "I enjoy working with computers in general" ), perceived usefulness (e.g., "Quality of students' learning in my course is improved by using computers"), and perceived ease of use (e.g., "Using computers as a teaching assisted tool is easy for me" ). As Table 9 suggests, information regarding differences in self- efficacy, perceived enjoyment of using computers, perceived usefulness, and perceived
— 202 —
An Investigation of University English Instructors' Attitudes toward Computers and E-learning
ease of use cannot be used to predict whether the teachers actually used a specific e-learning program.
Table 9. Sequential regression of attitude toward computers and e-learning on the actual use Model
Unstandardized Coefficients
Standardized Coefficients
95.0% Confidence Interval for B
B Std.
Error Beta t Sig. Lower Upper
Bound Bound
1 (Constant) Self-efficacy Enjoyment Usefulness Ease
0.693 -0.259 0.116 0.265 0.126
0.488 0.212 0.199 0.171 0.187
-0 .268 0.142 0.255 0.114
1.422 -1.221 0.583 1.547 0.673
0.16 0.226 0.562 0.127 0.503
-0.28 -0.682 -0.282 -0.077 -0.248
1.666 0.164 0.514 0.607 0.5
Dependent Variable: ALC use
Research Question Five: Other Factors Influencing Teachers' Use of E-learning Program A linear regression analysis was conducted to evaluate the prediction of actual use of ALC e-learning program from nationality (Japanese speakers/English speakers), sex and age (20-29, 30-39, 40-49, 50-59, 60 or above). As Table 10 suggests, information regarding differences in nationality can be used to predict whether the teachers actually used a specific e-learning program. A close examination indicates that more Japanese teachers use ALC e-learning program than native English speaking teachers.
Table 10. Sequential regression of nationality, sex and age on the actual use
Model
Unstandardized Coefficients
Standardized Coefficients
95.0% Confidence Interval for B
B Std.
Error Beta t Sig. Lower Upper
Bound Bound
1 (Constant) nationality sex age
1.354 -0 .615 0.354 0.117
0.528 0.253 0.234 0.108
-0 .316 0.198 0.129
2.564 -2.436 1.509 1.087
0.013 0.017 0.136 0.281
0.301 -1.12 -0 .114 -0.098
2.408 -0 .111
0.822 0.332
This section tries to describe survey, the open-ended question
and interpret the results
"R
easons why you use or
of the last question of the do not use ALC." While
- 203 -
ft* • :/ 37—CV
native teachers all responded in English, most Japanese teachers responded in Japanese and some in English. Due to the nature of text mining software, which utilizes a language specific dictionary, the data in English and those in Japanese were analyzed separately.
Of the 23 responses in English, 22 replied that they "Never" use ALC and all their responses were replies to "why they do not use ALC." On the other hand, of the 23 responses in Japanese, four responses were replies to "why they use ALC and 19 responses were replies to "why they do not use ALC." Thus, the four replies to "why they use ALC" were excluded from the analysis at this time. Therefore, this section tries to analyze the reason why the teachers do not use ALC. Because categorization of keywords was not very accurate due to the small number of responses, this paper limits the use of text mining to listing the frequent terms and showing category webs.
Keywords extracted from the Japanese responses are as follows: -*`' (8), (7),
— 37 (4)
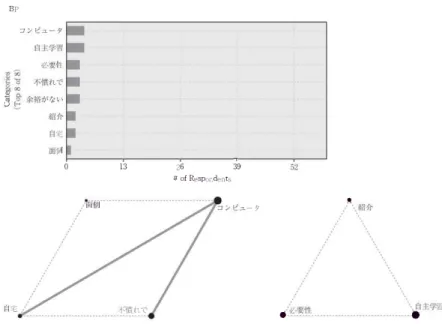
, V: (3), RR (3), 7 (3), TE (3), 066 (2), 8 t.:z (2), '(t .=) (2), 41- (2), S) z (2), S)I (2), n'i33`(2), itffl (2),V:,1*(2), /VI (2), ^ (2), til—fT (2), (2). These keywords are then categorized into eight categories (Graph 1), and mapped in Figure 2. From the category web, it can be said that teachers do not use ALC because they are not very familiar with the program and are concerned with students' accessibility to the program from home. In addition, they feel such self-learning programs should be treated as self-learning tools and thus do not use them in class.
Graph 1. Category of Japanese responses
BP
E It
ct,')
-L ij-1
0 13 26 39
# of Respondents Rid—37•
t 71, Md-C
• E • 74
Figure 2. Category web of Japanese responses — 204 —
An Investigation of University English Instructors' Attitudes toward Computers and E-learning
Keywords extracted from the English responses are as follows: ALC (11) , students (6), don't know (5), no (4), class (4), computers (4), classrooms (3), problem (2), appropriate (2), applicable (2), nothing (2). These keywords are categorized into eight categories (Graph 2), and mapped in Figure 3. From the category web, it can be said that teachers do not use ALC because they do not have enough information about it and they do not have time for it in class. Also, teachers are concerned that students do not have access to the program and students are not motivated enough to work on it.
Graph 2. Category of English responses
BP
alc don't know
students t; '6" computer access
i2;
Uenglish
not motivated class no time
0 15 30 :15 60
# of Respondents
computeraceesse'---notime • not motivated
Figure 3. Category web of English responses
Both the Japanese responses and English responses revealed that teachers do not use ALC in class because 1) they are not very familiar with the program, 2) they are concerned with students' accessibility to the program from home, 3) they do not have time for it in class, and 4) they feel students should work on it outside the class as a self-learning activity.
Discussion and Conclusion
The findings of this study revealed that despite the fact that the majority of the instructors recognized some usefulness of computer-assisted activities, approximately 90
— 205 —
percent said they never or almost never use most of the activities listed. Even Powerpoint and E-mail are used only by slightly over 20 percent of the respondents. In other words, the use of computer assisted activities in this institution is much more infrequent than the figure cited in fLIT_'4-4ftrl0)454AE *El, (2008) where 30 percent of the university teachers said that they use IT for teaching.
The result of the correlational analysis shows that there is a significant relationship between how often teachers use those features and how useful they perceive those features to be. However, when we analyzed a relationship between teachers' attitudes operationalized as self-efficacy, perceived enjoyment of using computers, perceived usefulness and perceived ease of use, and actual use of ALC, the result indicated that any of these sub-constructs of teachers' attitudes cannot predict whether the teachers actually used ALC. In other words, it seems that teachers' lack of confidence in computers, how little they enjoy using computers and the e-learning environment, or whether they perceive computers and e-learning as useless or hard to use may not be reasons why they do not use ALC.
In order to further investigate why the majority of the instructors do not use ALC, their written comments were analyzed using a text-mining software. Although we did not specify in-class use of ALC, the reasons given both by Japanese and native English speaking instructors can be summarized as follows:
1. They are not very familiar with the program.
2. They are concerned with students' accessibility to the program from home.
3. They do not have time for it in class.
4. They feel students should work on it outside the class as a self-learning activity.
In sum, the written comments also revealed that teachers' familiarity with the program but not their attitudes such as their perceived usefulness influenced their use.
Although a brief description of ALC is provided to all the teachers in both departments, workshops on ALC are given to only those who are interested in the beginning of a school year. To encourage more teachers to use the program, it is obvious that we need to make more effort to promote the program including frequent workshops throughout the semester. Furthermore, there had been a technical problem which prevented some students and teachers from accessing ALC at home. Although this specific problem has been solved, it is easy to see how the failure at their initial attempts discouraged some teachers to try persistently. In addition, reasons three and
— 206 —
An Investigation of University English Instructors' Attitudes toward Computers and E-learning
four mentioned above have something to do with teachers' misunderstanding that ALC should be used in class. Like other self-access e-learning programs, ALC is intended to be used mainly outside the class. Again a better advertisement and explanation on the current status and how to use the program is clearly needed to increase the use.
Although the reported teachers' concerns are valid, there are a number of solutions that could be implemented. One possible scenario would involve minimal teacher training in the ALC system, and requiring students to complete ALC modules for homework. The teachers could then track student progress via the ALC tracking system, encouraging students in-class. This encouragement may be seen as both motivating to the students, and provide possible utility for the ALC software in the students' eyes. Since the teachers would not be directly involved in the ALC modules, background of the ALC system and training in how to track their students' progress could take place in one session. A scenario such as this would have three positive outcomes: encouraging the students to study English outside of class using ALC;
familiarizing teachers with ALC and encouraging them to explore the possibilities that ALC has to offer; and create tangible support for the universities decision to make ALC available to all students.
References
Ajzen, I., & Fishbein, M. (1977). Attitude-behavior relations: A theoretical analysis and review of empirical research. Psychological Bulletin, 84, 888-918.
Ajzen, I., & Fishbein, M. (1980). Understanding attitudes and predicting social behavior (p. 278). Englewood Cliffs, NJ: Prentice-Hall.
Davis, F. D. (1989). Perceived usefulness, perceived ease of use and user acceptance of information technology, MIS Quarterly, 13(3) , 319-339.
Davis, F. D. (1993). User acceptance of information technology: System characteristics,
user perceptions and behavioural impacts. International Journal of Man-Machine
Studies, 38(3) , 475-487.
Davis, F.D., Bagozzi, R.P., & Warsaw, P.R. (1989). User Acceptance of Computer
Technology: A Comparison of Two Theoretical Models. Management Science, 35(8) , 983-1003.
Gobel, P. (2011). Digital natives or mobile natives? Presentation at G1oCALL, 2011.
— 207 —
ft*.NAMItl:/37-CV
Manila, Phillipines, October 28-29, 2011.
Gressard, C. P., & Loyd, B. H. (1985). Age and staff development experience with computers as factors affecting teachers attitudes toward computers. School Science
Mathematics, 85(3), 203-209.
Shiritsudaigakukyouin no jugyou kaizen hakusho. (2008). Japan Universities Association
for Computer Education.
Koohang, A. A. (1989). A study of attitudes toward computers: Anxiety, confidence,
liking and perception of usefulness. Journal of Research on Computing in Education,
22(2), 137-150.
Lawton, J., & Gerschner, V. T. (1982). A review of the literature on attitudes towards computers and computerized instruction. Journal of Research and Development in
Education, 16(1), 50-55.
Liaw, S., Huang, H., & Chen, G. (2006). Surveying instructor and learner attitudes toward e-learning. Computers and Education, 49(4), 1066-1080.
Mandizadeh, H., Biemans, H., & Mulder, M. (2007). Determining factors of the use of e-learning environments by university teachers. Computers and Education, 51(1),
142-154.
Masiello, I., Ramberg, R., & Lonka, K. (2005). Attitudes to the application of a Web- based learning system in a microbiology course. Computers and Education, 45(2),
71-185.
Reffell, P., & Whitworth, A. (2002). Information fluency. New Library World, 103, 427-435.
Selim, M. H. (2003). An empirical investigation of student acceptance of course websites. Computers and Education, 40(4), 343-360.
Vankatesh, V. (1999). Creation of favorable user perceptions: Exploring the role of intrinsic motivation. MIS Quarterly, 23(2), 239-260.
Vankatesh, V., & Davis, F. D. (1996). A model of the antecedents of perceived ease of use: Development and test. Decision Science, 27(3), 451-481.
Violato, C., Mariniz, A., & Hunter, W. (1989). A confirmatory analysis of a four-factor
model of attitudes toward computers: A study of pre-service teachers. Journal of Research on Computers in Education, 21, 199-213.
Yuen, H. K., & Ma, W. K. (2002). Gender differences in teacher computer acceptance.
Journal of Technology and Teacher Education, 10(3), 365-382.
Yuen, H. K., & Ma, W. K. (2008). Exploring teacher acceptance of e-learning technology.
Asia-Pacific Journal of Teacher Education, 36(3). 229-243.
— 208 —
An Investigation of University English Instructors'
Appendix Questionnaire
Attitudes toward Computers and E-learning
1 Part-time/full time 2 Japanese/NSE 3 Gender
4 Age
5 Classes you teach
6 How often do you do the following computer activities with your students?
(1=never, 2=seldom, 3=sometimes, 4=often, 5= all the time) Presenting course material and literature on line
Powerpoint presentation E-mail and mailing list
Course calendar and schedule on line Couse announcement and news on line Online collaboration
Online discussion Online test/quiz
Course management system (e.g., Moodle) Self-access e-learning program (e.g., ALC)
7 How useful do you think the following for teaching/learning?
(1=not useful at all, 2=somewhat useful, 3=1 don't know, 4. useful, 5=very useful)
Presenting course material and literature on line Powerpoint presentation
E-mail and mailing list
Course calendar and schedule on line Couse announcement and news on line Online collaboration
Online discussion Online test/quiz
Course management system (e.g., Moodle) Self-access e-learning program (e.g., ALC)
8 How strongly do you agree with the following statements?
(1=not agree at all, 2=somewhat disagree, 3=neutral, 4=somewhat agree, 5=strongly agree)
I am good with computers.
Generally, I would feel OK about trying a new problem on the computer.
I feel confident using computers as a teaching assisted tool I feel confident using e-learning environments
I enjoy working with computers in general.
Figuring out computer problems is difficult for me.
I enjoy using computers as a teaching assisted tool I enjoy using e-learning environment for teaching purpose I believe using e-learning environments is helpful for learning I believe using e-learning environments is helpful for teaching
Quality of students' learning in my course is improved by using computers.
- 209 -
ft* • i-11111-1t1-- :/ 37 —CV
9
10
Quality of students' learning in my course is improved by using e-learning environments.
Learning to teach using e-learning programs is easy for me.
I find teaching using e-learning programs cumbersome to use.
Using computers as a teaching assisted tool is easy for me.
I find it takes a lot of effort to become skillful at using computers as a teaching assisted tool.
Do you know that Kinki University offers a self-access e-learning program called "ALC NetAcademy 2"?
(1=I don't know, 2=I've heard about it, 3=1 know the details of the program) How you learned about ALC.
Do you use ALC NetAcademy 2 for your class?
(1=never, 2=seldom, 3=sometimes, 4=often, 5= all the time) Reasons why you use or do not use ALC
— 210 —