Promotion of Medium‑sized Cities: Part I)
journal or
publication title
福井大学工学部研究報告
volume 35
number 1
page range 17‑36
year 1987‑03
URL http://hdl.handle.net/10098/4269
The Evolution of Urban Population and Changes on the Industrial Composition in Brazil
(Reserch on the Methodology for Promotion of Medium-sized Cities: Part I)
Yoshiaki DONDAI, Gilda Collet BRUNA*', Emilio Issao TACDIBANAIII, Kiyolli KURAMOTO"1l (Received Feb. 20, 1987)
This paper is a preliminary study for promotion of medium*siEed cities.
33 Brazilian cities (over than 300,000 inhabitants) are considered to analyze population and industrial composition. First, the evolution of urbani&ation and the outline of urban policy are described; secondly, based on the classified cities, the trends of population evolution is pxamined; and thirdly, the changes on the industrial composition is 1nalyzed. As the results, it becomes clear that the population distribu*
tinn on the national territory is unbalanced, and the majrr changes on the industrial composition are in the non*metropolitan cities.
1.IN'n1nDUCTION 1 • 1 GENERAL PURTUSE
The concentration of rural population in metropolitan cities of Asian countries and Latin American countries has occurred in an accelerated rate.
This kind of IX)pulation grm-rth in metropolitan area has generated several ur- han problems such as housing shortage, overcongestion on the capacity of
t.ransportation mearlS and other urban facil i ties.
Al though these problpms have been pointed out b~T many people, the solu- tion for slIch problems is far aHay to be solved. If this situation continues to persist, a giarlt metropolis Hill born and it Hill not have any human force able to control it. [\loreover it is expected at the beginning of X,XI's, an alarming situation that more than ~O% of national population Hill be con- centrated in that giant metropolis.
t Associate professor at (Iniversity of Fukui, Dep. of General Constructive Engineering
U Full professor at University of Sa') Paulo, Fae. of Arch. ~ Urbanis!ll
nf Gr~duate student (doctor coursej at liniversity of Tokyo, Dep. of Urban Fngineering Utt Graduate stlldent. (master course ~t University of Sao Paulo, Fac. I)f Arch. l Urbnis!!I
THO solutions have been though for solving these metropolitan problems: a massive provision of urban facilities in relation to population concentration, or R control of IX>pulation migration. HmoJever both solutions have not had enough efficiency in reverting these metropolitan problems. The Hay to relieve those problems is the promotion of rural area Hhere population migration has generated, and the promotion of medium-sized cities (in general, 1 or 2 mil- lion people has been considered) Hhich have demonstrated that are able to per- form a ma..ximllln convenience in relation to populat.ion concentration.
From this point of vieloJ, this research takes the greater metropolis of Brazil (Sao Paulo) as subject, and intend to study methodology for promotion of meditun-sized cities through field survey. The subject cities are Recife, Salvador, Belem, Nanaus and so on, and to promote those medium-sized cities it Hill be made a joint. research Hith Japanese 8Jld Brazilian researchers concern-
ing to provision of translxwtation facilities, rationalization of land use, provjsion of housi.ng and life-supporting facilities. The general content of research is the following:
a.. Analysis of urban formation process in Brazil;
b. Estirnating analysis on the efficiency of promotion measures (based on SD
model) ;
c.
Analysis of urban st.ructure in medium-sized cities (based on factor analysis) ;d. Study of cases.
1.2. ruRroSE AND OONTENT IN 'I'l-IE PRESENT PAPh~
As a preliminary considerat.ion, t.his paper investigates the first item of above mentioned content, i,.e., the process of urban formation in Brazil, and intend to give an outline in terms of trends in urbanization and urban policy;
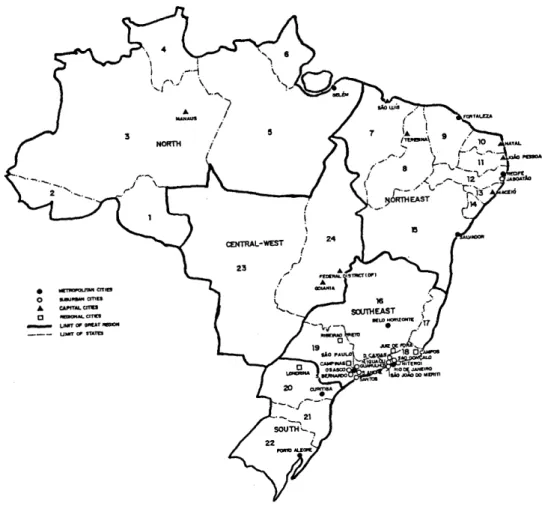
gro'vt,h process of population in medium-sized cities; and transformation of labor force c'omposi tion. After some investigation this study considered 24 statps and 33 cities (popUlation over 300,000) as subject. for this study h'hich are shOloJed in fig. 1.
2. 'IlmNDS OF BHAZU,IAN UR13t\NIZATION AND URBAN roLICY 2. 1 ME'l'RoroLITAN cnNCENTRATION OF roPUlATION'
2. 1 • 1 IURILATION
The total popUlation of Brazil in 1980 is near 119 million people, and in 30 years, i . e., from 1950 its popUlation has grmm more than twice and con- tinuing to gro'oJ" at the present. In the 1950's the aru1Ual average grmoJt.h rate
Has 3.5%, in 1960's it l-JaS 3.3%, and finally in the 1970's it Has 2.8% sh01.,ring a decreasing tendency. The main factor to those high gr01.,rth can be considered as its high birth rate.
Although the birth rate has decreased in Brazil, it is expected that the population Hill continue to grow due to decreasing mortality Hhich is resulted from increasing life standard and development of medical care.
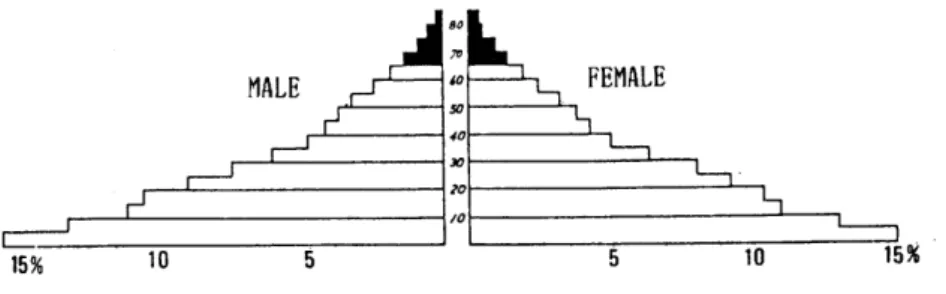
The age composition of population as ShOHed in fig. 2 is composed mainly by young people (he101'" of 15 years old), whose percentage is near to 50%. The youth-class is characterized by its early entrance in the labor market and by its incomplete educational formation as consequence the high life cost in ur- ban area. This fact has brought serious economical troubles, i.e., over supply of non-skilled labor, generation of unemployment in the urban area, and labor shortage in the rural area.
• .."...,.".,etTlD
o ....,_cmu
• CAI'tTOLcma
C -.u..CI"Tft UMT",,·ot:AT_
UMrT CI STATa
.-.-1
f \
\
.. "
i
?
i i i
CENTRAL-WEST
Figure 1. Kap of great regions, states, and ujor cities in Brazil.
Noreover, due to the large extension of Brazilian territory, th~ popula- tion distribution is characterized as highly polarized. The overall population density of Brazil is 14 inhabitants/kInl in 1980, and it can be found 1 inhabitant/kInl to Amazonas state, on the other hand 255 inhabitants/kInl to Rio de Janeiro state. In terms of great regions, the northeast, southeast and south regions represent 35.8% of total area of the country, and they have con- centrated approximately 90% of total I~pulation. The majority of population is dist.ributed at t.he coastal area from Maranhao state at the northeast to Rio Grande do SuI state at the south.
2. 1. 2 roPULATION MIGRATION
The massive migration h7ave from abroad started in the end of XIX's, and it is estimated that during the period of 1850 to 1950 at about 5 million people inunigrated to Brazil and near 3 million of them fixed their residence in the country.
With decreasing tendency of immigration, the internal migration of people started. Since the 1920's the migration to Sao Paulo state has started and since 1950's the frontier area has changed to the northern area of Parana state. Until the 1950's the southern region of Brazil presented the major rates of internal migration, but in the present the two major metropolitan area (Sao Paulo and Rio de Janeiro metropolitan area) are the main popUlation migration poles, and these two metropolitan area have employed at about 50% of industrial Horkers of Brazil. The majority of migrants, '"ho are seeking for jobs, are from the Bahia and Minas Gerais states.
The migration from rural to urban area has year by year increased. In 1950 the percentage of Brazilian urban population was 36%, and in 1980 the percentage increases to 68%, and in the present the migratory destinations is not only to metropolitan area, but it has expanded to medium-sized cities.
Figure 2. Age co.position of population.
2. 1.3 URBAN OONCENTRATION OF IURJLATION AND PROBLEMS
The problem of urban concentration of population is not only related to the cities which receive the migrants, but also to the the rural area which is the origin of population flux.
Although the industrialization rate is rapidly in progress, the absorp- tion of rural migrants are not complete in all cities. They have lived in the cities without jobs, so not only unemployment troubles but housing problems have occurred there. The people with or without job who have experienced the amenities of urban life do not desire to return to the rural life, because in the city they have at least cost-free assistance in terms of education, medi- cal care and so on in the public establishments which are concentrated in ur- ban areas.
Many people who insist to live in the city without adequate jobs have lived in "favela"'ll. In the "favela", people have settled in public owned land, and they have tried to survive in a narrOH space Hith high population density, and in a poor environmental conditions. Those area are at the slant of hill or at the bad drained swampy land, and most of them are in the in- sanitary condition Hithout adequate water and sewer improvement. Althot~h it was established the National Housing Bank to construct housing to labor class, the "favela" has continuing to expand.
Moreover, as consequence to rapidly urban grOl.,rth, troubles in the food provision has generated, because Sao Paulo city has controlled and con- centrated the distribution establishments of agricultural products and most Brazilian cities are dependent from Sao Paulo. So, the price of basic food in the urban area has frequently suffered Hith sudden increase leading the level of life cost to the crucial point.
other problem relating to urban growth is the shortage in the basic urban facilities concerning to education, water and seHer treatment, life- supporting, and so on.
In addition, the expansion of urban size has generated traffic congestion and nuisance. In all metropolitan areas the saturation of transportation sys-
tem ar.e evident, and 'vi th the increasing motorization rate, it can be es- timated the aggravation of those problems.
Finally, due to the problem related to the unbalanced population dis- tribution on the national territory and the rapid growth in metropolitan area it can be estimate the aggravation of the problem related to population composition.
2.2 ll1E ffiESENT OONDITION OF URBAN roLICY
"1be systematic urban policy in Brazil started in 1964 when the National Housing Bank (Banco Nacional de Habitacao - BNH) l~S established. At that time the basic urban policy was based on the follm~ing points:
a. Reduction of regional unbalance of population" distribution;
b. Correction in the low level of urbanization standard resulted from migration of people Hith lOH economic acquisitive poHer;
c. Job policy able to cope Hi th population increase.
In the practice the BNH h7"dS restricted in providing habitation and giving support to the housing industry. Still in 1964 the Federal Service of Housing and Urbanism (Servico Federal de Habi tacao e Urbanismo - SERFHAU) was estab- lished under the control of BNH to planning selected cities, but it 1~S con- sidered only from a physical I~int of view, and until 1972 the urban policies in Brazil were based on the housing policies when BNH began financing sanita- tion and water supply projects.
The National Urban Development
La,,,
was enacted in 1974 and established the 9 metropolitan regions, and as consequence the National Commission of Ur- ban Policy (Comissao Nacional de Politica Urbana - CNPU) Has created to formu- late urban and metropolitan policies.The II National Development Plan (Plano Nacional de Desenvolvimento II - PND II) of 1975 announced a policy to control population concentration in metropoli tan area, and The Na tional Urban Developnent Fund (Fundo Nacional de Desenvolvimento Urbano - FNDU) was created to give financial support to the main urban programs and projects. At the same time the Brazilian Urban Transportation Agency (Empresa Brasileira de Transportes Ur- bnn08 EBTU) Has established to implement public transportation projects in the metropolitan areas, state capital cities and main cities.
In 1979 the CNPU Has transformed into the National Council of Urban Development (Conselho Nacional de Desenvolvimento Urbano - CNDU) Hith more
I~litical JXlHer to define an overall urban development policy Hhich can sum- marized as follm..,.,:
a . Control of migration to metropolitan cities and control of urban land use in order to eliminate gradually the existing slums;
b. Promotion of grm..rth in medium-sized cities by provision of living environment;
c. Creation of job opportunities in small-medium sized cities by activa- tion of production activity.
Finally, as regional development. strategy it HaS set up the basic guidelines for the 5 great Brazilian regions, and it HaS made the following
classification for large cities:
a. Control area for population concentration (Sao Paulo, Rio de Janeiro);
b. Ordered development area (Recife, Salvador, Belo Horizonte, Curi tiba, Porto Alegre);
c. Development promotion area (Belem, Fortaleza, etc.);
d. Special functional area (Brasilia, sight-seeing cities, . and historical cities) .
Special attention on the promotion and activation of medium-sized cities has been made in order to control population concentration in metropolitan area .and promotion of under-developed area. And to achieve an effective result it has been adopted the following measures: massive improvement of transporta- tion facilities; rationalization of land use; financing of urban facilities;
training of urban plarmers; provision of urban environment, and so on.
In any cases, because the Brazilian government has regularly adopted a program for urban policies approximately 10 years ago, the trend of population concentration in metropolitan area has continued as before, and more effort is necessary for the future urban administration progress.
3. THE PRtXHSS OF OOPULATION GfUWTH IN MEDIUM-SIZED CITIES
3 • 1 11IE PHENa1ENON OF OOPULATION OONCEN1'RATION
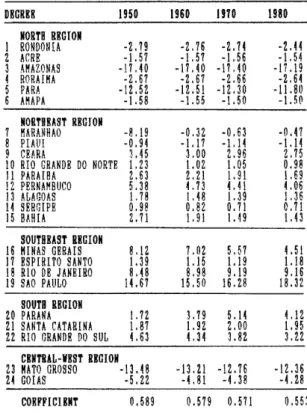
The regional distribution of population in Brazil is tmbalanced as men- tioned earlier. Here, for the study of regional dist,ribution of population it Has calculated, from the relationships bebveen population and area by states, the coefficient of population concentration (C) and the degree of population concentration (D) (table 1), based on:
C
=
1/2 Li: 1
D
=
(Xi - Yi) X 100 where:Xi population % of state "i" in relation to total population of tbe c(luntry;
Vi : area percentage of state "i" in relation to total area of the country.
As shm.,red in table 1 decreased from 0.589 in 1950
the coefficient of popUlation concentration has to 0.553 in 1980. Although it is a small decrease, the regional distribution of population in Brazil trends slightly to balanced or distributed situation. The same coefficient calculated to Japan
(12 regions) is 0.380 in 1980, and comparing this result H'ith the Braz'ilian' one it can be said that in Brazil the population concentration is relatively high.
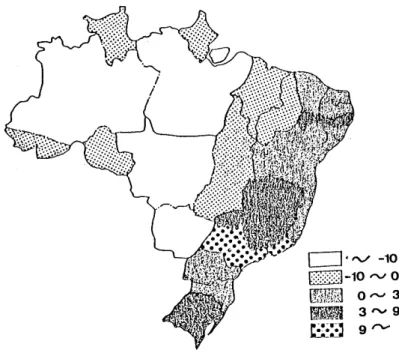
Moreover, according to figure 3, the degree of population concentration in Sao Paulo state is high and has presented an increasing value from 14.67 in 1950 to 18.32 in 1980. In the Rio de Janeiro state it was found a stagnated trend since 1970. On the other hand, in the states of Amazonas, Para and Mato Grosso the degree of population concentration are extremely 1m" without trans- formation trends.
3.2 PATTERN OF R>PUIATION GOOWllI
For the study on the trends in evolution of regional population, it {vas selected 33 cities as subject cities l"hich are over than 300,000 inhabitants in 1980, and population data was collected for the period 1950-1980 (table 2 , 3).
Table 1. Degree and coefficient of population concentration
DEGRER 1950 1960 1910 1980
NORTH RBGION
RONDOtHA -2.79 -2.76 -2.74 -2.44
ACRE -1. 57 -1. 57 -1. 56 -1. 54 AMAZONAS -17.40 -17.40 -17.40 -17.19
RORAIMA -2.67 -2.67 -2.66 -2.64
PARA -12.52 -1 Z. 51 -12.30 -11.80 AHAPA -1. 58 -1. 55 -1. 50 -1. 50 NORTH BAST RBGJON
MARANHAO -8.19 -0.32 -0.63 -0.47
PIAUI -0.94 -1.17 -1.14 -1.14
9 CEARA 3.45 3.00 2.96 2.75
IORIO GRANDE DO NORTE 1. 23 1. 02 1. 05 0.98 11 PARAIBA Z. 63 2.21 1. 91 l. 69 12 PERNAMBUCO 5.38 4. 73 4.41 4. 06 13 ALAGOAS 1. 78 1. 48 1. 39 I. 36
14 SERGIPE 0.98 0.82 0.71 0.71
15 BAHIA 2.71 1. 91 1.0\9 1. 43
SOUTHEAST RBGION
16 MINAS GERAIS 8.12 7. 02 5.57 4. 51 17 BSPIRITO SANTO 1. 39 1.15 1.19 1.18 18 RIO DB JANEIRO 8.48 8.98 9.19 9.16 19 SAO PAULO 14. 67 15.50 16.28 18.32
SOUTH RRGION
20 PARANA 1. 72 3. 79 5.14 4,12
21 SANTA CATARINA 1. 87 1. 92 2.00 1. 95 22 RIO GRANDE DO SUL 4. 63 4,34 3.82 3,22
CENTRAL-VBST RIG10II
Z 3 MATO GROSSO -13.48 -13.21 -12.76 -12.36 24 GO lAS -5.22 -4, 81 -4. 38 -4. 28 CORFFICIKNT 0.589 0.579 0.571 0.553
O·rv
-10[:::::8] -10 r v 0
tmm
t±e· • • .-.~•
Orv 3 3""9 9r"'\,;
Figure 3. Degree of population concentration in Brar;il (1980 1
Table Z • Population or cities over than 300,000 inhabitants
1950 1960 1910 198,0
1 SAO PAULO 2198096 3825351 5921796 8493226 2 RIO DE JANEIRO 2377451 3307163 4252009 5090700 3 BELl) HORrZONTE 352724 693328 1235001 1780855
4 SALVADOR 417235 655735 1007744 1501981
5 FORTALEZA 270169 514818 859135 1307611
6 RECIFE 524682 797234 1060752 1203899
7 FEDERH DISTRICT (D.F.) 0 141742 53749Z 1176935 8 PORTO ALEGRE 394151 641173 885564 1125477 9 NOVA rGlI~.cu 145649 359364 727674 1094805
10 CURITIBA 180575 361309 608417 1024975
11 BELEM 254949 402170 633749 933287
12 GOlANIA 53389 153505 381055 717526
13 CAMPINAS 152547 219303 376497 664559
14 MANAllS 139620 175343 312160 633392
J 5 SAO GONCALO 127276 247754 403349 615352 16 DUQUE DE CAXIAS 92459 243619 431345 575814 17 SANTO ANDRE 127032 245147 418578 553072
18 GUARULHOS 34683 101273 236865 532726
19 OSASCO 0 0 283203 474543
20 SAO LUIS 119785 159628 265595 449432
21 SAO BERNARDO DO CAMPO 29295 82411 201462 H5602
22 NATAL 103215 162537 26H67 416898
23 SANTOS 203562 265753 346096 416681
24 MACEIO 120980 170134 263583 399298
25 SAO JOAO DO HERITI 76462 191734 303108 398826
26 NITEROI 186309 245467 314367 397123
27 TERESINA 90723 144799 220520 3777H
28 CAMPOS 237633 292292 319112 348461
29 JABOATAO 57278 105261 201460 330414
30 JOAO PESSOA 119326 155117 22148 4 329942 31 RIBEIRAO PRETO 92160 147361 212300 318496 32 JUIZ DE FORA 126989 182481 238502 307525
33 LONDRI NA 71412 134821 228532 301711
TOTAL 9477816 15525127 24173073 34718918
BRAZIL 51944397 70191370 93139037 119002706
PBRCENTAGB 18.25% 22.12% 25.95% 29.17%
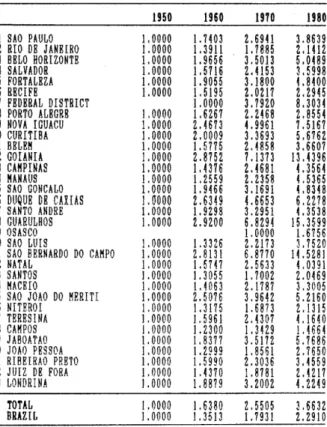
Table 3. INDn OF POPULATION GROWTH.
1 SAO PAULO 2 RIO DE JANEIRO 3 BELO HORIZONTE 4 SALVADOR 5 FORTALEZA 6 RECIFE
1 FEDERAL DISTRICT 8 PORTO ALEGRE 9 NOVA rGUACU 10 CURfTIBA 11 BELEM 12 GOIANIA 13 CAHPINAS 14 MANAlIS 15 SAO GONCALO 16 DUQUE DE CAXIAS 17 SANTO ANDRE 18 GUARULHOS 19 OBASCO 20 SAO LUIS
21 SAO BERNARDO DO CAMPO 22 NATAL
23 SANTOS Z4 MACErO
25 SAO JOAO DO HERITI 26 NITERO I
27 TERESINA 28 CAHPOS 29 JABOATAO 30 JOAO PESSOA 31 RIBEIRAO PRETO 32 JUIZ DE FORA 33 LONDRINA
TOTAL BRAZIL
1950 1.0000 1.0000 1.0000 1.0000 1.0000 1.0000
\ .0000 1. 0000 1.0000 1.0000 1.0000 1.0000 1.0000 1.0000 J .0000 1.0000 1.0000 1.0000 1.0000 1.0000 1.0000 1.0000 1.0000 1.0000 1.0000 J .0000 1.0000 1.0000 1.0000 1.0000
\.0000 1.0000 1.0000
1960 1. 7403 1.3911 1.9656 1 .5716 1. 9055 1.5195 1.0000 1.6267 2.4613 2.0009 1.5775 2.8752 1. 4376 1.2559 1.9466 2.6349 1.9298 2.9200 1.3326 2.813!
1.5747 1. 3055 1. 4063 2.5076 1.3175 1.5961 1. 2300 1. 8377 1.2999 1. 5990 1.4370 1. 8879 1.6380 1. 3513
1910 2.6941 1.1885 3.5013 2.4153 3.1800 2.0217 3.7920 2.2468 4.9961 3.3693 2.4858 7.1373 2.4681 2.2358 3.1691 4.6653 3.2951 6.8294 1.0000 2.2173 6.8770 2.5633 1. 7002 2.1787 3.9642 1. 6873 2.4307 1. 34 29 3.5172 1.8561 2.3036 1.8781 3.2002 2.5505 1.1931
1980 3.8639 Z .1412 5.0489 3.5998 L8400 2.2945 8.3034 2.8554 7.5167 5.6762 3.6607 13.4396 4.3564 4.5365 4.8348 6.2278 4.3538 15.3599 1.6756 3.7520 14.5281 4. 0391 Z.0469 3.3005 5.2160 2.1315 4.1640 1. 4664 5.7686 2.7650 3.4559 2.4 Z 17 4.2249 3.6632 2.2910
In 1950, 18.25% of total population was concentrated in those 33 cities (at t,hat year, Brasilia and Osasco Here not city). Hm .. ever in 1980 that per- centage grew to 29.17%. During that period while the total population of Brazil increased 2.29 times, the 33 cities increased 3.66 times. The high in- crease rates are pa,rticularly presented by Goiania, Guarulhos and Sao Bernardo. C,J()ianja is a state capital cit.y, but Guarulhos and Sao Bernardo are suburban citi.es. On the other hand, Campos and Juiz de Fora which are regional cities presented a low grm"th rate.
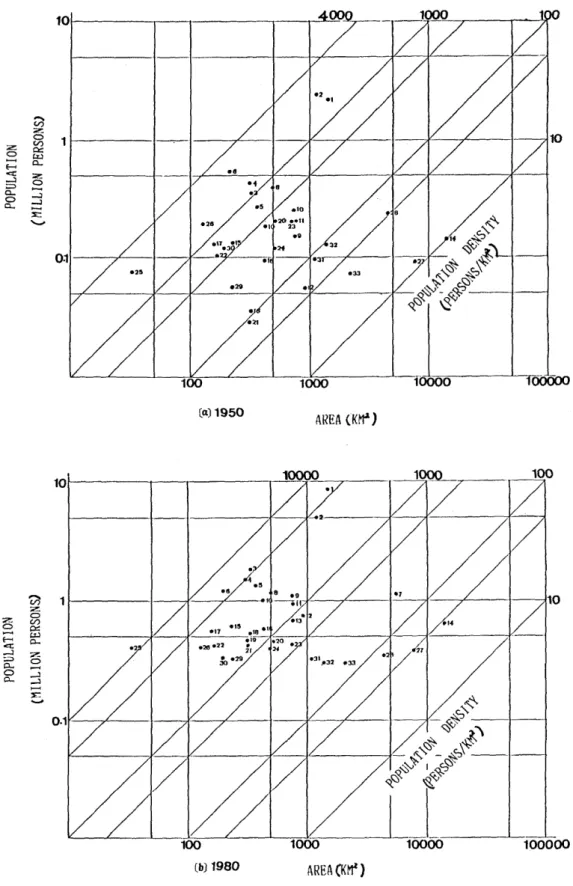
Figure 4 (a)(b) show the relationships between population and area. There are the trends of relative grm-rth of population, and increase of population densities, Hhere the increase is notable especially in Sao Joao do Meriti and Recife.
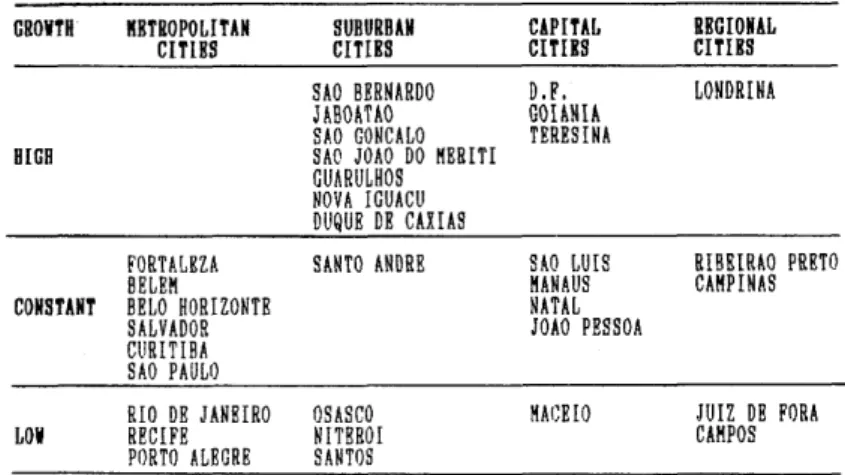
FolloHing, the 33 cities were classified based on their urban location as metropolitan cities, metropolitan-suburban cities, capital cities (capital of
-
z V)
0 :z V)
0 Q::
... Cz.) E-< a...
<t: :z
--J 8
~ a... --J
0 -.J
a...
~
'-"
0:1
(el) 1950
AREA (Kna)
100
~ ;z: 1 z 0 CI)
a p:::
..-. W E-< 0- ct:
--J 7-
;;:> 0
a... ...
0 ,....:l
0- ,....:l
...
~
100 1000 10000 100000
(b) 1980 AREA(K~)
Figure L Re tali onsh ips between population and area
states and country), and regional cities, and their relationships with popula- tion"growth are presented in the table 4. From that table the high population growth of suburban cities becomes clear and the generation of metropolitan problems can be estimated. On the contrary, relatively low growth rates are presented by capital cities and regional cities.
Tab1 e 4. Classi ficlI.tion of cities b1 urban location and population growth.
GROWTH KRTROPOLITAN
HIGH
CITlRS
FORTALKZA BELEM CONSTANT BELO HORlZONTE
SALVADOR CURITIHA SAO PAULO RIO DE JANEIRO
LOW RECIFE
PORTO ALEGRE
SUBURBAN CITIES SAO BERNARDO JABOATAO SAO GONCALO SAO JOAO DO HERITI GUARULHOS NOVA IGUACU DUQUE DE CAllAS SANTO ANDRE
OSAseo N fTERO I SANTOS
4. TRANSF'Om1ATION ON THE INDUSTRIAL CCM£-QSITION 4 • 1 INDUS'IRIAL ~IT JON OF BRAZIL
CAPITAL CITnS D. F.
GOHNIA TERES INA
SAO LUIS MANAUS NATAL JOAO PESSOA
MAGEIO
REGIONAL CITIBS LONDRINA
RIBElRAO PRETO CAMP INAS
JUIZ DE FORA CAMPOS
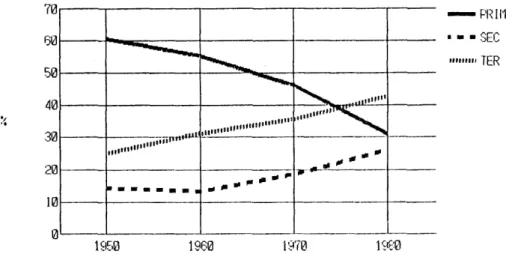
The industrial composition of Brazil is characterized by its rapid con- version from primary society to secondary and tertiary society. Figure 5 shows the evolution of economically active population for the main industrial sectors, during the period of 1950-1980 and indicates that Brazil has ac- celerated it.s decrease of primary sector from 60% in 1950 to 30% in 1980, and it Has predominantly an agrarian country lfitil 1975 to becomes an t,ertiary- industrial society in 1980. The trends of grOlvth in tertiary sector has been relatively constant, but the secondary sector suffered a sudden shift in 1960.
The history of industrialization in Brazil begins in the end of XIX's which was propitiated by the success of coffee in the Horld market. During the bm world \...rars Brazil suffered a
trend ""hen the importation int.errupt.ed.
subst.antial progress in of industrialized goods
industrialization from Europe Has Hmvever from the early 60's Brazil has accelerated its industrialization rate by implementation of the Plan of Goals (Plano de Metas 1956-1961) during t.he govern of Kubit.chek president. That plan was characterized as folloHing:
a. Grm"th in the energy supply;
b. Expansion of transportation network;
c. GroHth of food production by agricultural mechanization;
d. Promotion of heavy and chemical industry;
e. Formation of skilled labor work.
The implementation of such a plan brought deep conseqtlences to the country. First of all, the mechanization of the country side; the increasing opportunities for job and education in the urban centers; and the expansion of transportation linkages betweeIl rural aIld urban areas generates the tradi- tional push-pull factor of internal migration. Consequently, the transforma- tion on the industrial composition in the major cities was notable.
70 -FHII1
• • • SEC
---... ~
~
~
.",.1111'"J'r'~
'11111111,'11111'"1111111111
""
,II ,.' II Tn'"'''' - - - - -
11 ••• 11' ' ' ' iii ",.
,.,--
.. ,..
¥---..
",..
-.- ... .. "
"'''1111 TER 50
40
30 2010 -
o
I1960
Figure 5. Kvol ution on the percentage of econolically acli ve population (aajor sectors I
., • 2 INDUSTRIAL ~ITION OF M1\JOO CITIES ., .2. 1 FUNGrIONAL CHARAC7ERISTICS
The 33 largest cities (over 300,000 inhabitants) Here taken as subject for study, and it Has collected data concerning to economically active popula- tion (over than 10 years old) for each major industrial sector (primary, secondary, and tertiary sector).
Those cities, as described earlier, have rapidly concentrated the na- tional population, so it is natural that the percentage of employed person Has increased in the same way. In fact, 26.26% of employed person Has in those
cities in 1970 ~ld this share increased to 31.30% in 1980. Among those 33 cities, the metropolitan cities and suburban cities had 22.39% of national economically active population in 1970, and increased to 25.79% in 1980. On the other hand, the capital cities and regional cities, i.e., the medium-sized cities had 3.88% in 1970, and increased to 5.50% in 1980. 'fhis fact shows the increasing concentration of jobs in those 33 cities, particularly in the metropolitan area.
HOl.J'ever, the qualitative characteristics of those large cities in terms of industrial composition are different and have their own peculiarity in terms of changing composit.ion of each industrial sector. So, this section in- tend to consider such a matter.
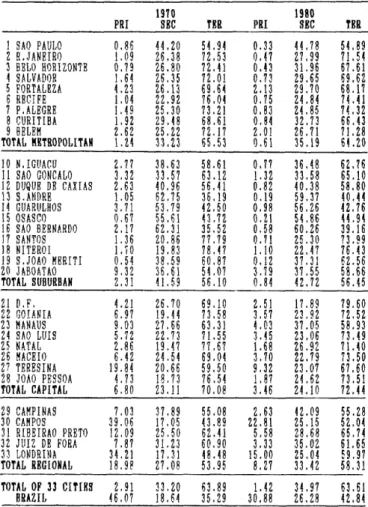
Table 5. Industrial cOllpoRi tion of cities over than 300,000 inhabitants.
1910 1980
PRI SHC TKR PRI SHC TRR
1 SAO PAULO 0.86 44.20 54.94 0.33 44.78 54. 89 2 R •. JANEIRQ 1. 09 26.38 72.53 0.47 27.99 71. 54
j BELO HORIZONTE 0.79 26.80 72.41 0.4 j 31. 96 67.61 4 SALVADOR 1. 64 26.35 72.01 0.73 29.65 69.62 5 FORTALRZA 4. 23 26.13 69.64 2.13 29.70 68.17 6 RECl FE 1. 04 22.92 76.04 0.75 24. 84 74.41 7 P. ALEGRE 1. 49 25.30 73.21 0.83 24. 85 74.32 8 CURITIBA 1. 92 29.48 68.61 0.84 32.73 66.43
9 BELEH 2.62 25.22 72.17 2.01 26.71 71. 28
TOTAL METROPOLITAN 1. 24 33.23 65.53 0.61 35.19 6!. 20 ION. IGliACU 2.77 38.63 58.61 0.7? 36.48 6 Z. 76 11 SAO GONCALO 3,32 33.57 63.12 1. 32 33.58 65.10 12 DUQUE DE CAXIAS 2.63 40.96 56,41 0.82 40.38 58.80 13 S. HlDRE 1. 05 62.75 36,19 0.19 59.37 40.44 14 GUARULHOS 3.71 53,79 42.50 0.98 56.26 42.76
15 OSASCO 0,67 55.61 41.72 0.21 54. 86 44.H
16 SAO BERNARDO 2,17 62,31 35,52 0.58 60.26 39.16 17 SANTOS 1. 36 20,86 77.79 0.11 25.30 73.99 18 NITEROI 1. 70 19.83 78.47 1.10 22.47 76,43 19 S. JOAO MBRIT! 0.54 38.59 60.87 0.12 37,31 62.56 20 JABOATAO 9,32 36,61 54,07 3.79 37.55 58.66 TOTAL SUBURBAN Z,31
n
.59 56,10 0.84 42.72 56,4521 D. F. 4. 21 26,70 69,10 2,51 17,89 79,60
22 GOIANIA 6.97 19.44 73,58 3,57 23,92 72.52 23 HANAUS 9.03 27,66 63.31 4. 03 37.05 58.93 24 SAO LUIS 5.72 22.73 71. 55 3.45 23.06 73,49 25 NATAL 2.86 19.47 77,67 1. 68 26.9Z 71. 40 26 ~ACEIO 6.42 24. 5 4 69.04 3.70 22.79 73.50 27 TERESINA 19,84 20.66 59.50 9,32 23,07 67.60 28 JOAO PESSOA 4. 73 18.73 76,54 1. 87 24. 62 73.51 TOTAL CAPITAL 6.80 23.11 70.08 3.46 24.10 72.44 29 CAHPINAS 7.03 37.89 55,08 2.63 42.09 55.28 30 CAMPOS 39.06 17. 05 0.89 22.81 25.15 52.04 31 RIBElRAO PRETO 12,09 25.50 62.41 5.58 28.68 65.74 32 JUIZ DE FORA 7.87 31. 23 60,90 3.33 35.02 61. 65 33 LONDR INA 34.21 17.31 48.48 15.00 25.04 59.97 TOTAL REGIONAL 18,98 27. 08 53.95 8.27 33,42 58,31 TOTAL OF 33 CITIES 2.91 33.20 63.89 1. 42 H.97 63,61
BRAZIL 46.07 18.64 35,29 30.88 26.28 42.84
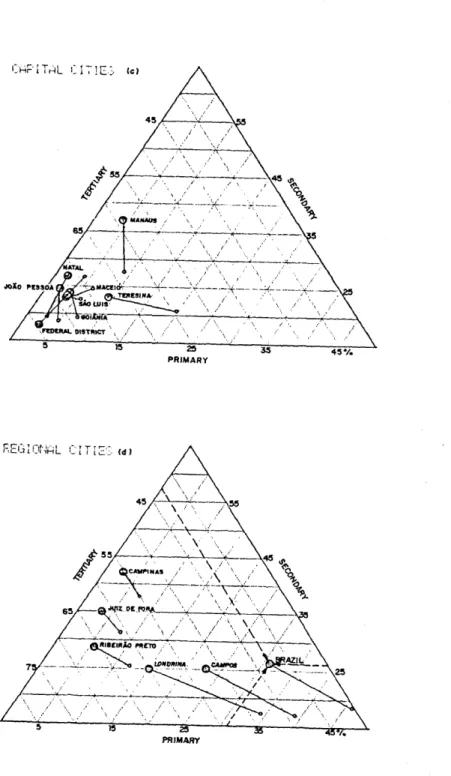
Based on table 5 the results for the groups of metropolitan cities, subur- ban cities, capital cities, and regional cities were plotted in the figure 6
(a)(b)(c)(d) for the period 1970-1980. The functional characteristics for each groups can be roughly understood as follow:
NETROPOLITAN CITIES: Sao Paulo as the national industrial metropolis, and the others as tertiary-industrial metropolis.
SUBURBAN CITIES: here we have 3 clusters of cities:
a. Industrial ci ties at the suburbs of Sao Paulo;
b.
Secondary-tertiary cities at the suburbs of other metropolises;c. Tertiary cities with special functions like Santos (harbor city) and Niteroi (former capital of Rio de Janeiro State with its remained administra- ti ve flillctions).
CAPITAL CITIES: as tertiary centers wi th exception to [vIanaus wl~ich was estab- lished as free-market zone in 1967, and where has experienced a high degree of industrialization based on the settlement of foreign large-sized industry.
REGIONAL CITIES: this group of cities is characterized by its dynamics in terms of industrial composition shift. They have rapidly decreased their primary shares and their changes represent the trend presented by the average for the country, i.e., moving tendency from agricultural society to secondary- tertiary society.
" • 2 • 2 TRENDS IN FUNCrIONAL CHARACTERISTICS
To analyze the transformation on the functional characteristics it was calculated the variation on the percentage of each industrial sector (Pi), and foIloHing the j ndex of variation (V) l"'as calculated (table 6) based on:
3 V = L
i :1
Pi (I til) - Pi ( I ' HI
I
Based on table 6, all cities have decreased their primary percentage par- ticularly in Londrina(-19.21%) J Campos (-16.25%), and Teresina(-lO.52%). The high positive variations in secondary sector are presented by [vIanaus (+9.34%), Campos (+8.10%), Londrina (+7.72%), and Natal (+7.45%). And, the high positive variations in tertiary sector are in Londrina (+11.49%), Federal District ( + 10.50%), Campos (+8. 16%), and Teresina (+8. 10%). All above mentioned ci ties are regional cities or capital cities, showing that the major changes on the
industrial composition have occurred in non-metropolitan cities.
~
1.:t:::::f" .L '.~ ... ft-I1970
~~--~----~~---I~,'45 ~
-~--*'-i~-~~0"
\ / \,'" \, .. ",l \.~l" ... l\.
,..'\, .I ... .
...
PRIMARY
",_",, ,.,/ .. "' .
",
SUEUF::8Af'1 CIT I E·~· (bl
.
.." /\,••• / ' \ \ " \ \ I
\;' '" / \./ :35
,.l ./'\~'" , •• 1.' ... , / ' \. i
\ ! . . !
" .. l I, .. \. ". ,,/ \" ,/
/ .... , . ... '\
\" ,,' ,""
... \".\.. ., .. l
.",'
2S PRIMARy'
(HF'1 Tt~l (1 ~-l C·; tc)
15
PRIMARY
FECi I Of',iAL CIT r
c:::
15
PRIMARY
Figure 6. Trends on the industrial co.position
Table 6. Variation on the i nduslrial co.posi lion and index of variation
VAIlIATION INDKI OF PRI SEC TEll VARIATION {V) 1 SAO PAULO -0,53 0.58 -0.05 l.16 2 R.JANEIRO -0,62 1. 60 -0,99 .1. 20 3 BELO HORIZONTE -0,36 5,17 -4,80 10,33
4 SALVADOR -0,91 3.30 -2,39 6.60
5 FORTALEZA -2,10 3.58 -1. 47 7.15 6 RECIFE -0.29 1. 92 -1. 62 3.83
7 P. ALEGRE -0.67 -0,45 1.11 2,23
8 CURITIBA -1. 08 3.25 -2.11 6.50
9 HELEM -0.61 1. 49 -0.88 2.98
TOTAL KRTROPOLlTAIf -0.63 1. 96 -1. 33 j.92 10 N,IGUACU -2.00 -2.15 4,15 8.30 11 SAO GONCALO -2,00 0.01 1. 98 3.99 12 DUQUE DE CAXIAS -1. 82 -0.57 2.39 4. 78 13 S. ANDRE -0.86 -3.38 4,24 8.48
14 GUARULHOS -2.73 2.47 0.26 5.H
15 OSARCO -0,46 -0.75 1. 22 2,43 16 SAO BERNARDO -1. 59 -2.05 3,64 7. 28
17 SANTOS -0,65 4.44 -3,79 8.88
18 NITEROI -0,60 2,64 -2.04 5.28
19 S, JOAO KERITI -0,42 -1. 28 1. 69 3,38 20 JAAOATAO -5,53 0.94 4. 59 11. 06 TOTAL SUBURBAN -1,47 1.13 0,34 2,95
21 D, F. -1.10 -8.80 10.50 21,00
22 GOIANIA -3,41 4,47 -1. 06 8.94 23 HANAUS -5.01 9,39 -4. 38 18,78 24 SAO LUIS -2.21 0,32 1. 94 4. 53
25 NATAL -1.18 7,45 -6.27 14.90
26 MACKIO -2.7Z -1. 75 4. 46 8.93 Z 7 TERESINA -10.52 2.42 8.10 21. 04 28 JOAO PESSOA -2.86 5.89 -3,04 11. 79 TOTU, CAPITAL -3,35 0,99 2,35 6,69 29 CAHPINAS -4. 40 4,20 0.20 8.81
30 CAMPOS -16,25 8.10 8.16 32,50
31 RIBEIRAO PRETO -6,50 3,18 3.32 13,01 32 Jurz DE FORA -4. 5 4 3.19 0,75 9,08 33 LONDRINA -19,21 7,72 11. 49 38.42 TOTAL IlEGIONAL -10,71 6,34 4. 36 21. 42 TOTAL FOil 33 CITIRS -1. 49 1. 71 -0,28 3.54
BRAZIL -15,19 7,64 7,55 30,38
Finally, the 33 cities ~~ere classified by their changing character (based on index of variation) and by their urban location. Table 7 shows that the majority of metropolitan cities are stagnated, suburban cities have medium changes, and non-metropolitan (capital and regional) cities have high degree of change.
IKDBI CITlES CITIES CITrRS CITIBS SAO PAULO SAO GONCALO SAO LUIS
R[O DE JANEIRO DUQUE DE CAllAS
LOll RECIFE OSASCO
V(:5 PORTO ALEGRE SAO JOAO DO MERIT[
SALVADOR GUARULHOS GO I ANIA JUIZ DE FORA
FORTALEZA SANTOS HACEIO CAHPINAS
KEDIUK CURITlBA NITERO I
5(V<10 NOVA IGUACU
SANTO ANDRE ShO BEP.~!ARDO
BELO HORl ZONTE JABOATAO HANAUS CAMPOS
HIGD JOAO PESSOA RIBEIRAO PRETO
V):lO NATAL LONDRINA
TERBSINA D.F.
5. OONCLUSlOO AND FUR'I'HER STUDIE'S
As a preliminary consideration on the research of methodology for promo- tion of medium-sized cities, this paper studied the evolution of urban popula- tion and transformation of industrial composition. As the result, the follmv- ing points become clear:
a . The subject concerning to the problems on the Brazilian metropolitan concentration of population is related to 1mbalanced distribution of popula-
tion on the national terri tory, rapid grmvth of urban population, composition of population , and so on. And since 1975 the CNDU has established development strategies for classified cities for solving the above mentioned problems, but a satisfactory result has not appeared yet.
b. Based on the analysis of the coefficient and degree of population concentration, the national concentration trends to stabilize having Sao Paulo as extremely concentrated metropolitan area. As the result, the suburban cities of metropolitan area has in a process of rapid population growth.
c. From the analysis on the industrial composition, Brazil is rapidly changing its character having the metropolitan area of Sao Paulo as its major industrial region. Numerically speaking, the high grmvths of economically ac- tive population are in the metropolitan and suburban cities, but the high changes on the industrial composition are in non-metropolitan cities.
For the future it is rlecessary to match the linked problems of Brazilian cities in order to continue the analysis on the process of urban formation.
And for this purpose it is necessary to analyze the indicators concerning to transportation by collecting data related to inter-cities traffic.
REFERENCES
1. MJNBEIG, Pierre (1976), tiLE BRESIL", Collection Que Sais-Je?, No.628.
2. KOKUSAI KAlHATSU CENTER (1980), "MINAMI AMERICA CHIIKI UNSO KEIZAI CHOSA".
3. BAMT, Josef (1982), "THE FINANCING OF URBAN DEVELOFMENT IN BRAZIL", Third World Planning Review, vol.4, No.2.
NOTE
(1) In Brazil "favela" means a particular Idnd of shun which is characterized by squatter nature.