ABSTRACT
The present article presents a preliminary report on a case study of two adult Japanese learners of English learning to improve their English pronunciation ability through a pronunciation training program. They were specifically trained on the use of prosody (i.e., pitch, duration and intensity) to differentiate stressed and unstressed syllables in words, phrases and sentences. The results of four diagnostic tests showed that the participants were able to improve the ability to use a wider pitch range to mark stressed syllables. Some individual differences were observed, however, as two participants differed in the way improvement occurred at different task conditions (i.e., the reading task and the story telling task). Suggestions regarding some current issues on effectiveness of pronunciation training are discussed.
key words; pronunciation training, nonnative speech production, prosody, pitch, stress 1. Introduction
Most of foreign language instructors would agree that it is necessary for speakers speaking a nonnative language to speak with a certain level of correctness in pronunciation in order to make their utterances intelligible and comprehensible to the listeners. Indeed, previous research(Derwing & Munro, 1997)has indicated that the degree of accentedness is significantly related, although not equivalent, to intelligibility(the extent to which a listener understands an intended message)and comprehensibility(a listener’s judgment, or perception of how difficult or easy an utterance is to understand). In recent years, however, there has been increasing recognition among L2(second
A case study: a preliminary report on the effects
of English pronunciation training on the use of
pitch in the reading and the story telling task
language)researchers and instructors that the aim of pronunciation learning is not to attain a native-level pronunciation ability, but to learn the phonetic/phonological core of the target language that is minimally required for a reasonable level of intelligibility in communication(Jenkins, 2000). Regardless of the ultimate aim of pronunciation learning, however, it is of great importance for learners especially at a basic level to attain a certain level of pronunciation ability to get across the intended meanings to the listeners.
There has been a great deal of research conducted to delineate factors that influence phonetic/phonological learning of a nonnative language. Previous research has indicated that pronunciation learning is influenced by a number of factors, including 1)age of the learners, 2)the relation between a native language and the target language, 3)quality and/or quantity of daily input of the target language, 4)quality/quantity of formal/ informal nonnative language instructions received, 5)sociolinguistic factors such as the learner's attitude toward the target language, and 6)psychological factors such as aptitude for learning a new language (cf. Celce-Murcia, Brinton, & Goodwin, 2010).
In learning situations where the target language is not used for daily communication, formal or informal instruction at an educational institution plays a vital role for phonetic/ phonological learning. Especially, a pronunciation training program designed specifically for nonnative pronunciation learning may be one of the most effective ways to improve learners’ pronunciation ability. Regarding the effectiveness of pronunciation training, previous research has addressed several important issues (Derwing & Munro, 2005; Flege & Hillenbrand, 1984; Morley, 1987; Nava & Tepperman, 2010; Saito, 2012). The first issue concerns whether pronunciation programs are actually effective in significantly improving learners’ nonnative pronunciation abilities. Saito(2012)reviewed 15 previous studies that examined degree of improvement in learners’ pronunciation ability before and after the intervention programs. He concluded that, given adequate amount of time, such a program is generally effective in modifying the learners’ pronunciation ability. The second issue is whether the training should focus on the prosodic level(e.g., intonation, rhythm, stress)or the segmental level(e.g., consonants, vowels). There is evidence(Derwing, Munro, & Wiebe, 1998)to suggest that training on prosody leads to improvement not just in pronunciation in tasks that do not require spontaneous speaking (e.g., reading) but also in spontaneous speaking task(e.g., narratives). There is a growing consensus, however, that the two aspects of speech are both important and should be integrated into a coherent training program(Celce-Murcia, et al., 2010 ; Fraser, 2001). The third issue involves whether pronunciation should be taught using contextualized sentences
in communicative settings(cf. “focus on form: FonF)”), or using decontextualized tasks such as repeating phonemes, syllables or words (“focus on forms: FonFS ; see Saito (2012)for discussion on the issue). Recent research has supported the conclusion that pronunciation training in the communicative framework is more likely to result in greater intelligibility in communicative situations than training using decontextualized materials. The fourth issue concerns the role perception training should play in pronunciation training. There is a great deal of evidence in the literature that indicates a link between L2 perception and L2 production ability(Bradlow, Pisoni, Akahane-Yamada, & Tohkura, 1997 ; Tsushima, 2008). Previous research has shown, for example, that training in L2 perception ability alone results in improvement in L2 production ability, suggesting that L2 perception ability may form a basis for development of L2 production ability. On the other hand, there is also evidence that the order of training does not make significant differences in the level of achievements(Tsushima, 2008). At present, available evidence is not enough to draw firm conclusions for these issues.
Most of the previous research has used group data to make some generalizations about the effectiveness of a particular training method. On the other hand, previous research has provided ample evidence that there is a great deal of individual variability in the way L2 learners learn different aspects of pronunciation ability(Hu, et al., 2012). First of all, nonnative learners show different levels of pronunciation ability at the segmental level(i.e., phoneme, syllable and word)and the prosodic level(i.e., stress, intonation and rhythm). For example, some learners might show relatively good production ability in terms of phonemes, while they might be relatively poor in producing prosodic characteristics of the target language. Even within each level, individual learners show different patterns of production difficulty(Tsushima, 2008). In production of an American /r/ by Japanese learners, for example, some might have difficulty producing the phoneme when it is followed by a vowel, /i/ (i.e., /ri/), while some others might show difficulty when it is followed by a vowel, /o/(i.e., /ro/). Second, individual variability is also observed regarding perception and production ability. For example, some L2 learners show relatively good ability to perceive a certain phoneme(e.g., /r/), while they show poor production ability, while the same learners show a reversed relation(i.e., poor perception and relatively good production) for some other phonemes(Goto, 1971; Tsushima, 2008).
Given the degree of individual differences attested in the literature, it appears desirable to conduct rather detailed examination of individual L2 learners in order to
gain full understanding of production and perception ability and how they improve with learning. To the best of the author’s knowledge, little research has longitudinally examined improvement of L2 learners' pronunciation ability at different linguistic levels for a long period of time. The present research was set out to provide longitudinal data of L2 production learning by two adult Japanese learners of English. The two participants have received perception and production training for approximately half a year, and it is planned to continue for another half a year at the time of writing this paper. They received face-to-face training once a week by the author, and did perception training and production practice at home. Four diagnostic tests were given over the course of half a year. In each test, their utterances were elicited in four different tasks that required different task demands(i.e., the reading task, the story telling task, a spontaneous short speech and free conversation). Their utterances were also recorded during the training sessions. The present report presents the first preliminary data, focusing on the prosodic aspects of the learners’ productions in the reading task and the story telling task.
Previous research has provided evidence that training focused on prosody can effectively improve the use of the target feature in the learners’ pronunciation(Binghadeer, 2008; Couper, 2006; Nagamine, 2011). Nagamine(2011), for example, focused on training the ability to use a range of pitch and duration to differentiate stressed and unstressed syllables in English. Using “Hyper-Pronunciation Training Method” where pitch contours and duration are initially exaggerated, the training successfully allowed the learners to widen the pitch range. Following this study, the present study measured the pitch rage of the participants’ utterances at different linguistic levels(i.e., the lexical and phrase/clause level) in two different task conditions(i.e., the reading task and the story telling task).
The following questions were asked for the data analyses.
(1) Did each participant improve the use of pitch at a lexical and a phrase/clause level under the different task conditions through the training sessions?
(2) If yes, how did the improvement occur in each task condition, and how did it interact with the two task conditions?
2. Method 2-1. Participants
Two participants were the third-year university students in the faculty of business administration at a private university in Tokyo. They were recruited by the author from
an English class the author was in charge of in the academic year of 2012. One participant (called PA henceforth)was 20-year-old female and the other, 21-year-old male(called PB henceforth). Their English ability could be categorized as intermediate in terms of their overall English ability, as demonstrated by their TOEIC scores. Their fluency level was not so high, as they had to put a number of long pauses between sentences and phrases in their spontaneous productions. Their utterances had basic syntactic structures which were mostly correct, but had occasional grammatical mistakes such as tense and agreement.
Both participants showed a high level of motivation to improve their English abilities in general and their pronunciation ability in particular. They recognized that English ability was important for their future job, but they appeared to enjoy learning English and talking with people in English. PA goes to a private English speaking school once a week. PB takes a course to improve his TOEIC score.
2-2. Diagnostic Test
The diagnostic test consisted of four parts. In the first part, the participants were asked to read a passage, which is taken from Teaching Pronunciation(Celce-Murcia, et al., 2010, Appendix 16, p.481). In the second part, they were asked to tell a story after looking at an illustrated story sequence of four pictures taken from Teaching Pronunciation(Celce-Murcia, et al., 2010, Figure 8.10, p.315). In the third part, they were
asked to talk about one of the familiar topics, including my family, my hometown, my hobby, my favorite memory of a trip, my favorite town and my favorite person. In the last part, they were asked to engage in free conversation with the author(except for the first test where PA and PB had conversation).
A high-quality microphone was placed approximately 20 cm from the mouth of the speaker. The utterances were recorded by a PCM recorder at a resolution of 16 bits with a sampling rate of 44.1 Hz. With sound analysis software, AcousticCore8(Arcadia), the recorded sounds were low-pass filtered at 10,000 Hz, and then normalized. Then, fundamental frequencies(i.e., F0)of all the utterances were extracted and saved.
The results of the initial diagnostic test showed the following. Even in the reading task, both PA and PB had difficulty using prosody to differentiate stressed and unstressed syllables in phrases and sentences, which resulted in sentences characterized by relatively flat pitch movements, typically observed among adult Japanese learners of English. These characteristics revealed themselves more acutely in the spontaneous speaking tasks. PA
also showed a tendency to add an extra vowel to a final consonant(e.g., /t/ in “flat”), which is also common among beginning Japanese learners of English. At the segmental level, PA had difficulty producing /r/, but much less with /f/, /v/ or voiced and unvoiced /th/. However, she had difficulty producing vowels not found in Japanese such as schwa. PB had difficulty producing /r/, /f/, /v/ and voiced and unvoiced /th/, as well as vowels. Both participants also took a diagnostic test in SPATS:ESL. The results showed that both of them had a great deal of difficulty perceiving difficult-to-pronounce phonemes including /r/, /v/, and central and low-back vowels.
Based on the results, it was decided to conduct production training focusing on the prosodic level for the first several weeks(i.e., up to DT3)while perception training on the segmental level was conducted during the same period.
2-3. Description of Training
The training sessions started in the middle of March, 2013. Diagnostic tests were held on the first day of the sessions, at the beginning of May, in the middle of June and at the end of July. A face-to-face training session was held, on the average, once a week. The interval between the sessions for PA ranged from two days to twelve days, and 6 to 14 days for PB. In total, 16 and 15 sessions were held between the first and forth diagnostic test, for PA and PB, respectively. One session usually lasted 45 to 90 minutes, and was held at the author’s office.
The ultimate goal of the training was to develop the ability to produce utterances with an accepted level of intelligibility and comprehensibility for nonnative as well as native listeners in spontaneous conversation. The training program followed the “cognitive approach” to teaching pronunciation in which efforts were made to first modify the knowledge of the learners, and then encourage them to apply that knowledge to practicing the target structure(Fraser, 2001, 2006). It also followed a view that pronunciation training should put equal importance to both the prosodic and segmental level(Derwing, et al., 1998 ; Fraser, 2001). Using the materials in “Syllable Stress” in American Accent Training(Cook, 2000, pp.19-22)and units 21 to 37 in English Pronunciation in Use, Intermediate(Hewings, 2007), the notion of syllable and accent was introduced to the learners. The topics of these units include 1)introduction of syllables/ word/sentence stress, 2)consonant clusters at the beginning and end of words, 3)stress in two-syllable, compound and longer words, and 4)unstressed words. The training was intended to teach the participants the knowledge about English stress patterns and
how they are realized in producing speech. Especially, they were taught to use pitch movements, duration and intensity to mark the stressed syllables.
A single training session consisted of the following activities. First, the target structure was introduced and explained in simple English, and was practiced using repeating tasks(e.g., repeating after a model on CD or the instructor). The participant’s utterance was recorded and immediately played back so that he or she could check on the correctness in terms of prosody. The materials for practice included words, phrases, sentences, a dialogue and a passage. Efforts were made to practice the target structure embedded in relatively large contexts such as a dialogue and a passage as much as possible. In this sense, the teaching methodology was on the side of FonF(as opposed to FonFs)discussed above, except that it did not involve activities that required spontaneous speech(e.g., debate, speech).
Another activity involved reading practice where the participants read aloud a paragraph from a penguin book of their choice. They practiced reading a passage paying attention to the prosodic aspects(i.e., stress and intonation)of the utterances.
At home, both PA and PB received perception training using a computerized speech perception training program called SPATS-ESL(Communication Disordered Technology, Inc.). They were trained on perception of difficult-to-perceive English consonants and vowels.
Following DT3, PA received training on production of /r/ and consonant clusters, while PB received training on production of /th/. Although segmental production was the focus of training during this period, the participants were encouraged to pay attention to prosody as well as the targeted phoneme.
2-4. Analyses Procedure for the Diagnostic Tests 2-4-1. Reading Task
For the phrase/clause level analyses, the following five phrases/clauses were chosen for analyses. The phrases in parentheses were those analyzed.
(1)(There are a couple of answers)to this question.
(2) We also know that older learners usually have an accent,(though some older individuals also have learned to speak)without an accent.
(3) (They can also identify Spanish or Arabic speakers)over the telephone just by listening carefully to them.
(5) (You also need accurate information about English sounds), effective strategies for practice, lots of exposure to spoken English, and patience.
The focus of the present analyses was to examine how pitch changes occurred within a clause at a non-sentence-final position. Each phrase/clause has more than one prosodic unit and has more than one stressed syllable. Previous research has demonstrated that, in English, a stressed syllable is marked by combination of higher pitch, longer duration and larger intensity than an unstressed syllable(e.g., Beckman, 1986). It is known, however, that Japanese leaners of English have a strong tendency to use pitch to mark stressed syllables. It was thus decided to examine the degree of pitch movements as a primary indicator of stress assignments by the participants1). Within each target clause, the
highest and lowest F0 values were recorded.
For the lexical-level analyses, the following eight words were chosen for analyses; accent, factor, perfect, pronunciation, combination, accurate, exposure, and decision. These words were chosen such that the number of syllables in a word and the position of a stressed syllable varied across the target words. The number of syllables ranged from one to four, while the stressed syllable was on the first, second, third or fourth. Within each word, the highest and lowest F0 values were recorded.
2-4-2. Story Telling Task(an illustrated short story)
Each participant produced a different story in this task. Phrases or clauses at a non-sentence-final position were chosen for analyses for each participant. For PA, the following were analyzed ; one day, a man, three children, in the night, a few minutes, after that, at night, he can't sleep, I'll stay awake. For PB; it is time, a man, three children, in the night, some animals, one day, one man, about nightmare, after you are sleep, calm down, dangerous animal, to picnic, on the other hand, it is difficult. One particular phrase(e.g., a man, three children)was produced and analyzed several times within one story. Within each phrase/clause, the highest and lowest F0 values were recorded.
For the lexical-level analyses, the word, children, was chosen for analyses as it was produced more than once across tests and participants. PA produced it three times in the first diagnostic test (DT1, henceforth), twice in DT2, three times in DT3 and twice in DT4. PB produced it five times in DT1, four times in DT2, three times in DT3 and four times in DT4. The number of production was not large, but it was of interest to see whether there was some trend in the data. Within the word, the highest and lowest F0 values were recorded.
3. Results 3-1. Reading Task
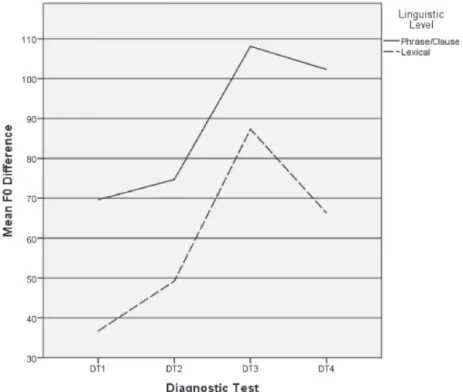
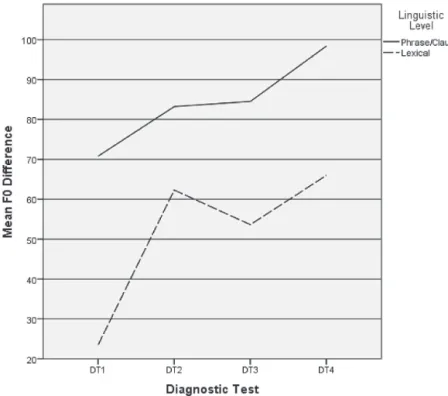
Figure 1 and Figure 2 show the mean F0 difference between the highest and lowest F0 across the four diagnostic tests at the clause/phrase and the lexical level in PA and PB, respectively. The mean F0 difference became substantially larger across the tests in both participants. At the sentence/clause level for PA(see Figure 1), it started from 69.6 Hz at DT1 and increased to 108.1 Hz at DT3 and slightly decreased at DT4, while at the lexical level, it increased from 36.7 Hz at DT1 to 87.3 Hz at DT3 and slightly decreased to 66.3 Hz at DT4. For PB, it increased from 70.8 Hz at DT1 to 98.4 Hz at DT4 at the phrase/ clause level, and from 23.5 Hz at DT1 to 66.0 Hz at DT4 at the lexical level(see Figure 2). The results indicated that both participants were able to produce pitch movements using a larger pitch range through the training sessions. It should be noted that training on the prosody started immediately after DT1 and continued until DT3. The focus of training switched to segmental production after DT4. This might account for a slight decrease in the F0 difference in PA, but overall, both participants retained the ability to use the pitch
Figure 1. The mean F0 difference between the highest F0 and lowest F0 as a function of the
linguistic level (phrase/clause and lexical) across the four diagnostic tests in the reading task in PA.
range after the training on the prosody was terminated.
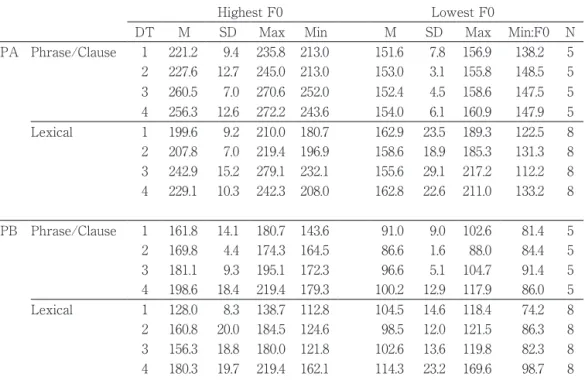
Table 1 shows the mean F0 values averaged across the utterances in one diagnostic test as a function of the linguistic levels (i.e., phrase/clause and lexical) in the reading task in each participant.
The mean highest F0 changed substantially from DT1 to DT4 at both linguistic levels in both participants. For PA, the mean highest F0 ranged from 221.2 Hz to 260.5 Hz at the phrase/clause level, and 199.6 Hz to 242.9 Hz at the lexical level, showing that the highest F0 substantially changed during the training period. On the other hand, the mean lowest F0 remained in the relatively narrow F0 range, with the mean lowest F0 ranging from 151.6 Hz to 154.0 Hz at the phrase/clause level, and 155.6 Hz to 162.9 Hz at the lexical level. For PB, the mean highest F0 ranged from 161.8 Hz to 198.6 Hz at the phrase/clause level, and 128.0 Hz to 180.3 Hz at the lexical level, while the mean lowest F0 stayed in a narrow range, as it ranged from 86.6 Hz to 100.2 Hz at the phrase/clause level, and from 98.5 Hz to 114.3 Hz at the lexical level. The results showed that the increase in the mean
Table 1. The mean highest and lowest F0 values as a function of the diagnostic test, the
linguistic level in the reading task in participant, PA and PB.
Highest F0 Lowest F0
DT M SD Max Min M SD Max Min:F0 N
PA Phrase/Clause 1 221.2 9.4 235.8 213.0 151.6 7.8 156.9 138.2 5 2 227.6 12.7 245.0 213.0 153.0 3.1 155.8 148.5 5 3 260.5 7.0 270.6 252.0 152.4 4.5 158.6 147.5 5 4 256.3 12.6 272.2 243.6 154.0 6.1 160.9 147.9 5 Lexical 1 199.6 9.2 210.0 180.7 162.9 23.5 189.3 122.5 8 2 207.8 7.0 219.4 196.9 158.6 18.9 185.3 131.3 8 3 242.9 15.2 279.1 232.1 155.6 29.1 217.2 112.2 8 4 229.1 10.3 242.3 208.0 162.8 22.6 211.0 133.2 8 PB Phrase/Clause 1 161.8 14.1 180.7 143.6 91.0 9.0 102.6 81.4 5 2 169.8 4.4 174.3 164.5 86.6 1.6 88.0 84.4 5 3 181.1 9.3 195.1 172.3 96.6 5.1 104.7 91.4 5 4 198.6 18.4 219.4 179.3 100.2 12.9 117.9 86.0 5 Lexical 1 128.0 8.3 138.7 112.8 104.5 14.6 118.4 74.2 8 2 160.8 20.0 184.5 124.6 98.5 12.0 121.5 86.3 8 3 156.3 18.8 180.0 121.8 102.6 13.6 119.8 82.3 8 4 180.3 19.7 219.4 162.1 114.3 23.2 169.6 98.7 8
Figure 2. The mean F0 difference between the highest F0 and lowest F0 as a function of the
linguistic level (phrase/clause and lexical) across the four diagnostic tests in the reading task in PB.
F0 difference was largely due to the increase in the highest F0, indicating that the participants learned to differentiate stressed and unstressed syllables using pitch in the reading task.
Analyses on the individual phrases/clauses and the lexical items showed that both participants became able to use higher pitch on stressed syllables. In PA, for example, the highest F0 was found in “There” in DT1(223.9 Hz)but in the first syllable of “couple” in DT4(267.3 Hz) for the clause in the reading task, “There are couple of answers to this question”. The magnitude of the difference increased from 68.6 Hz to 119.4 Hz for this particular clause. In PB, for example, the highest F0 was found in “also” in DT1 (165.2 Hz)but in the first syllable of “accurate” in DT4(219.4 Hz), for the clause in the
reading task, “You also need accurate information about English sounds.” The magnitude of difference went up from 83.8 Hz to 133.4 Hz for this clause.
The same trend was observed at the lexical level for both participants as well. PA, for example, placed the highest F0 on the fourth syllable of “combination”(i.e., “tion”) in DT1 (202.3 Hz), but accurately placed it on the third syllable(i.e., “na”) in DT4(235.8 Hz). The magnitude of the difference increased from 32.0 Hz to 83.7 Hz for this lexical range after the training on the prosody was terminated.
Table 1 shows the mean F0 values averaged across the utterances in one diagnostic test as a function of the linguistic levels (i.e., phrase/clause and lexical) in the reading task in each participant.
The mean highest F0 changed substantially from DT1 to DT4 at both linguistic levels in both participants. For PA, the mean highest F0 ranged from 221.2 Hz to 260.5 Hz at the phrase/clause level, and 199.6 Hz to 242.9 Hz at the lexical level, showing that the highest F0 substantially changed during the training period. On the other hand, the mean lowest F0 remained in the relatively narrow F0 range, with the mean lowest F0 ranging from 151.6 Hz to 154.0 Hz at the phrase/clause level, and 155.6 Hz to 162.9 Hz at the lexical level. For PB, the mean highest F0 ranged from 161.8 Hz to 198.6 Hz at the phrase/clause level, and 128.0 Hz to 180.3 Hz at the lexical level, while the mean lowest F0 stayed in a narrow range, as it ranged from 86.6 Hz to 100.2 Hz at the phrase/clause level, and from 98.5 Hz to 114.3 Hz at the lexical level. The results showed that the increase in the mean
Table 1. The mean highest and lowest F0 values as a function of the diagnostic test, the
linguistic level in the reading task in participant, PA and PB.
Highest F0 Lowest F0
DT M SD Max Min M SD Max Min:F0 N
PA Phrase/Clause 1 221.2 9.4 235.8 213.0 151.6 7.8 156.9 138.2 5 2 227.6 12.7 245.0 213.0 153.0 3.1 155.8 148.5 5 3 260.5 7.0 270.6 252.0 152.4 4.5 158.6 147.5 5 4 256.3 12.6 272.2 243.6 154.0 6.1 160.9 147.9 5 Lexical 1 199.6 9.2 210.0 180.7 162.9 23.5 189.3 122.5 8 2 207.8 7.0 219.4 196.9 158.6 18.9 185.3 131.3 8 3 242.9 15.2 279.1 232.1 155.6 29.1 217.2 112.2 8 4 229.1 10.3 242.3 208.0 162.8 22.6 211.0 133.2 8 PB Phrase/Clause 1 161.8 14.1 180.7 143.6 91.0 9.0 102.6 81.4 5 2 169.8 4.4 174.3 164.5 86.6 1.6 88.0 84.4 5 3 181.1 9.3 195.1 172.3 96.6 5.1 104.7 91.4 5 4 198.6 18.4 219.4 179.3 100.2 12.9 117.9 86.0 5 Lexical 1 128.0 8.3 138.7 112.8 104.5 14.6 118.4 74.2 8 2 160.8 20.0 184.5 124.6 98.5 12.0 121.5 86.3 8 3 156.3 18.8 180.0 121.8 102.6 13.6 119.8 82.3 8 4 180.3 19.7 219.4 162.1 114.3 23.2 169.6 98.7 8
item. For another example, PB falsely placed the highest F0 on the second syllable of “accurate” (“cu”)in DT1(138.7 Hz), but accurately placed it on the first syllable(“ac”) in DT4(219.4 Hz). The magnitude of the difference increased from 20.3 Hz to 102.4 Hz.
The overall results clearly indicated that both participants learned the ability to read and speak, utilizing a wider range of pitch movements both at the phrase/clause and the lexical level in the reading task.
3-2. Story Telling Task
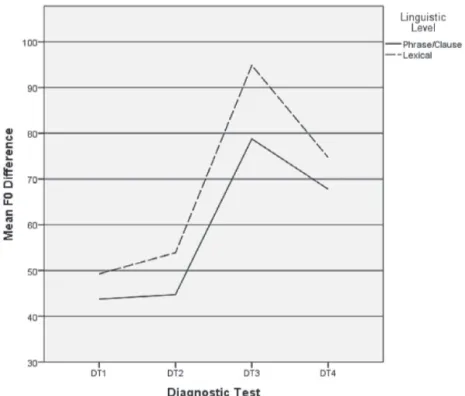
Figure 3 and Figure 4 show the mean F0 difference between the highest and lowest F0 across the four diagnostic tests at the clause/phrase and the lexical level in PA and PB, respectively. For PA, the mean F0 difference substantially increased between DT2 and DT3, and decreased to some degree between DT3 and DT4 at both linguistic levels. At the phrase level, it started from 43.8 Hz and increased to 78.8 Hz at DT3 and decreased to 67.8 Hz at DT4, while at the lexical level, it started from 49.3 Hz and
Figure 3. The mean F0 difference between the highest F0 and lowest F0 as a function of the
linguistic level (phrase/clause and lexical) across the four diagnostic tests in the story telling task in PA.
jumped to 94.8 Hz and went down to 74.7 Hz. As was observed in the reading task, the F0 difference decreased at both linguistic levels between DT3 and DT4. This might be due to the change of the focus of the training from the prosody to the segmental production before and after DT3. As compared with the data on the reading task(see Figure 1), the magnitude of the difference on the story telling task was smaller across the tests at the phrase/clause level. This might be because the greater task demands for the story telling task prevented PA from paying enough attention to the prosody of her utterances2). The overall results, however, indicated that PA became able to use a wider
range of pitch at the lexical and phrase/clause level in the story telling task.
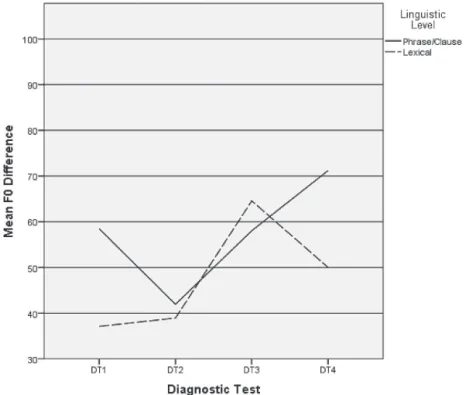
PB also showed an overall increase in the mean F0 difference in the training sessions. At the phrase/clause level, it started from 58.5 Hz and declined to 41.9 Hz at DT2 but increased to 71.2 Hz at DT4, while at the lexical level, it stated at 37.1 Hz and went up to 64.6 Hz, and decreased to 50.0 Hz at DT4. As was observed for PA, PB also showed a larger magnitude of F0 difference in the reading task than the story telling task(Figure 2)
Figure 4. The mean F0 difference between the highest F0 and lowest F0 as a function of the
linguistic level (phrase/clause and lexical) across the four diagnostic tests in the story telling task in PB.
at the phrase/clause level.
Table 2 shows the mean F0 values averaged across the utterances in one diagnostic test as a function of the linguistic levels (i.e., phrase/clause and lexical) in the story telling task in each participant.
In PA, the highest F0 increased substantially at both linguistic levels between DT2 and DT3, while the lowest F0 remained in the same range during the same period. As was observed in the reading task, the increase in the magnitude of difference between the highest and lowest F0 was largely due to the rise in the highest F0. In PB, the highest F0 showed greater variability especially in DT1 and DT4 at both linguistic levels, as is shown by relatively large SD values. This finding indicated that, although there was a trend for improvement, PB still had difficulty using a higher pitch for stressed syllables.
Analyses on the individual phrases/clauses and the lexical items showed that PA was able to increase the highest F0 on the stressed syllable across the tests. For example, the highest F0 for “three” in “three children” increased from 206.1 Hz in DT1 to 257.9 Hz in DT4. The magnitude of the difference increased from 43.2 Hz in DT1 to 99.2Hz in DT3. At the lexical level, the highest F0 in the first syllable of “children” (i.e., “chil”)rose from
Table 2. The mean highest and lowest F0 values as a function of the diagnostic test, the
linguistic level in participant, PA and PB, in the story telling task.
Highest F0 Lowest F0
DT M SD Max Min M SD Max Min:F0 N
PA Phrase/Clause 1 213.8 14.3 247.8 202.3 170.1 15.7 196.9 149.0 8 2 210.1 18.6 242.3 186.9 165.4 11.3 180.7 153.1 6 3 238.9 13.1 252.0 217.2 160.1 9.4 177.1 148.0 9 4 230.4 18.1 257.9 207.0 162.6 14.3 191.7 148.5 7 Lexical 1 204.2 3.2 206.0 200.5 154.9 9.5 165.8 148.9 3 2 208.1 5.5 212.0 204.2 154.2 1.6 155.3 153.1 2 3 247.8 1.4 249.2 246.4 153.0 2.6 154.7 150.0 3 4 236.9 13.5 246.4 227.3 162.1 10.5 169.6 154.7 2 PB Phrase/Clause 1 172.2 33.9 249.1 140.9 113.7 15.2 149.5 91.5 13 2 136.3 18.1 186.1 115.1 94.4 13.3 122.5 74.0 12 3 165.8 17.3 190.1 132.4 107.8 14.7 127.5 84.5 10 4 179.6 35.3 249.2 104.8 108.4 21.1 143.6 54.7 16 Lexical 1 167.2 33.4 207.0 140.0 130.1 14.9 155.8 119.8 5 2 136.0 12.2 146.5 118.5 97.1 16.0 109.4 74.0 4 3 173.7 17.5 190.1 155.3 109.1 25.9 137.8 87.3 3 4 189.3 41.2 249.2 158.6 139.3 10.1 151.0 127.8 4
200.5 Hz in DT1 to 249.2 Hz in DT3. The magnitude of the difference increased from 34.7 Hz in DT1 to 99.2 in DT3.
The same analyses on PB found that he had a particular habit of raising pitch at the end of the word “children” in a phrase, “three children”. He placed the highest F0 on the second syllable(i.e., “dren”), which made the magnitude of the difference larger than expected at the phrase/clause level in DT1. The misplacement of stress continued to occur even at DT4, where the highest F0 was placed on the second syllable (249.2 Hz). However, there were some instances of appropriate stress placement in DT4. For example, the stress was placed on the first syllable of “scary”(i.e., “scar”)in “it is scary” (highest F0=216.2 Hz; lowest F0=94.4 Hz).
The analyses on individual items supported the conclusion that PA was able to use higher pitch for stressed syllables both in the reading and the story telling task. PB was able to so in the reading task, but had some difficulty in the story telling task.
4. Discussion
The present study attempted to examine whether each participant was able to use a wider range of pitch at the lexical and the phrase/clause level through the pronunciation training program. The results of the diagnostic tests showed that PA was able to improve the ability to use a wider range of pitch to differentiate stressed and unstressed syllables in non-sentential positions both at the phrase/clause level and the lexical level. In addition, substantial improvement was observed both in the reading task and the story telling task. The pattern of change across the tests in the mean F0 difference between the highest and lowest F0 was very similar across the linguistic levels and task conditions(see Figure 1 and 3). The finding suggested that she developed the ability to apply her knowledge of English syllable structures and stress assignment rules to actual execution of articulatory commands to produce the pitch movements, not just in the reading task but in the story telling task.
The results also showed that it took a while to develop the ability to use a wider range of pitch. At DT2, the mean F0 difference was still slightly higher than that of DT1, although basic knowledge of English stress assignments had already been taught by then. It still took one more month’s training sessions to improve the ability to the higher level. This indicated that a certain amount of time and practice is required to improve the ability to make use of pitch movements in English.
It was also found that the mean F0 difference slightly declined between DT3 and DT4. As was described above, the focus of the training shifted from prosody to segmental production(e.g., /r/)during the period. The finding suggested a possibility a lack of training might result in a certain degree of loss in the ability in the use of pitch. On the other hand, it is possible that PA used duration and/or intensity to mark stressed syllables. This possibility will be examined when the data on duration are ready. It is of interest to see whether PA’s ability further declined in the following DT, and if yes, continued training is clearly needed to maintain the ability.
The results of the tests on PB showed that the pattern of improvement differed between the reading task and the story telling task(see Figure 2 and 4). In the reading task, he was able to develop the ability to use a wider range of pitch to differentiate stressed and unstressed syllables. In the story telling task, however, the F0 difference between the highest F0 and lowest F0 remained variable across the target lexical items, and phrases/clauses, as well as across the tests. Especially, his idiosyncratic pitch patterns in certain lexical items(e.g., children)did not disappear until DT4. In the story telling task, the speaker is required to pay attention to producing syntactically and semantically well-structured sentence in addition to paying attention to phonetic forms of the utterance. The greater functional loads might have prevented him from using the similar magnitude of F0 range observed in the reading task.
Although still preliminary, the present results may provide some data that can be interpreted in relation to the issues on the effectiveness of nonnative pronunciation training discussed in the introduction. First, the present results provided collaborative evidence that pronunciation training focused on prosody is indeed effective in improving the ability to manipulate prosodic characteristics of the target language(Derwing, et al., 1998; Nagamine, 2011). Especially, the results were compatible with those of Nagamine (2011)as the training focused on pitch movements associated with stress assignments substantially improved the ability to use a wider range of pitch to differentiate stressed and unstressed syllables.
Second, the present training program took an eclectic approach regarding the distinction between focus on form(i.e., FonF)and focus on forms(FonFS). The training sessions included explicit instructions on the properties of the target structure (e.g., stress assignment on bi-syllabic word)and decontextualized repeating tasks,
while they included practice with the target structure in relatively large contexts such as dialogues and passages as well. They did not, however, include an activity which
required spontaneous speech(e.g., debate, spontaneous speech). It is notable that PA was able to improve the ability to use the pitch contours in the spontaneous speaking task. This suggests that knowledge and skills learned in the repeating and reading practice can carry over to a spontaneous speaking task where processing demands are supposedly higher. It is true that the speaking task using an illustrated story sequence might have lessened the processing demands associated with creating the content, but the participants still had to use limited processing resources to produce syntactically and semantically well-formed sentences, in addition to attending to various aspects of pronunciation. For PB, on the other hand, substantial improvement in the use of pitch was limited to the reading task. It was found that PB’s idiosyncratic pitch patterns revealed themselves in the story telling task where task demands were higher. Further analyses will examine the degree of improvement in the use of pitch in the remaining two tasks where task demands were even higher(i.e., a short talk and free conversation).
Finally, the present results clearly indicated that there is individual variability in the way different learners improve their pronunciation abilities. First, PA improved the ability to use pitch movements in a similar way across the linguistic levels and the task conditions, while PB showed different patterns of improvement across the task conditions. Second, the two participants had difficulty with different sets of consonants and vowels. Third, only PA showed a decline in performance in the reading task after completion of the training on prosody. It is difficult to account for these differences, but it appears that each individual shows his or her unique way of improving pronunciation ability. Further examination of the available data is expected to provide more evidence to support this point.
The present paper reports the first and preliminary analyses of the available data on improvement of the pronunciation ability among the two participants. The training program is still in progress at the time of writing this report. The main focus of current training has shifted to improving the pronunciation ability in more demanding task conditions for both participants, while the analyses of the available data are being done at the same time. The future report will provide the results of more comprehensive data analyses on the improvement of their pronunciation ability at the level of both prosody and segment.
Notes
producing falling intonation for declarative sentences and rising intonation for yes-no interrogative sentences.
2)On the other hand, the magnitude of the difference was larger in the story telling task than the reading task at the lexical level. This might be because the lexical item analyzed for the story telling task is one single item(i.e., children), while many more different lexical items were included for the analysis for the reading task.
References
Beckman, M. E.(1986). Stress and non-stress accent. Dordrecht, Riverton: Foris Publications. Binghadeer, N.(2008). An acoustic analysis of pitch range in the production of native and
nonnative speakers of English. Asian EFL Jounal, 10(4), 96-113.
Bradlow, A. R., Pisoni, D. B., Akahane-Yamada, R., & Tohkura, Y.(1997). Training Japanese listeners to identify English /r/ and /l/: IV. Some effects of perceptual learning on speech production. Journal of the Acoustical Society of America, 101(4), 2299-2310.
Celce-Murcia, M., Brinton, D., & Goodwin, J. M.(2010). Teaching pronunciation : a course book and reference guide(2nd ed.). New York: Cambridge University Press.
Cook, A.(2000). American Accent Training(2nd ed.). Hauppauge, NY: Barron’s.
Couper, G.(2006). The short and long-term effects of pronunciation instruction. Prospect, 21, 46-66.
Derwing, T. M., & Munro, M. J.(1997). Accent, intelligibilty, and comprehensibility. Studies in Second Language Acquisition, 19(1), 1-16.
Derwing, T. M., & Munro, M. J.(2005). Second language acquisition and pronunciation teaching: A research-based approach. TESOL Quarterly, 39(3), 379-397.
Derwing, T. M., Munro, M. J., & Wiebe, G.(1998). Evidence in favor of a broad framework for pronunciation instruction. Language Learning, 48(3), 393-410.
Flege, J. E., & Hillenbrand, J.(1984). Limits on pronunciation accuracy in adult foreign language speech production. Journal of the Acoustical Society of America, 76, 708-721.
Fraser, H.(2001). Teaching pronunciation: a handbook for teachers and trainers: Department of Education Training and Youth Affairs(DETYA).
Fraser, H.(2006). Helping teachers help students with pronunciation : a cognitive approach. Prospect, 21(1), 80-96.
Goto, H.(1971). Auditory perception by normal Japanese adults of the sounds "L" and "R". Neuropsychologia, 9(3), 317-323.
Hewings, M.(2007). English Pronunciation in Use: Advanced. Cambridge: Cambridge University Press.
Hu, X., Ackermann, H., Martin, J. A., Erb, M., Winkler, S., & Reiterer, S. M.(2012). Language aptitude for pronunciation in advanced second language(L2)Learners: Behavioural predictors and neural substrates. Brain and Language127(3), 366-376.
Jenkins, J.(2000). The phonology of English as an international language. Oxford : Oxford University Press.
Morley, J.(1987). Current perspectives on pronunciation : practices anchored in theory. Washington, D.C.: Teachers of English to Speakers of Other Languages.
Nagamine, T.(2011). Effects of hyper-pronunciation training method on Japanese university students’ pronunciation. Asian EFL Journal Professional Teaching Articles, 53, 35-50.
Nava, E., & Tepperman, J.(2010). Modeling second language prosody acquisition: A dynamic systems theory approach. Paper presented at the 35th annual Boston University Conference
on Language Development.
Saito, K.(2012). Effects of instruction on L2 pronunciation development: a synthesis of 15 quasi-experimental intervention studies. TESOL Quarterly, 46(4), 842-854.
Tsushima, T.(2008). How are nonnative perception and production ability related during perception and production training? Journal of the Japan Society for Speech Sciences, 9, 29-47.