An Exploratory Study on the Relationship
between TOEIC and a Reading Skill Test1
著者
Taguchi Kaya
journal or
publication title
The Economic Review of Toyo University
volume
44
number
2
page range
225-238
year
2019-03
Notes
An Exploratory Study on the Relationship
between TOEIC and a Reading Skill Test
1)TAGUCHI, Kaya
Abstract
This exploratory study tried to answer the question regarding whether English learners with lower English test scores have lower basic language skills than those with higher English test scores. As a measurement of English proficiency, TOEIC was used, and as a measurement of basic language skills, Reading Skill Test (RST) was used. RST results of one group of 22 undergraduate students with higher TOEIC scores were compared with those of 20 undergraduate students with lower TOEIC scores. Their native language is Japanese. T-tests showed that REP, an RST component, the skill to represent a graph/table, was statistically different between the two groups. The results suggest that teachers who teach different levels of English should keep in mind that lower scorers would need help in acquiring higher-order logical skills, skills of looking for overall trends and predicting future trends, for instance. The fact that such students apparently have not acquired such skills in previous school settings means that this task could be challenging, but worth the effort of both teachers and their students.
Keywords: English proficiency, basic language skills, RST, TOEIC
Introduction
If you are a teacher, you may be able to empathize with my experience. While you give almost identical instructions, things go flawlessly in some courses, and things go wrong in others. I have felt this for a while, as an English teacher, who gives instructions about language activities in different courses. I have basically given the same instructions for the same activities to different groups of students. But I find something different between groups of students with higher TOEIC scores and those with lower scores. For instance, 1) Reading Skill Test is produced by Research Institute of Science for Education.
when I taught students to analyze survey answers from their peers, I had to give them much more support as to what they could infer from the data, with specific examples of interpretations. I am not talking about their use of English, but about the ability of transferring numbers into some ideas that they would like to explore. I will give you a specific example. I had my students conduct a survey regarding the topic Smartphone Use and then write a paragraph so that they could review paragraph structures they learned in class. They collected information about smartphone use from their classmates in order to use the information as objective data in their paragraphs. I also had the students include their own interpretation about the data so that they could learn to distinguish objective information from subjective interpretations.
㻓㻈 㻕㻓㻈 㻗㻓㻈 㻙㻓㻈 㻛㻓㻈
㼐㼒㼕㼈㻃㼗㼋㼄㼑㻃㻖㻃㼋㼒㼘㼕㼖 㻔㻐㻕㻃㼋㼒㼘㼕㼖 㼏㼈㼖㼖㻃㼗㼋㼄㼑㻃㻔㻃㼋㼒㼘㼕
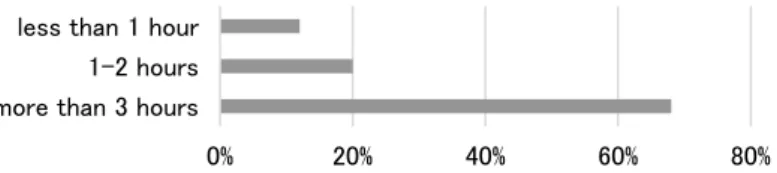
Figure 1. A student-made graph about smartphone use.
This graph is about survey data collected by one of my students, who asked his peer students How many hours do you use your smartphone in a day? The student interpreted that the results meant many of their classmates used their smartphones to do their homework. He did not ask anything about homework in his survey. This far-fetched speculation probably has little to do with English skills.
I suspect many teachers, especially those who teach groups of students streamed by some type of English proficiency scores, must have similar experiences. They would find themselves in a situation where they need to provide more support for one group of students, not in terms of English language per se, but in terms of something different – probably basic language matters. When they give instructions for certain language activities, they would need to give much more specific examples and individual attention in lower-level courses than higher-level ones. Currently I do not know exactly what basic language matters are, therefore, this exploratory paper tries to answer the following question.
Research Question
Do those with lower English test scores have lower basic language skills than those with higher English test scores?
Method
Participants
The participants of this study consisted of college students majoring in economics at a private university in Tokyo, Japan. The author taught two separate courses of students streamed according to their TOEIC scores, 2018: one had 1st year students with the highest TOEIC scores and the other had 2nd year students with the lowest scores. The author explained to the students the purpose and the procedures of the study. The data used was only from the students who submitted their consents to participate in this study.
Table 1
Results of t-tests for TOEIC Scores with Higher TOEIC Score Participants and Lower TOEIC Score Participants
Outcome Group 95% CI for Mean Difference TOEIC High Scorers (n=22, 17 males, 5 females) TOEIC Low Scorers (n=20, all males) M SD M SD sig.(2-tailed) dft
TOEIC IP Listening Section 310.0 38.0 158.3 42.0 126.8, 176.7 12.3** (.000) 40
TOEIC IP Reading Section 253.2 39.2 122.8 46.3 103.8, 157.1 (.000)9.9** 40
TOEIC IP Total 563.2 47.5 281.0 73.2 244.0, 320.3 15.0**(.000) 40
The data from non-Japanese speakers was excluded here because RST gives questions based on textbooks written in Japanese.
Results of the two-independent samples t-tests show that the mean scores of TOEIC IP listening and reading sections and the total scores differ between TOEIC high scorers and low scorers at the .01 level of significance.
Assessment Materials
To investigate the above question, I used two assessment measurements. One was the participants TOEIC IP scores and the other was their Reading Skill Test results.
Assessment Material 1 Measurement of English Proficiency. As an assessment for the participants
English proficiency, the students TOEIC IP scores (with 200 multiple-choice questions, 120 minutes - 45 minutes for 100 listening section questions plus 75 minutes for 100 reading section questions) were used.
IP stands for Institutional Program, which is a test that can be administered at an organization s choice of location and time for its employees or students. The scores of the 1st year students were from the test of April 2018, and those of the 2nd year were from that of April 2017.
The reliabilities (Cronbach s Alpha) for TOEIC listening and reading sections and the total scores are reported to be .92-93, .92-93 and .95-96, respectively (Liao at al., 2010).
Assessment Material 2 Measurement of Basic Language Skills. In order to measure basic language
skills, I used Reading Skill Test (RST). According to the test designers, it is made to measure basic language skills (Arai et al., 2017), but I assume it is designed to measure basic Japanese skills because the questions are all in Japanese and most are taken from Japanese textbooks.
The test seems reasonable to answer my research question, whether low TOEIC scorers have lower basic language skills. That question stems from my teaching experience where I had to give more support to lower TOEIC scorers, as I have shown in the example regarding how to interpret data. Those students may not have solid language skills. In order to interpret graph data, you would need to look at data numbers, build them into small ideas, and understand what the whole graph tells you while considering backgrounds, making comparisons and predictions, for example. You would need to use language effectively to take logical steps to expand your interpretations without making wild guesses. In addition, the fact that my activity instructions are given through language (their native language, in many cases) means that certain groups of students who need more help may lack fundamental language skills.
Test question materials. All the question materials except for the INST (see below) are based on textbooks
written in Japanese and approved by the Ministry of Education, Culture, Sports, Science and Technology. The textbooks are used in Japanese junior high and high schools. INST questions are taken from such textbooks or Japanese dictionaries.
Components of RST. RST separately measures six reading skill components:2)
1. Dependency Analysis (DEP): The skill of recognizing the dependency relations between words and phrases in a given sentence. This is an example to test the DEP skill.
2) All the English definitions for each component is taken directly from p.2 Arai et al., 2017. Refer to the paper for more detailed explanation. I changed some English expressions when I find necessary.
Read the sentences below:
Buddhism spread mainly to Southeast Asia and East Asia, Christianity to Europe, North and South America and Oceania and Islam to North Africa, West Asia, Central Asia and Southeast Asia. Choose the most appropriate answer from the given choices and fill in the blank in the following sentence.
( ) has spread to Oceania.
①Hinduism ②Christianity ③Islam ④Buddhism3)4)
2. Anaphora Resolution (ANA): The skill of anaphora relation. An example is shown below. Read the sentences below:
There is a possibility that there is life on Mars. There is evidence that it had a large quantity of water there, and that it can still have water in its underground.
Choose the most appropriate answer from the given choices and fill in the blank in the following sentence.
The place where some evidence exists that once there was a large quantity of water is ( ). ①Mars ②possibility ③underground ④life
3) The examples are taken from pp. 190-194 of Arai (2018) except for the example of REP, which is from pp.207-208 of the same book. The originals are in Japanese. The examples here are translated by the author, while the DEP English example is taken from p.1559 of Arai et al. (2017).
4) Some readers would find it difficult to see what is widespread in Oceania when they do not see three separate dependency relations in this sentence. Only about one-third of junior high school students gave the correct answer
3. Paraphrasing (PARA): The skill of recognizing that a sentence is the same in meaning as another one. Read the sentences below:
Yoshitsune cornered Taira Clan and defeated them at Danno Ura. Is the sentence above the same as the sentence below? Choose Same or Different.
Taira Clan was cornered by Yoshitsune and was defeated at Danno Ura. ①Same ②Different
4. Logical Inference (INF): The skill of reading a sentence and determining what can be inferred from a proposition in the sentence, what conflicts with it, and what does not relate to it. Here, two sentences are presented to the examinees. The instruction asks the examinees whether the proposition in the second sentence (task sentence) can be inferred from the proposition in the first sentence (presented sentence). The examinees are asked to choose Yes if the sentence can be inferred, No if the first and second propositions cannot hold true at the same time, and Not known if the proposition are not related to each other.
Read the sentence below:
Mt. Everest is the highest mountain in the world.
If the sentence above is correct, is the sentence below correct? Choose Correct, Wrong, or I can t say only with this information.
Mt. Elbrus is lower than Mr. Everest. ①Correct ②Wrong ③I can t say
5. Representation (REP): The skill to represent an image (figure or table) by comprehending a sentence of the textbook. The participant reads a sentence and chooses the images correctly representing the sentence (multiple responses).
Read the following sentences:
Out of the Major League Players, 28% are from countries other than the USA, and when we look at their countries of origin, those from the Dominican Republic are the highest, about 35%.
Choose all the appropriate graph(s) that show the breakdown about countries of origin among Major League Players. ① 㻰㼛㼙㼕㼚㼕㼏㼍㼚 㻾㼑㼜㼡㼎㼘㼕㼏㻌㻟㻡㻌 㻲㼛㼞㼑㼕㼓㼚 㻼㼘㼍㼥㼑㼞㼟㻌㻞㻤㻜㻌 㼁㻿㻭㻌㻣㻞㻜 ② 㻧㼒㼐㼌㼑㼌㼆㼄㼑㻃㻵㼈㼓㼘㼅㼏㼌㼆 㻜㻑㻛㻈 㻹㼈㼑㼈㼝㼘㼈㼏㼄 㻙㻑㻗㻈 㻲㼗㼋㼈㼕㼖 㻔㻔㻑㻛㻈 㻸㻶㻤 㻚㻕㻑㻓㻈 ③ 㻲㼛㼞㼑㼕㼓㼚 㻼㼘㼍㼥㼑㼞㼟 㻞㻤㻚㻜㻑㻌 㻰㼛㼙㼕㼚㼕㼏㼍㼚 㻾㼑㼜㼡㼎㼘㼕㼏 㻟㻡㻚㻠㻑㻌 㼁㻿㻭 㻟㻢㻚㻢㻑 ④ 㻧㼒㼐㼌㼑㼌㼆㼄㼑㻃 㻵㼈㼓㼘㼅㼏㼌㼆 㻖㻘㻑㻗㻈 㻸㻶㻤 㻕㻛㻑㻓㻈 㻹㼈㼑㼈㼝㼘㼈㼏㼄 㻕㻕㻑㻚㻈 㻲㼗㼋㼈㼕㼖 㻔㻖㻑㻜㻈
6. Instantiation (INST): The skill to understand how to use a term correctly according to a given definition of the term. The participant reads a definition sentence and chooses correct usages from four sentences (multiple choice). There are two subcomponents of INST.
INSTd: definitions taken from dictionaries
There are no INSTd examples available for public use, as far as I am aware. INSTm
Numbers that can be divided by two are called even numbers. Other numbers are called odd numbers. Choose all the even numbers here.
①65 ②8 ③0 ④110
Assessment procedures. The test is administered using computers, which allow an application of Item Response
Theory (IRT) so that the test measures examinees basic reading skills more reliably because it asks a new question according to the level of correctness of each examinee s previous answers (p. 1557, Arai et al., 2017).
The testing time is approximately from 30 to 40 minutes. Test takers are allowed to take a short break (1-2 minutes) between test components.
The test designers have reported that correlation between the average Ability Scores in all the components of RST and so-called entrance examination deviation numbers of their study participants high schools was higher than .80 (National Institute of Informatics, 2018).5)
Test results. The test results are presented in terms of 7 types of measurement. They are the number of answers,
the number of correct answers, the percentage of correct answers, ability value (a number that shows how much higher or lower their score is compared with junior high school students average), a deviation value among all the examinees, a deviation value among students at post high school institutions, and a 5-point score. According to the test manual for test administrators, the number worth paying close attention to is the ability value.
Results
The following (Table 2) are the t-test results that indicates that the two groups, one with higher TOEIC IP scores and the other with lower TOEIC IP scores, are also different in terms of RST results. While there are 7 measurement items on RST, this shows only the detailed results for ability value due to the limited space.
5) With 45,000 participants from 189 organizations in Japan participating in this research, we gained a correlation number higher than .8, of the average ability scores in all the components of RST with so-called entrance examination deviation numbers of the schools. The original was in Japanese.
Table 2
Results of t-tests for Ability Value of RST of Participants with Higher TOEIC Scores and Participants with Lower TOEIC Scores
Outcome
Group
95% CI for Mean Difference TOEIC High
Scorers(n=22) Scorers(n=20)TOEIC Low
M SD M SD t df DEP 1.45 .596 1.30 .657 -.236, .545 .800 40 ANA 1.77 .528 1.45 .605 -.031, .676 1.846 40 PARA 1.36 .581 1.20 .696 -.235, .562 .830 40 INF 1.50 .598 1.39 .698 -.303, .526 .543 38 REP6) 1.41 .503 1.00 .459 .109, .709 2.756** 39.999 INSTd 1.23 .612 1.00 .577 -.150, .605 1.217 39 INSTm 1.27 .550 1.00 .745 -.138, .683 1.344 39 ** at. 03 level
There is a statistically significant mean difference in REP, the skill to represent a figure/table between participants with higher TOEIC scores and participants with lower TOEIC scores. Results indicate that high TOEIC scorers tend to have higher REP skills than low TOEIC scorers. Table 3 shows the results of t-tests for all the components of RST and has a star when the two groups are statistically different for that component. REP is the only one that was found to be a distinctive feature not only in terms of the ability value but also in the other measurements of RST.
Table 3
Results of t-tests for Seven Components of RST of Participants with Higher TOEIC Scores and Participants with Lower TOEIC Scores
Components of RST
Measurements DEP ANA PARA INF REP INSTd INSTm
Ability Value *
Deviation Value among all the examinees * *
Deviation Value among students at post
high school institutions * * *
5-Point Score * * * *
Pearson correlation tests (Table 4) also revealed that all the four measurements concerning REP correlated with TOEIC IP scores (not only total scores, but listening and reading scores individually).
Table 4
Pearson Correlation between TOEIC IP Scores and REP of All the Study Participants
Listening ScoreTOEIC IP Reading ScoreTOEIC IP Total ScoreTOEIC IP
Ability Score .492** .407** .479**
Deviation Value among all the examinees .492** .407** .479**
Deviation Value among students at post high
school institutions .492** .407** .479**
5-Point Score .456** .392** .452**
** at .01 level
In addition to REP, INSTm, the skill to understand how to use a term correctly according to a given definition of the mathematical and science term, was also found to statically correlate with TOEIC scores although the relation was not as robust as REP (Table 5).
Table 5
Pearson Correlation between TOEIC IP Scores and INSTm of All the Study Participants
TOEIC IP
Listening Score Reading ScoreTOEIC IP TOEIC IP Total Score
Ability Score .304 .367* .355*
Deviation Value among all the examinees .311* .374* .362*
Deviation Value among students at post high
school institutions .332* .392* .383*
5-Point Score .300 .342* .340*
* at .05 level
Discussion
This exploratory study has tried to answer the research question, whether those with lower English test scores have lower basic language skills than those with higher English test scores.
The results from t-tests and Pearson Correlation have shown that REP, the skill to represent an image (figure or table) by comprehending sentences that would be in a typical school textbook, is the one that appears to distinguish the group with higher TOEIC scores from the other with lower TOEIC scores. Although the statistical tests only indicates that the relationship is simply a correlation, not a causal one, the skills that RST measures could be causal for English learning as a foreign language. In other words, their native language should have some effect on their foreign language learning, but not vice versa.
This is because I believe I can safely assume that almost all the participants in this study have not spent as much time learning English as learning their native language. The age that they started learning English was probably much later than that when they started learning Japanese. I would say their English learning should
have been assisted from their first language not only because the starting age was later but because many of their former English teachers probably used their native language most of the time (although this is not based on evidence but anecdotes from my students). I am not saying definitively and there must be some exceptions, but this idea that their reasoning skills, like REP, must have been gained through their native language first. Their first encounter with graphs would have been at elementary schools, where their native language is used as the primary language in most cases. Students learn how to read graph numbers and interpret the numbers in social science classes, for instance. They would use that learning when they see and interpret graphs in an English course they take later at school. In TOEIC tests, there are some questions that test higher-order skills, like reading graphs. It is not implausible to think that REP - the skill to represent a graph in their native language - could be in a causal relationship, not just a correlational one, with TOEIC IP scores. If they have not acquired basic skills of reading graphs when they learned through their native language, they would not be able to understand graphs shown in a foreign language. I am not suggesting, however, that English teachers have nothing further to do to help their students improve their reasoning skills. The following are my suggestions.
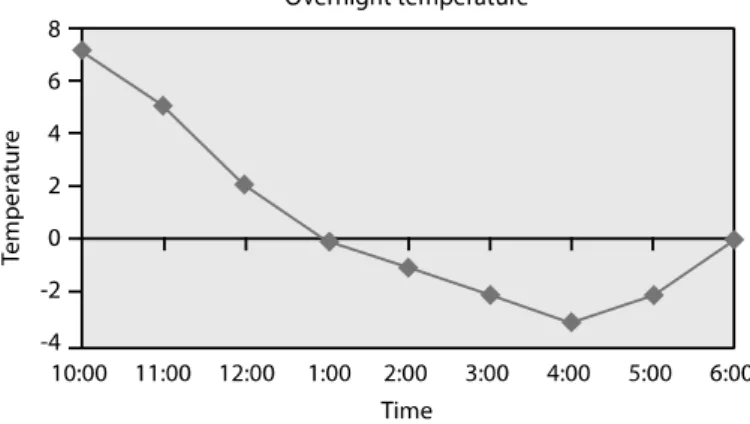
On this component of the test - REP, examinees have to choose a figure or a table that represents the statement in a question. Most of the students I teach probably have no trouble answering specific questions about graphs. For instance, look at the graph below that shows overnight temperatures for a desert area (Primary National Strategy, 2011).
Figure 2. Overnight temperature for a desert area – a sample graph for student activities.
The students should have almost no trouble answering questions such as What were the highest and lowest temperatures? When did these occur? However, if they were to compare an overnight temperature
graph from different parts of the world with this one and need to consider how they are different, some of the students may not know what to do.
When you use specific data numbers you get from a figure/graph to form your opinions or draw overall conclusions, you would need higher-order logical skills, for example, reading overall trends and making comparisons. Thinking about reasons for the overall trends and making predictions for the future would also be helpful to make your ideas more intriguing to yourself, with these results, you could study the topic further. Working on an assignment with excitement – not being forced as a job - would be necessary to practice challenging tasks such as logical thinking.
Let us look again at an example question about REP.
Out of the Major League Players, 28% are from countries other than the USA, and when we look at their countries of origin, those from the Dominican Republic are the highest, about 35%.
The students who chose the wrong figures may have only looked at parts of phrases and numbers and connected them together without thinking much about what the connected information could mean. I think such students may want to answer the questions quickly probably because they feel they are forced to do the work. They may not find the task interesting. What teachers need to do is not only teach how to read numbers, but how to be somewhat intrigued at the numbers by saying aloud Wow! Only about 30% are from non-US countries. And about 1/3 are from the Dominican Republic… So, they are 1/3 of 30%... The ratio is small. I thought many more immigrants play there, but is this trend changing? Will more immigrants play in the MLB in the future? When we teach graphs, teachers can use think-aloud protocol –saying aloud what we are thinking while working on a task. This may sound very primitive, but I believe there must be some college students who would appreciate this kind of teaching method because they may have missed the opportunity to learn how to interpret graphs earlier at school. Let me make further suggestions about what language teachers can do to help less skilled learners.
English teachers should know that there seems to be such differences between higher and lower proficiency groups in the first place, and change their teaching instructions according to their basic language levels. Most English teachers, I assume, change their teaching materials and target appropriate language skills, grammar and vocabulary, depending on their students proficiency. Not only that, I believe they should change their instructions. One of the goals teachers have in mind should be to help students to be life-long learners, therefore, I do not mean that we should simplify our teaching approach when I say change instructions,
but that we should let students think for themselves. Those who lack high-order skills may get frustrated when they do not receive simple bullet-point instructions, which they might think is the best way to finish the task. If we give too clear instructions to let them reach a goal as directly as possible, however, they might never fail to get to the goal quickly, but this may not help them in the long run. Patience is crucial on both sides, teachers and students. Teachers should not give up on students but give them ample apportunities to let them think for themselves, form their own opinions, and modify them considering facts when necessary. This should be, however, worth the effort because this is likely to help students effectively deal with various assignments they will be responsible for at college and after graduation.
This exploratory paper lacks theoretical basis to explain the link between basic language skills and English proficiency, as well as the pedagogical implications. In addition, there is a need for a solid understanding of what each component of RST tries to measure or how RST scores are produced, especially the 5-point evaluation, for which it is not clear exactly what mathematical computations they used, as far as I am aware. I look forward to a feedback session for teachers the RST institution says it plans to offer some time later. In a future investigation, I would like to include objective analyses based on preceding research concerning basic language skills and second language acquisition so that I can present convincing propositions how we, language teachers can support our students.7)
References
Arai, N. (2018). AI vs. kyokasho ga yomenai kodomo tachi [Artificial intelligence vs. children who can t read textbooks]. Tokyo: Tokyo Keizai Inc.
Arai, N., Todo, N., Arai, T., Sugawara, S., Inuzuka, M., Matsuzaki, T., & Ozaki, K. (2017). Reading skill test to diagnose basic language skills in comparison to machines. Proceedings of the 39th Annual Cognitive Science Society Meeting (CogSci 2017), 1556-1561. Retrieved from https://researchmap.jp/index.php?action=cv_download_main&upload_id=134416 Liao, C., Hatrak, N., & Yu, F. (2010). Comparison of content, item statistics, and test-taker performance on the redesigned
and classic TOEIC listening and reading test. Retrieved from https://www.ets.org/research/policy_research_reports/ publications/report/2010/itjs
National Institute of Informatics. (2018). Tailor-made kyoiku kaihatsu o shiensuru tameno gakushusha no dokkai ninchi tokusei shindan testo no kaihatsu [Development of reading skill test for learners as an aid for tailor-made educational development]. Retrieved from https://kaken.nii.ac.jp/ja/grant/KAKENHI-PROJECT-16H01819/
Primary National Strategy. (2011, August 11). Helping children with mathematics: year 5 to year 6 - Digital Education Resource Archive (DERA). Retrieved January 10, 2019, from https://dera.ioe.ac.uk/8394/3/00133-2008FLY-EN.PDF
7) This paper was proofread by Matt Fuller and Sy Alan, at ESS, English Support Service, at Toyo University, but any errors that remain are my sole responsibility