ISSN 0387-1339
富山大学工学部紀要
第35巻
Bulletin of
Faculty of Engineering Toyama U niversity
Vol. 35
1 984
目 次
1. 炭素鋼の腐食疲労における累積損傷に関する研究(英文) ……石原外美・塩沢和章・宮尾嘉寿....・H・. 1 2. WC-CO系焼結合金の熱定数に関する実験的研究'"・H・....・H・...竹越栄俊・平沢良男・井村定久……・・・14
3. ステップスラスト軸受の動特性におよぼす流体の貫性力の影響
-……春山義夫・風巻↑亘司・伊佐地則文- …・・ .23
4. システムの特性方程式の根軌跡、決定に関するパーソナルコンビュータの利用について
…藤塚幸一-中)11孝之・……33
5. 非線形システムにおける積分曲線決定に関するパーソナルコンビュータの利用について
…堀田之孝・中川孝之・・・……44 6. カラーキンの方法によるステファン問題の解法(1)(英文)…...・H・-…....・H・-…...・H・-古谷嘉志・…・…. 57 7. カラーキンの方法によるステファン問題の解法(II) (英文)....・H・-…H・H・...・H・...・H・-…古谷嘉志………6 0
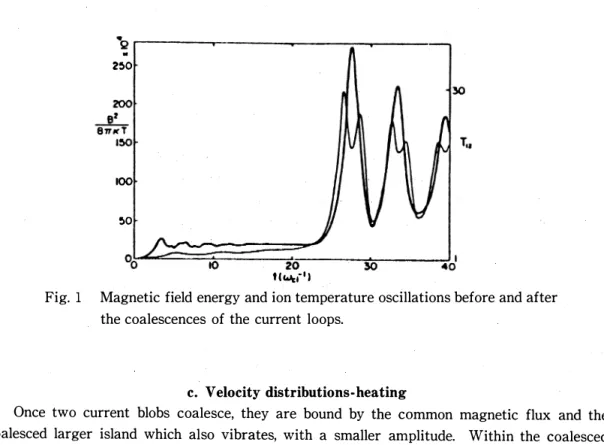
8. 太陽フレアーにおけるCoalescence不安定(英文)
…T. TAJIMA・F. BRUNEL・坂井純一・L. VLAHOS. M. R. KUNDU...……64
9. 磁気中性面での陽子の非統計的加速(英文)...・H・-…H・H・...・H・...・H・...坂井純一・杉原 亮...・H・.. 75 10. 相対論的電子一陽電子プラズマて切遷移輯射(英文}..・H・...・H・...・H・...・H・H・H・..坂井純一....・H・. 82
11. 微分型非線形シュレビンガ一方程式の線形問題とグリーン函数(英文)
…川田 勉・坂井純一....・H・. 84 12. 主カイラル方程式の積文と解の分類・H・H・..…...・H・-・…...・H・..………...・H・..…...・H・..…)11回 勉...・H・..101 13. 昭和57年度修士論文概要一覧…....・H・...・H・...・H・-・・・・・・・・・・・・・・・・・・・・・・・・・・・・・・・・・・・・・・・・・・・・・・・・・・・・・・・・・・・・・・・・・110
The Cumulative Damage under Two-step Corrosion Fatigue Tests of Carbon Steel
by
Sotomi ISHIHARA, Kazuaki SHIOZA W A and Kazyu MIY AO Department of Mechanical Engineering, Toyama University, Takaoka
Abstract
In order to investigate the effect of cyclic stress history on corrosion fatigue strength, two
step fatigue tests were performed on the OA5% C carbon steel smooth specimens in rotary bending in laboratory air and in salt water (3.0% N aCl). It was clarified that the values of the cumulative ratio changed complexly under various conditions, involving the magnitude of stresses, stress sequences and environments. It was pointed out from the experimental examination that the behaviour of the maximum crack length on the specimen surface is useful for evaluation of fatigue damage. The maximum crack length during fatigue was deduced by using the statistics of extremes and approximating the distribution of crack lengths by three-parameter Weibull distribution. The cumulative damage rule for two-step fatigue was introduced theoretically by regarding fatigue damage as the maximum crack length obtained from the statistical properties of distributed cracks on the smooth specimen surface.
1. Introduction
The machines and structures in service are often subjected to repeated loads of varying amplitudes and corrosive environmental attack. In order to establish reliable design method,
1)-5)
many studies have been made about the estimation of fatigue lives under varying stress amplitudes and varying environments. However, there are still much unknown phenomenons.
For the instance, two cases of cumulative damage rule for the two-step corrosion fatigue tests are
1).3) 5)
reported, that is, �N tiN rt = 1 and �N tiN 11 of:. 1, where N 1 and N 11 are the number of cycles applied and the fatigue life at the stress amplitude of O"t- However, it seems that general opinions for these experimental results have not been proposed yet. Therefore, it is important to accumulate the experimental results, by performing systematical experiments under the various conditions involving various materials and stress amplitudes.
In this study, three kinds of fatigue tests were carried out, that is, (1) two-step fatigue tests in air (Dry-Dry), (2) fatigue tests in air at the primary stress and subsequent fatigue tests in salt water at the secondary stress (Dry-Wet), (3) two-step fatigue tests in salt water (Wet-Wet).
Based on the fatigue tests, the effects of cyclic stressing on corrosion fatigue strength were investigated.
In corrosion fatigue, cracks are initiated in the early stage of fague life. The greater part of fatigue life is corresponding to the period for crack growth. Accordingly, in order to clear the
- 1-
Bulletin of Faculty of Engineering Toyama University 1984
corrosion fatigue damage, the behaviours of distributed cracks must be taken into consideration.
In this study, the cumulative damage under two-step fatigue tests were discussed by the statistical estimation of the maximum crack length on the specimen surface from the distribution of crack length. Moreover, corrosion fatigue damage at the specimen surface were examined by measuring X-ray half-value breadth ratio during fatigue process.
2. Specimen and Experimental Method 2. 1 Specimen
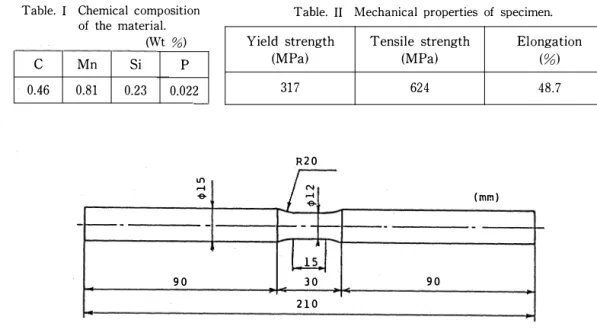
The materials tested were JIS S45C carbon steel, whose chemical composition and mechanical properties after heat treatments are listed in Table. I and Table. II, respectively.
Shape and dimension of the specimen is shown in Fig.l.
Table. I Chemical composition of the material.
(Wt %)
c Mn Si p
0.46 0.81 0.23 0.022
Ill ...
....
1- - -
90
Table. II Mechanical properties of specimen.
Yield strength Tensile strength Elongation
(MPa) (MPa) (%)
317 624 48.7
R20
N ... .... (mm)
- - -
LJ 30 90
210
Fig. 1 Shape and dimension of the specimen used.
After polishing the specimen surface with emery-paper (#1000), the specimens were annealed for one hour at 1173K in vaccum. The specimen surface was electro-polished about 20-30,um before test.
2.2 Experimental details
Fatigue machine used was Ono-type rotary bending machine whose cyclic speed is 60 Hz.
The distributed cracks on the smooth specimen surface were observed by the optical microscope ( x 200) on the replica which was taken from the specimen surface interrupted at various fractions of fatigue life. The environment in the present tests was salt water (3% N aCl) kept at 298K.
Variations of X-ray half-value breadth during fatigue process were measured. Measuring condition is shown in Table.III.
- 2-
S.Ishihara, K.Shiozawa, K.Miyao : The Cumulative· Damage under Two-step Corrosion Fatigue Tests
Table. III Conditions of X-ray measurement.
Characteristic X-ray Cr-Ka
Diffraction plane Fe (211)
Tube voltage 30 kv
Tube current lOrnA
Divergent angle 0.84 deg
Irradiated area 1 X 10 mm2
Scanning speed 4 deg/min
Time constant 8 sec
Oscillation speed 3 deg/min
Oscillation angle 2.5 deg
3. Experimental Results and Discussion 3.1 S-N curves
Fig.2 shows S-N curves obtained from fatigue tests in laboratory air (Dry) and in salt water (Wet).
330 r---�
300
250
200
150
100
Rotary bending S45C
0 :In air(Dry)
•: In salt water (Wet)
Number of cycles to failure Nr
Fig. 2 S-N diagram of ]IS S45C carbon steel fatigued under rotary bending in laboratory air and in salt water (3.0 % NaCI) kept at 298K.
It can be seen from this figure that fatigue limit, rrw, is about 240 MPa for fatigue in air, while fatigue limit was disappeared for fatigue in salt water. Fatigue lives, N r, in salt water decrease in comparison with that in air and the effects of corrosive environment on fatigue lives are remarkably observed.
- 3-
Bulletin of Faculty of Engineering Toyama University 1984
3.2 Two-step fatigue tests
"--z z
� v
b (f)
» ....
"0 ro c 0 u v (f)
'<-<
0
·.;:: 0 .... ro
u v u »
The examination of cumulative damage was made by two-step fatigue tests.
1.5
1.0
0.5
0 0
01HPa-(J2 () :294-90
9 • :294-265
() :265-98
•
<r1MPa-(J2 o: 265-294
•= 265-265
<D:265-2 16 9:265- 157 0:265-90 0.5 1.0 0
Cycle ratio of primary stress N /N 11
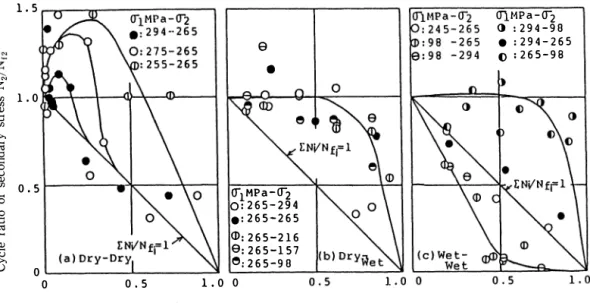
Fig. 3 Experimental relations between cycle ratio of primary stress level N / N 11 and that of secondary stress level N2/N12.
That is, various cycle ratios of N 1 /N n at primary stress level of 111 were applied and then the tests were continued to failure at the secondary stress level of 112• (N 1 and N n are the number of cycles applied and the fatigue life at the primary stress level, respectively.)
Fig.3 shows the results of two-step fatigue tests, indicating the relationships between N 1 /N n and N dN r2 which is the cycle ratio applied at the secondary stress level. (N 2 and N r2 are the number of cycles applied to failure and the fatigue life at the secondary stress level, respectively.) The solid line shown as �N 1/N r1 = 1 is the linear damage rule (Miner's rule). The results of two-step fatigue tests in air (designated as Dry-Dry) are shown in Fig.3(a). These experimental results were obtained from the tests that the specimen was fatigued at fixed secondary stress of 112 = 1.
1 11w = 265MPa after cycling under primary stress level. When cycle ratio of primary stress, N 1 I N n, is small, fatigue life in secondary stress is strengthened by repeating primary stress, and the degree of strengthening increased with decreasing the primary stress level. Increasing the value of N1/Nn, the cumulative damage tend to be equal to the linear damage rule. Fig.3(b) shows the results of two-step fatigue tests carried out under the primary stress level in laboratory air and the secondary stress level in salt water (designated as Dry-Wet). In this test, primary stress was fixed at the 10% upper the fatigue limit and secondary stress was set at several levels. In the region that the cycle ratio of primary stress, N 1 /N n, is less than 0.5, the number of cycles to failure N 2 at the secondary stress level are not affected by the stress cycling at primary stress level. While, the reduction of life at secondary stress level can be seen in the region N 1 /N f1 >
- 4-
S.Ishihara, K.Shiozawa, K.Miyao : The Cumulative Damage under Two-step Corrosion Fatigue Tests
0.5. The tendencies mentioned above are same as those of Dry-Wet tests of 0'1 = 0'2 performed by Okamoto and Kitagawa. 3) The results of two-step-fatigue tests in salt water (designated as Wet- Wet) are shown in Fig.3(c). When difference between the primary stress, 0'1, and the secondary stress, O'z, is large and 0'1 is higher than 0'2, in the case of high-to-low tow-step tests such as 294MPa-98MPa and 265MPa-98MPa (named H-L tests), N2 equal nearly to N12 for the region of N1/Nn <0.5-0.6. On the other hand, in the case of low-to-high two-step tests such as 98MPa- 265MPa and 98MPa-294MPa (named L-H tests), the cumulative ratio LNi/Nfi is consistently less than one. On the contrary, this is greater than one for H-L tests. When difference between 0'1 and 0'2 is small, in the case such as 245MPa-265MPa and 294MPa-265MPa, Miner's rule is realized independently of stress sequence.
In conclusion, it was clarified that the values of the cumulative ratios in two-step fatigue tests involving environmental effects are changed complexly by magnitude of stress and stress sequences.
3.3 The effect of cyclic stressing on crack growth rate
Many cracks were observed on the smooth specimen surface during fatigue process in air and in salt water. Fig.4 shows the distributions of crack lengths plotted on the weibull probability paper.
� 90
� BO :::::;- 7 0
� g8
"'" 40
.-e 30 ] co 20
.0 2 0. 10
5
1
N N/tlf 01.63xlo51o.so el.84xlo51o.56 82.04xl0510.63 C>2.45xloslo. 75 (])2. 86xlo5 I o. 88 ()3. 26xl051 0. 99
- Calculated air 1 a=26511Pa
Crack length 2/ (mm)
N N/Nf 05.18xl0410.28 eG.48xlo4I0.35 97.7 7 xl0410.42 C)l.04xloslo.57
(])L. 30xlo5 1 o. 7 1
()1. 5 5 X 1 0 5 I 0 . B 5
- Calc ulated
Fig. 4 An example of distribution of crack length on ]IS S45C smoothed specimen surface during fatigue. Data is plotted on the Weibull probability paper.
It can be seen from Fig.4 that the distributions of crack lengths shift to the right direction with stress cycling. It is known that crack growth rate for these distributed cracks has a statistical
6) 7)
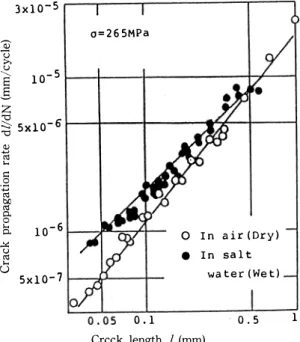
distributions. In this section, however, the effect of cyclic stressing of the primary stress on the behaviour of crack growth under the secondary stress level is investigated by the observation of the main crack which lead the final failure of the specimen. Fig.5 shows the relationships
� 5 �
Bulletin of Faculty of Engineering Toyama University 1984
between crack growth rate,dl/dN, and half crack length, l, obtained under the fatigue tests at stress o-=265MPa in air and in salt water. It can be seen from Fig.5 that crack growth rate for corrosion fatigue is larger than that for fatigue in air in the region of small crack length.
In the region that fatigue life at the secondary stress level is most strengthened by the primary stress as shown in Fig.3(a), N,/Nn=O.l-0.3, it was observed that micro cracks whose length were about 80 -100J.Lm had been already initiated. The propagation behaviour of micro cracks which was initiated and propagated at the primary stress level were observed during the fatigue tests at the secondary stress level of 265MPa. The relationships between dl/dN and l for these micro
3xlo-5
o=265MPa Q) u
» u lo-5 ----Ei
s z
"0
::::.- 5x1o-6
"0 ..., Q) c<S ....
c: 0
·p c<S
� 0.
0 s.
� u c<S ....
u
10-6 0 In air(Dryl
• In salt
5xlo-7 water (Wet)
0. 1 ' 0. 5
Creek length l (mm)
Fig. 5 Relations between crack propagation rate dl/dN and half crack length l.
1
cracks propagated at the secondary stress level are shown in Fig.6. The solid line written in Fig.
6 represents the crack growth rate for fatigue tests under constant stress amplitude as shown in Fig.5.
a 1 =255t1Pa 02=265MPa
o1=2 4MPa 02=265MPa
Crack length l (mm)
o1=9Bt-1Pa o2=265MPa
Fig. 6 Effects of cyclic stressing of the primary stress on the crack propagation rate of the micro cracks occured on specimen surface under the secondary stress.
- 6-
S.lshihara, K.Shiozawa, K.Miyao : The Cumulative Damage under Two-step Corrosion Fatigue Tests
It can be seen that crack growth rate under the secondary stress for Dry-Dry tests (Fig.6(a)) is lower than that for constant amplitude tests. This result is due to work-hardening and strain aging in the vicinity of micro crack tip which is formed during the fatigue of primary stress level.
On the other hand, in Dry-Wet tests (Fig.6(b)) and Wet-Wet tests (Fig.6(c)), the effects of stressing of the primary stress on the crack growth under the secondary stress are not recognized and dl/
dN under the secondary stress is nearly equal to that for constant stress amplitude. These phenomenons are considered to be due to both the formation of hardened surface layer based on 8)
the work-hardening by the stressing of the primary stress and the elimination of hardened surface by dissolution of the specimen surface under corrosive environments. In order to investigate the above mentioned phenomenons in detail, X-ray half-value breadth (micro lattice strain) was measured on the specimen surface during fatigue process.
3.4 Change of X-ray half-value breadth during fatigue process
Fig.7 shows the relationships be- S45C,RB
tween X-ray half-value breadth ratio, b/B, (B: X-ray half-value breadth for annealed specimen) and fatigue life ratio, N/Nr+O.Ol. In fatigue in air, the effect of stress amplitude are not observed in the relationship between b/B and N/Nr+O.Ol, and there exists a linear relationship between b/B and log (N/Nr+O.Ol) except the neigh
borhood of fatigue failure. In corro
sion fatigue, aside from the experi
mental results for <J' = 294MPa, the
l.lC r---�
same tendencies as those for fatigue in air can be observed. But the values of
1.05
1.15
1.10
1.05
In salt water
<D: cr=29 4MPa 0 'cr=265MPa e,cr=245MPa 9 :cr= 98MPa
In air
Fatigue life ratio N/N1 + 0.01 b/B are smaller than those for fatigue Fig. 7 Relations between X-ray half-value breadth
· · · d' d b d d 1. Th' ratio b/ B and cycle ratio (N/N1 + 0.01).
m a1r m 1eate y otte me. 1s
1
tendencies are same as those of plane bending tests performed by Nagao using SM41A steel and 9)
those of hardness distribution near the specimen surface of aluminum alloy obtained by authg�s.
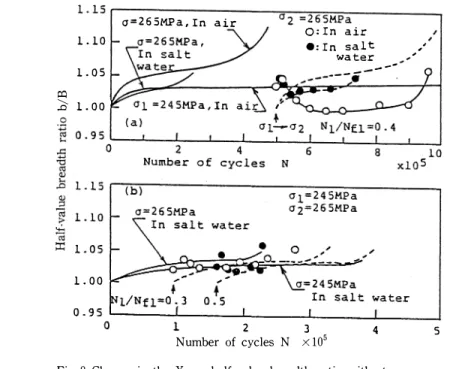
Fig.8 shows the change of b/B during two-step fatigue tests.
Fig.8(a) shows the results of experiments carried out under the secondary stress level in laboratory air or in salt water after cycling at the primary stress level in laboratory air. In Dry
Dry test, b/B increases temporarily after changing the primary stress level to the secondary one (<J'1-4<J'2) and then decreases with stress cycling. This phenomenon about b/B is the same as that for prestrained specimen. On the other hand, in Dry-Wet tests represented by the mark e, b/B shows the same behaviour as that for Dry-Dry test after changing stress level, but thereafter increases with stress cycling. The dotted lines shown in Fig.8 indicate b/B-N relations of the virgin material fatigued in air and in salt water which were moved to the point of stress changing.
It can be seen that the effect of the primary stress on b/B-N relation was disappeared in Dry-Wet
- 7-
Bulletin of Faculty of Engineering Toyama University 1984
l.lsr------����-----�
o=265MPa, In air 02 =265MPa 1.10
1. 05
:o-Q:l 1.00
1.00
Q: In air e:In salt
water
2 3
Number of cycles N x 105
---
4
Fig 8 Change in the X-ray half-value breadth ratio with stress cycling in two-step fatigue tests.
- ' -
5
test, because b/B changes on this dotted line. This experimental result is one of the reasons why the effect of cyclic stressing of the primary stress on the fatigue life under the secondary stress cannot be observed in the region N 1 /N 11 < 0.5 of Fig.3(b). Fig.8(b) shows the results of the experiments (Wet-Wet) in which the primary stress was applied to the cycle ratio of N1/Nn=O.
3 and 0.5 in salt water and then continued the fatigue test to failure at the secondary stress in salt water. In this case, the behaviours of b/B are also the same as those for Dry-Dry tests when the stress amplitude is changed, but thereafter the behaviours of b/B are changed complexly with stress cycling.
It is widely believed that if micro cracks are initiated by applying the primary stress 0"1 and 10)
then change the stress 0"1 to O"z (t:rz > t:r1), drastic concentration of microscopic strain will be occured in the vicinity of micro crack tip and new slip will be resulted in other slip-plane. Therefore, the increase of b/B will occur just after changing the stress level. It has also been considered that b/B decreased by relaxation of microscopic strain with stress cycling or disappearance of microscopic strain into microcrack.
The values of b/B were recognized to decrease in Dry-Dry tests, because the region of plastic deformation in the vicinity of micro crack tip caused by stressing of the primary stress are considered to be work-softened and disappeared under the secondary stress. In Dry-Wet tests, the effect of the primary stress on the behaviour of b/B and crack growth rate at the secondar�
stress are not recognized, because the region of plastic deformation are eliminated by dissol�Hon
of specimen surface during stress cycling in salt water. In Wet-Wet tests, cyclically induced plastic deformation regions stated above are impossible to be formed because of dissolution of 8)
specimen surface during stress cycling. This is supported by the experimental result that the
� 8 �
S.Ishihara, K.Shiozawa, K.Miyao : The Cumulative Damage under Two-step Corrosion Fatigue Tests
values of b/B in corrosion fatigue are smaller than those in laboratory air as shown in Fig.7.
3.5 The relationship between maximum crack length and fatigue damage
Recent studies have revealed that fatigue damage can be corresponded to the initiation and growth of microcracks on the specimen surface. As stated in the preceding section, many cracks are initiated on the specimen surface subjected to fatigue in air and in salt water and most part of the fatigue life is occupied with the period of crack growth. It may be reasonable in this study to consider that fatigue damage can be corresponded to the behaviour of distributed cracks.
Also, it will be thought that fatigue life is governed by the behaviour of the crack whose length is the longest in all distributed cracks. In this section, we consider the maximum crack length as the scale representing fatigue damage at a certain cycles and lead the maximum crack length from distribution of crack lengths.
In order to represent the distributions of crack lengths quantitatively, the distribution of crack lengths is approximated by the following three-parameter W eibull distributions;
F (2l) = 1 � expj�(2/� y0)mo/a01 ....... . . .... . . . ... . . ... .... . . (!)
where, rna, ao and Yo are shape, scale and location parameters, respectively. The solid lines written in Fig.4 show the results of approximation by eq.(l). It can be seen that the distributions of crack lengths are approximated enough by three-parameter Weibull distributions.
According to statistics of extremes, the distribution of the maximum crack lengths is given 14)
by following equation;
</J (2lm.,) = exp [ �exp i�a (21m., � W) I J
a= (1 n nt) 1-1/m, • mo . ao -1/m,
!···
. . ...... . . . ... ..... . . ... . ....... . . (2) where, nt is the number of total cracks initiated at number of cycles N and W is the characteristic maximum crack length. As the maximum crack length, 24nax. observed in the specimen surface can be represented by the characteristic maximum crack length, W. 24nax is determined by the three parameters for the distribution of crack lengths and number of cracks, nto as follows;24nax =Yo +(ao 1n nt)l/mo . . . ... . . ... . . ..... . . ... . . (3) We have already reported the following equations for these three parameters and nt; 15)
} ... . . ... . . .... . . ..... (4) where, s, 'fl, o, c, k3, "l', �. C3 and c. are constants which are independent of stress amplitude and number of cycles. These constants are determined by conducting fatigue tests under a few stress amplitude in air and in salt water and investigating the distributions of crack lengths. cp and lo are the area of specimen and the smallest half crack length which can be detected, respectively.
- 9-
Bulletin of Faculty of Engineering Toyama University 1984
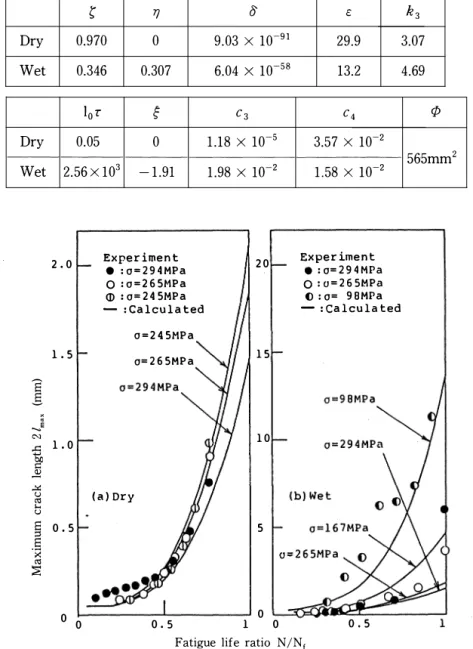
The value of these constants obtained in this experiment is listed in Table.IV.
Table. IV Value of the parameters in eq (4) obtained experimentally.
Dry Wet
Dry Wet
8 s
_e N ..<:: ....,
� �
..!:<:
u ro ... u
a ;::l
·:;: a
::.:E ro
t TJ 0 c k3
0.970 0 9.03 X 10-91 29.9 3.07
0.346 0.307 6.04 X 10-58 13.2 4.69
10 r � c3 c4 rp
0.05 0 1.18 X 10⁻⁵ 3.57 X 10⁻²
565mm2 2.56 X 10³ -1.91 1.98 X 10⁻² 1.58 X 10⁻²
2.0 Experiment 20 Experiment
• :a=294MPa • :a=294MPa
0 :a =265MPa 0 :o=265MPa
<D :a=245MPa ():a= 98MPa
-:Calculated -:Calculated
a =245MPa
1.5 a=265MPa 15
1.0 10
(a) Dry
0.5 5
0 0
0 0.5 1 0 0.5
Fatigue life ratio N/N1
Fig. 9 Change of the maximum surface crack length with stress cycling.
Substituting eq.(4) into eq.(3), we obtain following equation for 2�ax as a function of stress amplitude and number of cycles;
2/max = Yo + ( oif)1!m, Nk,!m, j ln ( rf>C3) + C4 af lim, · · · ·· ·(5)
- 10-
S.Ishihara, K.Shiozawa, K.Miyao : The Cumulative Damage under Two-step Corrosion Fatigue Tests
Using the condition of N = N r at 2 �ax= n. it will be obtained the following equation for 2�ax as a function of fatigue life ratio, N /N ,.
2/max = Yo + (2/c
-
Yo) (N/ Nf) k,lmo ···•••••••••••••••••••·•···(6) Where 2/ c is the critical crack length that cause final failure of the specimen. The calculation of eq.(6) can be performed using the value of constants listed in Table.IV. The results are shown in Fig.9.Experimentally obtained 2�ax are also plotted against the fatigue life ratio, N/N, in this figure.
It can be seen that the calculated results of 2�ax coincided well with experimental results in laboratory air and in salt water. The maximum crack length occured during fatigue can be estimated accurately by eq.(6).
3.6 Consideration about the cumulative fatigue damage rule
It was claryfied that the maximum crack length obtained from the distribution of crack lengths is useful for the evaluation of fatigue damage. In this section, the cumulative damage rule will be investigated for two-step fatigue tests involving the change of environment.
The maximum crack length, 2�ax, observed at the cycle ratio, NdNn, under the primary stress level of 0'1 may be observed at the cycle ratio of (l-NdNr2) under the secondary stress level of 0'2. Therefore, following relationship is obtained;
where subscript 'T' and "2" show the conditions under the primary stress, O'�t and the secondary stress, 0'2, respectively. Deforming eq.(7), non-linear cumulative damage rule for two-step fatigue
test is given as follows:
where,
( NI INn )k;,l m., - h (1 - Nd Nf2 )k,l m., = a h = (2 lc2- Yo2) I (2/cl - Yo!)
a = ( Yo2 - Yo1) I ( 2 lei - J'o1 ).
)
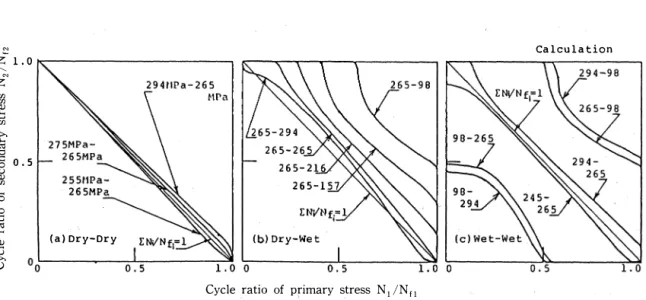
···(8)Using the value of the constants listed in table IV, we can perform the calculation of eq.(8) and the results are shown in Fig. 10. Calculated results for Dry-Wet tests (Fig.lO(b)) and Wet-Wet tests (Fig.lO(c)) have the same tendencies as experimental results as shown in Fig.3(b) and (c).
On the other hand, calculated results for Dry-Dry tests in Fig.lO(a) coincided with foil wing Miner's rule:
N11Nn + N21N.r2 = 1 ...
.
....
... (9) Eq.(8) will be transformed to the linear cumulative damage rule of eq.(9) if following conditions are satisfied: ( i ) Location parameter does not change during two-step fatigue test, ( ii ) critical crack length, 21.:, is independent of stress amplitude and environment, and (iii) shape parameter is independent of stress amplitude and the dependence of scale parameter on number of cycles- 11 -
Bulletin of Faculty of Engineering Toyama University 1984
z- 1. � o tot---,
Calculation
"
z�
b 1:1 Ul
>.
'-<
.g 0 0.5
u � '0 .s � '-<
-g Q) u
(a)Dry-Dry
Cycle ratio of primary stress N 1 /N 11
Fig. 10 Estimated relations between N1/N11 and N2/N12 from taking fatigue damage as maximum surface crack length during stress cycling.
does not change during two-step fatigue test. Calculated results for two-step fatigue tests in laboratory air coincide with eq.(9), because the conditions stated above are satisfied. While, they don't coincide with experimental results. One of the reason of this disagreement is the effect of cyclic pre-history on the crack propagation. As pointed out by Murakami 16) et al, basic condition for organization of Miner's rule is that the crack growth under the secondary stress level was not affected by the cyclic stressing of the primary stress level. Both the calculated and experimental results in Wet-Wet tests coincide with Miner's rule in the case that the difference between a-, and 0'2 is small. This reason is considered as follows: The effect of cyclic stressing on the crack propagation disappears by corrosive dissolution as stated before. Also, the conditions of ( i ) -(iii) are all satisfied because of the two-step fatigue tests under constant environment.
However, in the case of two-step fatigue tests in which environment as well as stress amplitude are changed, Miner's rule is not realized because of the difference of the distribution of crack lengths in each step.
4. Conclusions
Two-step fatigue tests involving environmental change were performed on carbon steel, JIS S45C, and following results were obtained.
(1) In Dry-Dry tests, fatigue life under the secondary stress is strengthened by cyclic stressing of the primary stress in the regions N, /N n = 0.1- 0.3.
(2) In Dry-Wet tests, the number of cycles to failure N2 at the secondary stress level are not affected by the stress cycling at primary stress level in the region that N ,jN n is less than 0.5.
While, the reduction of life at secondary stress is in the region of N, /N n > 0.5.
(3) In Wet-Wet tests, when difference between 0'1 and 0'2 is large, and a-, is higher than o-2,
N 2 equal to N r2 for the region of N 1 /N n < 0.5- 0.6. On the other hand, in the case of O'r < O'z, the cumulative ratio is consistently less than one. When difference between a-, and O'z is small, Miner's rule is realized independently of stress sequence.
� 12 �
S.Ishihara, K.Shiozawa, K.Miyao : The Cumulative Damage under Two-step Corrosion Fatigue Tests
(4) In Dry-Wet and Wet-Wet tests, the effects of cyclic stressing of the primary stress on the behaviours of crack growth under the secondary stress were not observed.
(5) The values of X-ray half-value breadth ratio, b/B, in corrosion fatigue process are smaller than those for fatigue in laboratory air.
(6) The maximum crack length during fatigue was deduced by using the statistics of extremes and approximating the distribution of crack lengths by three-parameter Weibull distri
bution. Calculated results coincided well with experimental results.
(7) The cumulative damage for two-step fatigue test was introduced theoretically by regarding fatigue damage as the maximum crack length obtained from the statistical proper
ties of distributed cracks on the smooth specimen surface.
Acknowledgement
The authors wish to express their thanks to Professor I. Maekawa of Tohoku University for his helpful advices in the course of this work.
1 ) 2 ) 3 ) 4 ) 5 ) 6 ) 7 ) 8 ) 9 ) 10) 11) 12) 13)
K.
s.
s.
K.
H.
s.
H.
K.
M.
s.
H.
H.
References
Endo, Hiroshima Daigaku kogakubu Kenkyu Hokoku, 8, 171 (1958).
Okamoto and H. Kitagawa, Seisan Kenkyu, 10, 2 (1958).
Okamoto and H. Kitagawa, Jour.Japan.Soc.Mechanical Engineers, 62, 204 (1959).
Iwamoto, Trans.]apan.Soc.Mechanical Engineers, 23, 238 (1957).
Nakamura, S. Okazaki and T. Horikawa, Jour.Soc.Materials Science, Japan, 21, 1064 (1972).
Ishihara, K. Shiozawa and K. Miyao, Proc.]apan.Soc.Mechanical Engineers, No.827-l, 20 (1982).
Kitagawa andY. Nakasone, Proc.]apan.Soc.Mechanical Engineers, No.817-1, 22 (1981).
Shiozawa, S. Ishihara and K. Miyao, Jour.Soc.Meterials Science, Japan, 28, 745 (1979).
Nagao, "Selected Papers of M. Nagao", (1978).
Taira and K. Honda, Trans.Japan.Soc.Mechanical Engineers, 28, 455 (1962).
Masuda and D.]. Duquette, Metallurg.Trans, 6A, 87 (1975).
Nishitani and N. Morita, Trans.]apan.Soc.Mechanical Engineers, 39, 1711 (1973).
T. Yamada, T. Hoshide, T. Fujimura and M. Manabe, Trans.]apan.Soc.Mechanical Engineers, 49, 441 (1983).
14) E. ]. Gumbel, "Statistics of Extremes", (1958), Columbia Univ.Press, New York.
15) S. Ishihara, I. Maekawa, K. Shiozawa and K. Miyao, Proc. Japan.Soc.Mechanical Engineers, Hitachi Koenkai, 119 (1982).
16) K. Murakami, S. Harada, H. Taniishi, Y. Fukushima and T. Endo, Proc.]apan.Soc.Mechanical Engineers, No. 820-12, 281 (1982).
(Received October 31. 1983)
- 13-
wcーCo.系焼結合金の熱定数に関する実験的研究
竹 越 栄 俊, 平 沢 良 男 , 井 村 定 久
1 . 緒 言
WC-C o 系焼結合金は, 超硬合金として切削工具材料などにきわめて広〈使用きれ, それらの機械的 性質, 合金組織などに関して多数の研究(lH3�{1子われている。 きらに最近, その高温における耐摩耗 性, 高硬度, 高剛性率などが注目され, 高温用金型材料, 熱間圧廷ロール材料なと事への実用化研究カミ なされている。 高温用材料として要求される重要な因子としては, 高温における機械的強度だけでな く耐酸化性, 耐熱衝撃性などがあげられ, これらの性質についても一部報告(4)されている。 高温にお いては, 材料内部の温度匂配が大きくなるので, 熱応カ, 熱衝撃といった定常あるいは非定常の熱的 性質がとくに問題となる。 したがって, この温度勾配を支配する熱物性値として, 温度伝導率などの 測定が望まれているが, 今まであまり注目きれず, 一部の測定(5)(6)を除いて系統的にはほとんど研究 されていない。
本研究では, WC-CO系焼結合金の熱定数 (比熱, 熱伝導率, および温度伝導率)の測定を目的とし これらìl!IJ定値と温度, WCとC oの成分割合, WC 粒子の 粒径などとの関係について明らか にする。 ま た, 比熱および熱伝導率の実験値と, 従来までよく知られている2成分混合物系の比熱および熱伝導 率の推算式との比較もあわせて行い, このような焼結 合金に対する推算式の適用についても検討する。
2. 実験装置および方法
実験は温度伝導率と比熱を別々の装置で測定して求め, 熱伝導率はこれらと比重量との聞の関係か ら計算によって算出した。
2
_
1 温度伝導率の測定法温度伝導率はフラッシュ法 (別名ノ")レス加熱法) による非定常法で測定した。 これは1961年Pa rk e r
� (7)によって提案された方法で, 比較的簡単な装置で短時間に測定できるのが特長 である。 測定原理 は, 薄板形の試料の片面に光エネルギーを瞬間的に照射して試料を加熱し, その際の試料裏面の温度 上昇曲線から温度伝導率を求める方法である。 Pa rk e rらによれば試料の厚きをL (m), 試料裏面の温 度上昇が最大値の見に達するまでに要する時間をtl!2 (hr)とすれば, 温度伝導率。 (m2 /hr) は次式 で与えられる。
。= 1.37
止二
πChl2したがって, hl2を測定すればαが求められる。
(1)
Fig.l に温度伝導率測定装置の概略を示す。 実験試料③は円板形 (øI2X2mm) のものを使用し,
片面にレーザ一光を照射することによる試料裏面の温度上昇は, 裏面の中心にスポット溶接された6
- 14
0.08mmのC-A熱電対⑤で測定した。 試料裏面 の温度上昇はふつう1-2 'cと小さいので, 熱 起電力の増加分のみを正確に測定するために,
逆電圧装置⑥であらかじめ熱電対の見かけの起 電力が零となるようにしておき, レーザ一光の 照射による起電力の増加分だけを増幅器⑦で約 1200倍に増幅した。 この増幅された信号は波形 記憶装置⑧で、いったん記憶したの ち, ペン レコ ーダ⑨で記録した。 試料③は電気炉⑫に入れら れた石英ガラス管④内に設置され, 常温から約 1000'Cまでの測定が可能である。 石英yゲラス管 内部は0.005mmHg 以下の真空度に保たれてお り , 試料表面からの対流, 伝導による熱損失,
および試料の酸化防止などがなされている。
実験は電気炉の温度をPID調節器⑬で目的の 温度に設定し, 温度が一定になるまでしばらく 放置してから行い, 約25'Cおきに測定した。
2.2 比熱の測定法
Pa rk e r ら(7)によれば, フラッシュ法におい て試料表面の吸収エネルギー量を何らかの方法 で測定できれは 比熱の同時測定も可能で、ある が, レーザ一光の不均一性, 試料表面のエネル ギー吸収率の不明確さなどから比熱測定はか な り 誤差が大きい。 そこで, 本研究では別方法で
L....J ②
①Laser head ①Laser pow�r sup同ier
③Specimen ø Quartz glass tube ①Ther
m民ouple ①Can倒抑ptor ①Amplifier
旬)Tra市ient wave memory 00 Pen recorder
⑩Photo-transistor ⑪Trigger cirωt
⑫Electric furnace ⑬PID controller Fig.l. Block diagram of experimental apparatus for thermal diffusivity.
比熱を測定した。 その装置は断熱走査型比熱測
|⑮仁ゴ@I I⑫
定装置(真空理工製SH・3000型)で, その概 Lニ..J LニユJ Lニ
略図を時.2 に示す。 実験試料④は円柱形でそ ①Uniform temperature container ①Adー の大きさは約Ø16x30mm である。 測定方法は, iabatic containerωSpecimen container まず内部ヒータ⑤に定電力 の電流を流して試料 ①speci--
φ
Internal heater奈
川恥I heater (7) Reflective plate (8) Con-
の温度を連続的に上昇させ, その温度上昇に応 stant wattage supplier V 点、@ C:
...
A thermo-じてSCR出力⑫によって外部ヒータ⑥にも電 couple @ Amplifier ⑪円o cont削除r 流を流し, 断熱容量総と均熱容君喝の温度差が ⑫SCR out put⑬阿thermocouple 常に零となるように自動調節し, 断熱容器を完 ⑪Digital voltmeter ⑤Digi凶町order 全に断熱する。 なお, 断熱容器と均熱容器との Fig. 2. Block diagram of experimental
温度差はC・A熱電対⑨で検出し. PID調節器⑪ apparatus for spec茸ic heat.
によってSCR出力を調節する。試料の滋度上昇はP-R熱電対⑬とデジタル電圧言t@で0.1μVの分解能 で一定時間ごとに測定し, デジタル記録計⑬で記録する。 このとき, 試料の温度が,18 ('C )上昇する のに要する時間L1t(se c) を測定すれば, 比熱 C p(kca ljkg'C )は次式で与えられる。
WL1t M'C' p
Cp ニ 0.239一一一一一 一一ーニML18 M (2)
15一
出Llj大学工学部紀要訴\35巻 1984
Table 1. Chemical composition, specific weight and WC grain size of WC -Co sintered alloys.
Weight fraction Spec ifi c we i ght WC grain size
WC TaC Co y (kgjm3) (μ)
H 1 0.9425 0.0075 0.05 15070 1.0
H 2 0.9425 0.0075 0.05 15070 2
.
0G 3 0.90
一
0.10 14590 2.0G 4 0.85
一
o. 15 14000 2.0G 5 0.75
一
0.25 13140 2.0G 6 0.80
一
0.20 13550 4.5G 7 0.75
一
0.25 13130 4.5ここに, Wは内部ヒータ電力 (kW), Mは試料の重量(kg), ま た, MCp は断熱容器の内部構成物の熱 容量(kcaltC ) である。 あらかじめ各温度におけ るM'Cpを求めておけ ば, C p は式;(2)で計算できる。
なお, Fig.2 の測定装置本体は真空容器内におさめ られており , 実験開始前にあらかじめ不活性7ゲス のアルゴン とカゃス置換され, 試料の酸化防止などがなされている。
3. 実験試料
実験試料はTab le 1に示すように H1 からG7までの7種類作製し, それぞ、れの成分重量割合 , WC 粒度などは表に示す通り である。 WC の重量割合 は95%から75%まで5 種類に, WC 粒子の粒径は1 μから 4.5μ まで3種類に変化きせた。 なお, H 1 とH2の試料にはWC 粒子の粒径成長を防止する ため, わずかのTaC が混入されている。
試料の作製方法は, WC粉末とCo粉末 を所定の重 量割合 となるよ うに出合し, アセトン 添加による湿 式i見合 を約10時間行い, アセトン を蒸発除去したの ち, 約1.5%のパラフィン を成形補助剤として添加し,
ついで金烈 を用いてがjlto n/ cm2 の圧力で成形した。
つぎに,700'Cで約1時間脱水水素気流中で予備焼結 し, 最後に約40分間1360-1425'C ,10←3 mmHg の真 空度て・本焼結 を行った。 出来上った試料は表面がほ ぼ滑 らかで, 比重量のìJ!iJ定から気孔率はほとんど1
%以下 であった。 Fi g. 3 に1000倍に拡大した各試料 の顕微鏡写真 を示す。 図中の黒〈見える部分がWC 粒子ー で, 粒子の分散状態および粒径のは、 らつきはと
もに良好である。
4. 実験結果および考察
まず実験装置の精度を調べ るために, 標準試料と して Ni (純度99.95%) を選ぴ, 温度伝導率のìJ!iJ定 16
G6 G7
Fig.3. 加iicroscopíc structures of WC-Co sintered alloys
'--ー」
10μ
竹越・平i!( .井村:WC.CO系焼結合金の熱定数に関する実験的研究
を行った結果を Fi g. 4に示す。 図中のO印が実験値, ー0.10 実総が文献{直則(Ni純度99.99%)である。 図からわ 言
かるように実験値と文献値はほぼ一致しており, 誤
4∞ 600 8∞
T.m同日tur.. B (.C) ま た,G lはWCの重量割合て、ある。 Fi g.9に温度 200 Fig.6. Relationship between specific heat
℃におけ る比熱とWC の重量割合との関係を示す。 andtemperature.
0印が各試料の実験値, 実線が式(3)の計算値を示す。 ただし, 式(初計算においてCoの比熱は文df占
o . 113kcal/kg'Cを使用した。 各試料と も実験値と計算値はほぼ3%以内で一致している。 他 の温度に おいて も全く同様の傾向にあった。 式(3)は単なる混合物の比熱の計算式であるから,WC.Co 系焼結合 金の比熱はWCとCoの混 合物と見なして計算すればよいことがわか った。 あお, 417 'c付近には Co の変態点が存在し, その温度て"Coの比熱は約20%増加して鋭いピークを持つ が,Fi g.6-8 の実験結果 ではその景簿がほとんど見られない。 これはWC-Co系焼結合金ではCo量が上国交的少ないからであろう。
差は最大で も7%以内となっている。 Fi g.5は上述 と同じ純度のNiを用いて行った比熱の実験結果を示 す。 同じくO印が実験値, 実線が文献値(9) (Ni純度 99.99% ) で, 両者はよく一致しており, 600'C以上 からL、くぶん差がでてくるがそれで も最大4%程度 である。 したがって, 温度伝導率および比熱の実験
装置とも精度はほぼ、満足のいくものである。
4. 1 比熱
Fi g.6 - 8に, WC 粒子の粒径別に各実験試料の比 熱と温度の関係を示す。 各試料と も温度上昇とと も に比熱は増加するが, 常温 から約 300'cまでか なり 急激に増加し, それ以上の温度ではややゆるやかに 増加する。 つぎに,WCとCoの重量割合と比熱との関 連性について検討してみる。 たとえば, Fi g.7 およ び8に示すように,Co の含有量の多い試料ほど比熱 が大きくなっている。 これは Co の比熱がWC の比 熱より も大きい(Coの比熱はWCの比熱の約2倍強) ためであると思われる。 また, 同じ 成分割合の試料 (H lとH2)を比較してみると, 全温度域にわたって 比熱はほとんど一致することがわかる。 HlとH2 の 試料はWC 粒子の粒径 のみが異なっているので, こ の結果は, WC の粒径が変化しで も比熱に影響をお よ ぼさないことを示している。 同様な結果は, G 5 とG7の試料について も成立することがわか ったの で, G 5 の比熱は図に示してない。
Fi g.7にはWC単体の粒子(2μ)の比熱測定結果 も 同時に示しであるが, この値と Co の比熱から各試 料の比熱CP*を次式のように計算してみた。
CP*ニ CpIG l+CP 2 (1 -GI) (3)
ここに,CP l, CP 2はそれぞれWCとCo の比熱であり,
17
0.0
ao 《U《U0.h副司、,一ωコ 件。《Unu 司-aoZ』』@工」F 。
o 100 200 300 400 500
Temperature.8 (.C) Fig.4. Comparison between experimental
and literature values on thermal diffusivity of nickel.
0.16,
u �
晶
S;; 0.14
主•
0.1喝 200 400 600 800
Temperature. 8 (.C) Fig.5. Comparison between experimental and
literature values on specific heat of nickel
【0.07 U
-
ぞ苛u a・z
ug3ι邑的 ,。内unu d--・2 乱、nu nu
200
![Fig. 2 S-N diagram of ]IS S45C carbon steel fatigued under rotary bending in laboratory air and in salt water (3.0 % NaCI) kept at 298K](https://thumb-ap.123doks.com/thumbv2/123deta/10103269.1938037/7.786.190.612.140.424/diagram-carbon-steel-fatigued-rotary-bending-laboratory-water.webp)
![Fig. 4 An example of distribution of crack length on ]IS S45C smoothed specimen surface during fatigue](https://thumb-ap.123doks.com/thumbv2/123deta/10103269.1938037/9.778.122.671.549.823/example-distribution-crack-length-smoothed-specimen-surface-fatigue.webp)