九州大学学術情報リポジトリ
Kyushu University Institutional Repository
養豚経営における生産効率および新技術導入効果に 関する研究:ベトナム紅河デルタからの証拠
グエン, ティ, リー
http://hdl.handle.net/2324/4110559
出版情報:Kyushu University, 2020, 博士(農学), 課程博士 バージョン:
権利関係:
STUDY ON PRODUCTION EFFICIENCY AND IMPACTS OF NEW TECHNOLOGIES IN PIG FARM HOUSEHOLD:
EVIDENCE FROM RED RIVER DELTA OF VIETNAM
NGUYEN THI LY
2020
GRADUATE SCHOOL OF BIORESOURCE AND BIOENVIRONMENTAL SCIENCES DEPARTMENT OF AGRICULTURAL AND RESOURCE ECONOMICS
LABORATORY OF AGRICULTURAL AND FARM MANAGEMENT
STUDY ON PRODUCTION EFFICIENCY AND IMPACTS OF NEW TECHNOLOGIES IN PIG FARM HOUSEHOLD:
EVIDENCE FROM RED RIVER DELTA OF VIETNAM
NGUYEN THI LY
FUKUOKA, JAPAN
2020
STUDY ON PRODUCTION EFFICIENCY AND IMPACTS OF NEW TECHNOLOGIES IN PIG FARM HOUSEHOLD: EVIDENCE FROM RED RIVER DELTA OF VIETNAM
BY
NGUYEN THI LY A Dissertation
Submitted to Kyushu University in partial fulfillment of the requirement for the degree of DOCTOR OF PHILOSOPHY
in
AGRICULTURAL AND RESOURCE ECONOMICS Supervised by:
Professor: Teruaki NANSEKI, PhD.
Assistant Professor: Yosuke CHOMEI, PhD.
Committee members:
Professor: Teruaki NANSEKI, PhD Professor: Mitsuyasu YABE, PhD Professor: Susumu FUKUDA, PhD
Fukuoka, Japan 2020
ii
ACKNOWLEDGEMENTS
The research included in this dissertation could not be done without the guidance, patience, help and support from many individuals and organizations. On this occasion, I would like to thank you all people who have contributed to the successful completion of this dissertation.
Firstly, I would like to extend my deepest gratitude to my supervisor Professor Teruaki Nanseki for his patience, precious support and guidance me over my doctorate course. He not only directly has supervised my research with the most carefulness, valuable suggestions and constructive comments that help me to improve a lot the contents of the thesis. He also encourages and supports me to overcome many mental problems of my social life. Besides of this, I am extremely grateful to my assistant professor Yosuke Chomei for his kindness and his valuable comments to my research. He always stays in the back to support me to get over the challenges in the research. Furthermore, he always shares his opinions freely to me about the social life too.
I would also like to express my deepest appreciation to Professor Mitsuyasu Yabe and Professor Susumu Fukuda for taking part in the dissertation committee and kindly giving the comments to revise the final dissertation.
I would like to send all my appreciation to other professors, associate professors, assistant professors and all the staffs of Faculty of Agriculture, Kyushu University who always support me to complete well my doctorate course.
I would like to send my thankful to all my lab mates in the Laboratory of Agricultural and Farm Management of the Faculty of Agriculture, Kyushu University for their discussion in the seminar time to improve my research results and for their kindness and friendly to sharing their social life with me. Also, I would like to thank you Dr. Li Dongpo who is a researcher in the Laboratory of Agricultural and Farm Management for his valuable comments in the seminar.
I would like to send my appreciation to the Vietnamese Government that sponsors the scholarship for my doctorate course in Japan.
I would like to thank my colleagues in Vietnam National University of Agriculture who always support and encourage me to complete the doctorate course. Especially, I want to say thank you to Associate Professor. Dr. Pham Van Hung, Associate Professor. Dr. Nguyen Thi Duong Nga, Dr. Nguyen Thi Thu Huyen, MSc. Tran Van Long, MSc. Nguyen Thi Huyen
iii Trang, Ms. Pham Kieu My for their consultant and for contacting to the Department of Agriculture and Rural Development in Hung Yen province and its Agriculture and Rural Development Department division in Tien Lu district and Khoai Chau district as well as their help to conduct the survey. Also, I would like to thank you the third and fourth year students who helped me to conduct the survey. And, I would like to thank all the officers in the Department of Rural and Development of Hung Yen province and the district agriculture division staffs in Tien Lu district and Khoai Chau district, Hung Yen province, Vietnam for their consultant and all the farmers joining in the survey.
Lastly, I would like to send my thanks to my whole family and especially my husband, Nguyen Dinh Luan, and my daughter, Nguyen Kim Anh, who are moving and living in Japan with me for their patience.
Thank you all very much!
Fukuoka, August 6, 2020 Nguyen Thi Ly
iv
THESIS SUMMARY
Pig production is one of the most important sectors of livestock production in Vietnam. It brings job and income to Vietnamese farmer households who own mostly small scale. In this point, the government has built many strategies to develop this sector, especially focus on household level. Changing production scale of pig-producing household from scatter- small scale to commercial and large scale and applying new production technologies and management methods to increase production efficiency and to reduce pollution have been promoted. However, the achievement was limited for farmers at household level such low production efficiencies as well as low adoption rate in implementing new technologies.
Against this background, this study aimed to measure production efficiency of household pig production and its determinant; and to assess the adoption and impacts of new technologies in pig management of households in Red River Delta of Vietnam.
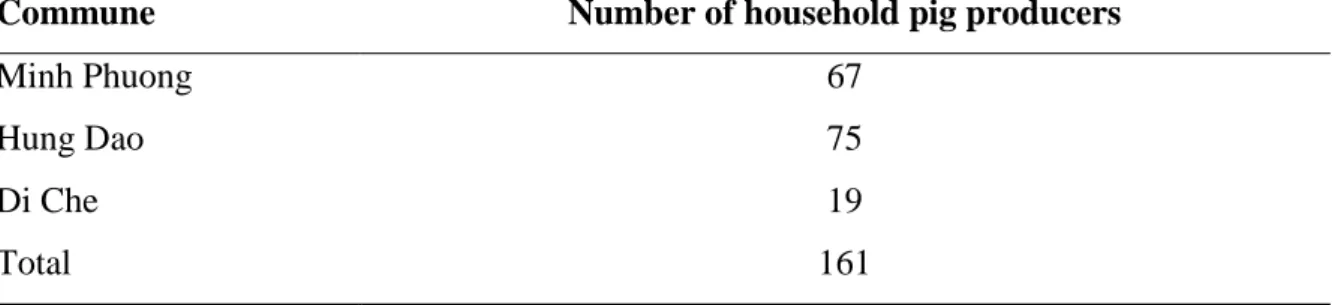
This study used two data sets that were collected by face-to-face interviewed using questionnaire in two periods. The first period was from August to September in 2014. This survey was conducted in Tien Lu district, Hung Yen province with the total sample size was 161 farrow-to-finish households. The second period was in April 2018. Tien Lu and Khoai Chau were two of four districts promoting VietGAHP under LIFSAP support for household pig production in Hung Yen province. The second date set included 114 VietGAHP households and 116 conventional households. A VietGAHP household is defined as a pig household who registered as a member of their district’s LIFSAP group. They were randomly chosen based on lists of VietGAHP groups. A conventional household (VietGAHP non- adopter) is a household pig producer as defined by MARD (2016) and one which was not registered as a member of VietGAHP groups. Data Envelopment Analysis (DEA) approach was used to estimate the level of efficiency scores in term of technical, allocative and cost efficiency, and Tobit model was used to determine the factors associating with these efficiency scores. Especially, the results of Tobit model were combined with those of three statistical tests (i.e., Spearman’s correlation, Analysis of Variance (ANOVA), and the Kruskal–Wallis test) to identify the impacts of production scales on these efficiency score. In addition to, we used Logit and Probit model to identify factors associating with Biogas adoption in manure management and VietGAHP adoption. Last, we used the z-test to show the impacts of VietGAHP adoption in implementing its criteria.
v Chapter 3 showed that overall technical efficiency in farrow-to-finish pig production of the household (TEcrs) was high (80.40%) but it fluctuated in a large range, from 52.57% to 100%. And the inefficiency of overall technical efficiency in pig production was mostly the product of less efficiency of pure technical efficiency (TEvrs) rather than scale efficiency (SE). The main factors that affect the overall technical efficiency in farrow-to-finish pig production in households were the live weight per fattened pig, breeding time, education, experience, number of family members joining in pig production, pig income, access to credit, and access to veterinary services. From above findings, it may be concluded that households should concentrate on improving their managerial skills rather than changing their scale in order to enhance their performance. In this regard, households could reduce their inputs and produce large quantities fattened pigs by utilizing breeding centers; also enhance their skills through training programs and by studying the best pig producers.
Another option for inefficient households is to reduce their breeding time by taking better care of the sows before they become pregnant and by weaning their piglets earlier.
Chapter 4 highlighted the main factors affecting biogas adoption that were education of household heads, household head became a member of member of any agricultural cooperatives or farmer groups, large farm size, and household income. All of these have positive impacts on the willingness to adopt biogas, except for some farmers with very high education and some households with high income, who might seek more modern manure management technologies. The results suggest that educational and awareness programs on the merits of biogas digesters, particularly via farmer support channels, should be implemented. Furthermore, financial programs should be offered to farmers, especially to low-income households.
Chapter 5 demonstrated that the factors positively contributing to VietGAHP adoption include male gender, farmer has been training in pig production issues by the extension staff, household income, and veterinary services, with the training factor as a substantial contributor. The factors presenting a challenge to this adoption included farm size, the number of family members participating in pig-raising, off-farm income, and biogas, with the last factor was an especially pivotal factor. Moreover, an expected result of the government’s support was that VietGAHP adoption had a positive impact on 9 out 15 compulsory practices and 8 of 14 optional practices. These imply that to attain food safety and environmental protection goals through a public GAP program for pig production, traditional adoption
vi factors—including a male farmer status, training, household wealth, and veterinary services—
remain key pillars on which government policies should focus.
In Chapter 6, we found that high efficiency scores of technical efficiency, allocative efficiency and cost efficiency among the Vietnamese pig-farming households were 89.2%, 84.6%, and 75.3%, respectively. Also we found that the cost inefficiency was caused by allocative inefficiency and technical inefficiency, respectively. Moreover, there were significantly higher allocative and cost efficiencies in larger production scale and adopting VietGAHP, which is consider as new management practices, brought the higher level of technical efficiency. Based on these findings, we suggest ways that the government could improve the current system to help even among household pig production who are the main agricultural producers in developing countries such as Vietnam, scale up their farms and adopt new management practices to improve their performance.
In overall, this study has pointed out five new findings as follow: 1) The level of overall technical efficiency in pig production was high but it fluctuated substantially among households; 2) Farmers’ financial ability in term of household’s income became the common factor effecting on the adoption of new technology. However, there was a conflict in adopting these new technologies because they had not yet supported each others; 3) The impact of new technologies such as VietGAHP has brought the substantial changes in implementing the difficult practices/criteria that were implemented by less than 50% of all farmers, especially for compulsory criteria; 4) Also, the other impact of VietGAHP adoption was that VietGAHP brought higher level of technical efficiency for households; 5) The larger production scale has been identified to improve the allocative efficiency and cost efficiency by exploring the advantages of economies of size.
Based on these findings, five practical implications may be formulated as follow: 1) Households should concentrate on improving their managerial skills rather than changing their scale in order to enhance their performance; 2) To encourage pig-producing households to adopt new technologies in the future, it is crucial to formulate a suitably formal credit system for household who were low income to access; 3) It can be introduced and encouraged pig-producing household who could not change their production scale in the future to adopt VietGAHP to improve their performances; 4) To increase the adoption rate of VietGAHP, traditional adoption factors—including training in pig production issue by the extension service and veterinary services—remain key pillars on which government policies should focus; 5) Scaling up the production scale was another way to improve the production
vii efficiency, the government should continue to deliver training and veterinary services to farmers.
Key words: biogas adoption, Data Envelopment Analysis, household pig production, impact of new technology, production scale, VietGAHP adoption, Vietnam
viii
TABLE OF CONTENT
ACKNOWLEDGEMENTS ... ii
THESIS SUMMARY ... iv
TABLE OF CONTENT ... viii
LIST OF TABLES ... xi
LIST OF FIGURES ... xiii
CHAPTER I: INTRODUCTION ... 1
1.1 Background of the study ... 1
1.2 Statements of problems ... 2
1.3 Conceptual framework ... 3
1.4 Objective of the study ... 5
1.5 Structure of dissertation ... 5
CHAPTER II: LITERATURE REVIEW ... 9
2.1 Vietnamese agriculture and pig production in Vietnam ... 9
2.1.1 Vietnamese agriculture ... 9
2.1.2 Trends of pig production ... 10
2.2 Definition and trends in pig-producing household in Vietnam ... 12
2.2.1 Definition of a pig-producing household ... 12
2.2.2 Trends of pig-producing households ... 13
2.3 History of VietGAHP for pig production in Vietnam ... 19
2.3.1 Decision No. 1506 (2008) ... 19
2.3.2 Decision No. 1947 (2011)/Decision No. 2970 (2012) ... 21
2.3.3 Decision No.4653 (2015) ... 22
2.3.4 Decision No.2509 (2016) ... 22
CHAPTER III: TECHNICAL EFFICIENCY IN VIETNAMESE HOUSEHOLDS’ PIG PRODUCTION ... 24
3.1 Introduction ... 24
3.2 Data and Methodology ... 25
3.2.1 Study site ... 25
3.2.2 Data collection method ... 26
3.2.3 Data envelopment analysis model ... 27
ix
3.2.4 Tobit model ... 28
3.3 Results and Discussion ... 31
3.3.1 The inputs and output in pig production function ... 31
3.3.2 The socioeconomic characteristics of households ... 31
3.3.3 Technical efficiency level ... 34
3.3.4 Factors affecting on technical efficiency ... 35
3.4 Conclusions and Implications ... 39
3.4.1 Conclusions ... 39
3.4.2 Implications ... 39
CHAPTER IV: BIOGAS ADOPTION IN MANURE MANAGEMENT OF VIETNAMESE HOUSEHOLDS’ PIG PRODUCTION ... 41
4.1 Introduction ... 41
4.2 Data and Methodology ... 42
4.2.1 Study sites and data collection... 42
4.2.2 Logit model ... 42
4.3 Results and Discussion ... 43
4.3.1 Household pig production socioeconomic characteristics... 43
4.3.2 Factors affecting biogas adoption in manure management ... 45
4.4 Conclusion and Implications ... 47
CHAPTER V: IMPACT OF VIETGAHP IMPLEMENTATION ON VIETNAMESE HOUSEHOLDS ’ PIG PRODUCTION ... 49
5.1 Introduction ... 49
5.2 Methodology ... 51
5.2.1 Site selection ... 51
5.2.2 VietGAHP criteria and adoption ... 51
5.2.3 Data collection ... 51
5.2.4 Empirical model of VietGAHP adoption ... 52
5.2.5 Variables used in VietGAHP adoption model ... 53
5.2.6 Measuring impact of VietGAHP adoption on its criteria implementation ... 53
5.3 Results and Discussion ... 55
5.3.1 Characteristics of Vietnamese HH pig production ... 55
5.3.2 Determinants of VietGAHP adoption in HH pig production ... 57
5.3.3 Current status of implementing VietGAHP criteria on HH pig production ... 60
x
5.3.4 Impact of VietGAHP adoption on implementing its criteria ... 63
5.4 Conclusions and Implications ... 69
CHAPTER VI: DIFFERENCES IN TECHNICAL, ALLOCATIVE, AND COST EFFICIENCIES AMONG PRODUCTION SCALES ... 71
6.1 Introduction ... 71
6.2 Methodology ... 73
6.2.1 Study Site ... 73
6.2.2 Data Collection ... 74
6.2.3 Data Envelopment Analysis ... 75
6.2.4 Tobit Model ... 78
6.3. Results and Discussion ... 79
6.3.1 Descriptive Statistics for Output, Inputs, and Characteristics of Vietnamese household pig production and their differences by Production Scale ... 79
6.3.2 Level of Technical, Allocative, Cost, and Scale Efficiencies ... 83
6.3.3 Influence of Production Scale and Other Factors on Technical, Allocative, and Cost Efficiencies ... 85
6.4. Conclusions and Policy Implications ... 87
CHAPTER VII: MAIN CONCLUSION AND POLICY IMPLICATION ... 90
7.1 Main conclusion ... 90
7.2 Policy Implication ... 91
LIST OF PUBLICATIONS AND PRESENTATIONS ... 93
1 List of publications ... 93
2 List of presentations ... 93
REFERENCES ... 94
APPENDIXES ... 102
Appendix A1 Definition and requirements for each VietGAHP criterion for HH pig production ... 102
Appendix A2: Assessed method of VietGAHP criteria for HH pig production ... 105
Appendix A3. Household survey questionnaire for FARROW-TO-FINISH type in 2014 ... 109
Appendix A4. Questionaire for household pig producer: Regarding to VietGAHP for household pig production ... 124
xi
LIST OF TABLES
Table 2.1 Shared of Vietnam's GDP by economic sector 2010-2018 ... 9
Table 2.2 Changes in the numbers of pig-producing households by regions ... 14
Table 2.3 The changes in the structure of the number of households raising pig by regions in the period 2006-2016 ... 15
Table 2.4 Changes in the numbers of pig-producing households by production scale in whole country ... 16
Table 2.5 Changes in the numbers of pig-producing households by production scale in Red River Delta ... 16
Table 2.6 Changes in the structure of the number of pig-producing households by production scale in whole country ... 17
Table 2.7 Changes in the structure of the number of pig-producing households by production scale in each region ... 18
Table 2.8 Assessment Checklist of VietGAHP for all pig producer untis ... 20
Table 2.9 Assessment Checklist of VietGAHP for pig producing-household ... 21
Table 3.1 Total samples by each commune in Tien Lu district ... 26
Table 3.2 Definition of variables use in DEA model ... 28
Table 3.3 The definition of variables used in Tobit model ... 30
Table 3.4 Descriptive statistics for the DEA model’s inputs and output ... 31
Table 3.5 Descriptive statistics for the households’ socioeconomic characteristics ... 33
Table 3.6 Frequency and percentage distribution of technical and scale efficiency ... 34
Table 3.7 The correlation matrix of technical efficiency ... 35
Table 3.8 Results of Tobit regression on pure technical and scale efficiency ... 36
Table 3.9 Partial effects of Tobit regression on pure technical and scale efficiency ... 38
Table 4.1 Definition of factors used in Logit model ... 43
Table 4.2 Descriptive statistics of factors used in logit model ... 44
Table 4.3 Results of logit regression on biogas adoption in manure management ... 45
Table 5.1 Explanatory variables and their definitions as used in the Probit model ... 54
Table 5.2 The differences in socio-economic characteristics between VietGAHP and conventional farmers ... 56
Table 5.3 Estimated coefficients and average marginal effects of factors associated with VietGAHP adoption ... 58
xii Table 5.4 The difference in the full adoption rates for each compulsory criteria between the two groups (% farmers) ... 64 Table 5.5 The difference in full adoption rates of each optional criteria between the two groups (% farmers) ... 68 Table 6.1 Distribution of sample size (%) ... 74 Table 6.2 Descriptive statistics for output and input variables and input prices used in DEA model ... 79 Table 6.3 Differences in output, inputs, and characteristics of Vietnamese household pig production by production scale ... 81 Table 6.4 Frequency distributions of TE, AE, CE, and SE scores ... 83 Table 6.5 Distribution of scale efficiency of pig-farming households by production scale (% of households) ... 84 Table 6.6 Factors’ influences on technical, allocative, and cost efficiencies in Vietnamese household pig production ... 86 Table 6.7 Factors’ influences on technical, allocative, and cost efficiencies in Vietnamese household pig production ... 87 Table 6.8 Statistical test of impact of production scale on the mean of TE, AE, and CE ... 87
xiii
LIST OF FIGURES
Figure 1.1 The conceptual framework ... 4
Figure 1.2 The structure of dissertation ... 8
Figure 2.1 Shared of annual employed person at 15 years of age and above of agriculture, forestry and fishing ... 10
Figure 2.2 Pig populations as of annual 1st October in Vietnam, 2008 – 2017 ... 10
Figure 2.3 Pig populations as of annual 1st October in Vietnam, 2008 – 2017 ... 11
Figure 2.4 Share of living weight of pig among living weight of main livestock products 2008-2017 ... 11
Figure 2.5 The living weight of pig in Vietnam, 2008 – 2017 ... 12
Figure 2.6 Changes in the number of households raising pig in 2006, 2011, 2016 ... 13
Figure 2.7 Flows of history of VietGAHP for pig production ... 19
Figure 3.1 The located of Tien Lu district, Hung Yen province ... 25
Figure 5.1 Frequency of farmers adopting each compulsory VietGAHP criterion ... 61
Figure 5.2 Frequency of farmers adopting each optional VietGAHP criteria ... 62
1 CHAPTER I: INTRODUCTION
1.1 Background of the study
Pig production is one of the most important sectors of livestock production in Vietnam. According to the General Statistics Office of Vietnam (GSO) (GSO, 2013), the value of livestock constitutes 26.8% of the gross agricultural output, a ratio that has been growing overtime. It is predicted that by 2020, livestock production, of which pig production is the greatest component, will constitute over 42% of agricultural output. It is further thought that pig production will come to supply 63% of the country’s total meat production by that same time (Vietnamese Prime Minister, 2008). It brings job and income to Vietnamese farmer households who own mostly small scale. Pig sector is one of the most important contributors to household income within the livestock sector (Epprecht, 2005).
However pig production had negatively impacted on the environment, including air, soil, and water pollution from waste, especially manure from pig production. Thus, the management of animal manure sources is one of the biggest challenges currently facing pig production in Vietnam. According to Vu et al. (2007), slurry, liquid manure, and solid manure are the three major manure types in pig farming while the four categories of pig manure management are non-treatment with direct disposal to fields or fishponds, composting, storage without treatment, and biogas production. Biogas production is perceived a good way to reduce some environmental problems in manure management, such as the spreading of pathogens and noxious odor emissions (Vu et al., 2007).
In this regard the Vietnamese government has built many strategies to develop livestock sector including pig production, especially focus on household level. Changing production scale of pig-producing household from scatter-small scale to commercial and large scale and applying new production technologies and management methods to increase production efficiency and to reduce pollution have been promoted. Firstly, the Vietnamese government’s strategy for the future of the pig sector through 2020 holds that production should be shifted from small-scale and family operations to large, intensive and commercial scale operations (Vietnamese Prime Minister, 2008). Then, Biogas technology was introduced in Vietnam in 2003 with the Biogas Program for the Animal Husbandry Sector in Vietnam (BPAHSV) encouraging construction of biogas digesters through cooperation between the Livestock Production Department of the Ministry of Agricultural and Rural Development and the Netherlands Development Organization (SNV) (BPAHSV, 2015b). To quality assurance and food safety pressures from international and domestic trading partners within the region,
2 as well as in response to sustainable environmental development, Vietnam developed its own GAP based on the GAP of Association of Southeast Asian Nations (ASEAN), (Premier and Ledger 2006). Specifically, the Vietnamese Good Animal Husbandry Practices (VietGAHP) publication describes GAPs for pig and other livestock (MARD 2008c, 2008d, 2008e, 2008f, 2011b, 2011c, 2015, 2016).
Currently, the total number of households raising pigs declined from around 4.1 million in 2011 to 3.44 million in 2016 (GSOV, 2018a). HH pig production supplied approximately 80% of Vietnamese pork and will continue to dominate the Vietnamese pig sector over the next decade (Lapar et al., 2011;Lapar, 2014; Tisdell, 2010). Also, in term of structural changes, the percentage of households keeping 1–5 pigs decreased significantly (down 10%), from 77.55% in 2011 to 67.55% in 2016; however, the percentage of households with more than five pigs increased in 2016 compared to 2011, with the greatest increase found among households with 20–49 pigs (up 4.09%). Moreover, current trends in Vietnamese pig- production industry notwithstanding, it is difficult to change immediately from a production characterized by small-scale farms to that of large-scale and commercial farms (Lapar, 2014;
Tisdell, 2009). Thus, the question remains whether there is any advantage to having pig- farming households scale up their production to improve farm performance.
Against the above background, it is important to evaluate the overall production efficiency of pig-producing households and the adoption of new technologies as well as the impacts of these technologies to contribute to the development of this sector in the future.
1.2 Statements of problems
The change of structure among production scales of households was slow, and smallholder pig-farm households were still the main pork suppliers in Vietnam (VGSO, 2018a). The households studied lacked the resources to become large commercial farms;
therefore, to remain competitive, it was imperative that they produce with maximum efficiency, changing their production scale to the extent possible to keep up with the market competition.
Although several studies have measured productive efficiency in pig farming, most of these ignored small-scale household operations in developing countries except for Mugera &
Featherstone (2008) and Tian et al. (2015). However, these studies only estimated the single component of production efficiency was technical efficiency. The question remains whether there is any advantage to having pig-farming households scale up their production to improve their farm performance in term of technical, allocative and cost efficiencies. Furthermore, we
3 could find no past studies that provided an analysis of the effect of production scale on all relevant efficiencies in the context of Vietnamese household pig farming.
In addition to, while VietGAHP and Biogas adoption were promised as the another ways to improve the farmer’ performance by enhancing the product quality and reducing pollution to the environment, the adoption rates were slow (GSOV, 2018a). However, changes in farmers’ behavior could be observed after VietGAHP adoption (Lapar et al. 2017).
Thus, some questions on farmers’ engagement and participation in the program still remain, as some VietGAHP standards are strict and difficult for farmers to adopt, especially for farmers with limited abilities (Nguyen 2017). It is needed to measure the impact of VietGAHP adoption on its implementation as the first step to improve the farmers’ behavior to achieve the final goal of producing VietGAHP products with safety and high quality.
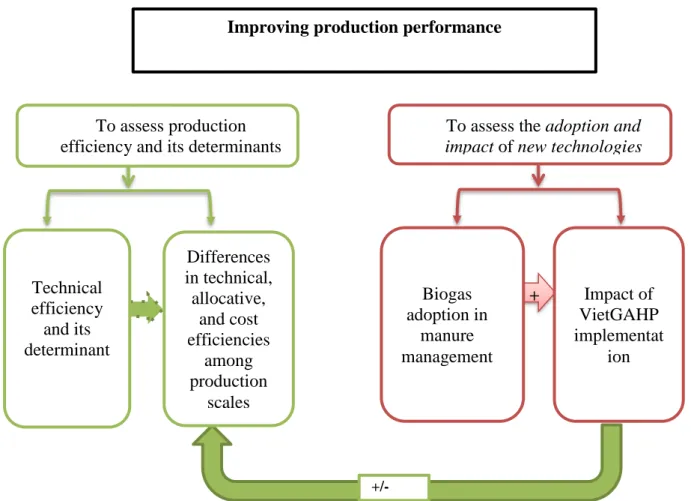
1.3 Conceptual framework
The conceptual framework of this study was illustrated in Figure 1.1. As stated in the above problem statement, pig-producing households was prominent in pig producers in Vietnam and was small scale with limited their input resources in term of land, financial but they owned family labors. They tent to reach a high performance as much as possible to improve their income and secure their jobs.
Rasmussen (2013) has shown that three reasons for productivity changes: (1) improved efficiency can be improve the production per input unit; (2) technological improvements/technological changes; (3) changes in the scale of production. Also, Rasmussen (2013) has mentioned very clearly about the relationship among productivity, efficiency and technological changes. It can be shortly and simply summarized as follow for a production where only uses one input x to production one output y.
“Productivity can be briefly defined as production (output) divided by input”. It means that: 𝑃𝑟𝑜𝑑𝑢𝑐𝑡𝑖𝑣𝑖𝑡𝑦 =𝑦
𝑥 (1.1)
“Efficiency can be briefly defined as the achieved compared to what can be achieved”.
It means that if used input x could potentially produce 100 units of output y but actually a producers only can produced 80 units of output, thus, the efficiency is 0.8 or 80%. Thus, changing (improving) the efficiency means that changing (improving) the position of a firm or a producer relatively to the current technological frontier.
4
“Technological changes (or technical change) is defined as a shift in the production function over time”, or in other words, “Technological change means that the frontier of the technology moves through time.”
The scale of production means that “the point on the production function where production takes place”. This point can be located in one of three areas of the production function: increasing returns to scale (IRS), decreasing returns to scale (DRS) and constant returns to scale (CRS).
Based on the theory of changes in productivity as shown above, this study assume that when farmers could get their highest performance or highest productivity with their current technologies with their current resources, also they need to assure the environment pollution by their production, they tent to find the other ways to improve their performances with their cost was the minimum as much as possible by scaling up their production scales and adopting new technologies or new management practices.
Figure 1.1 The conceptual framework Note: +/- means that a positive/negative affect
Technical + efficiency and its determinant
+/-
Improving production performance
To assess the adoption and impact of new technologies To assess production
efficiency and its determinants
Biogas adoption in
manure management
Impact of VietGAHP implementat
ion Differences
in technical, allocative,
and cost efficiencies
among production
scales
5 There were some previous studies, which had focused on the relationship between the adoption of new technologies in agriculture and the production efficiency (i.e. technical efficiency). Amara et al., (1999) found that farmers who were using conservation practices had greater incentives to use production input efficiently because they wanted to prevent environmental problems. It means that the adoption might be brought higher efficiency. While Mayen et al. (2010) pointed out that the organic technology was less productive than the conventional technology in dairy farm in United State. Therefore, this study made a hypothesis that whether when farmers adopt new technologies, their performances are lower or higher than before adoption, they might be adopt or not adopt new technologies.
This study would like to contribute to the policy makers, farmers in Vietnam and other developing countries where would like to develop the pig production in term of increase the production efficiency, product quality and reduce the impact to the environment by scale up production scale and adopt new technologies.
1.4 Objective of the study
Against this background, this study aimed to achieve two objectives as follow:
(1) Objective 1: to measure production efficiency of household pig production and its determinants; and
(2) Objective 2: to assess the adoption and impacts of new technologies in pig management of households in Red River Delta of Vietnam
1.5 Structure of dissertation
The structure of dissertation was shown in the Figure 1.2 and it contained seven chapters. In which, chapter 3 was focused on the first objective and chapter 4, chapter 5 and chapter 6 were contributed to the second objective.
Chapter I: Introduction
In this chapter, the general background of this study was introduced, followed by the problem statements and the conceptual framework. It also introduced the objectives of this study and its overall structure.
Chapter II: Literature Review
This chapter described literature relevant to the research objectives of this dissertation.
It is organized into three sections: (1) Vietnamese agriculture and trends of pig production; (2)
6 Definition and trends in household pig production in Vietnam; (3) Introducing the policy of scaling up the production scale in pig production and history of VietGAHP for household pig production
Chapter III: Technical efficiency and its determinants in household pig production
This chapter introduced detail about the role of pig production in households and the prominent of farrow-to-finish pig production type in Vietnam in the introduction part and the two-stage Data Envelopment Analysis approach in measurement of technical efficiency. The result and discussion of technical efficiency and its determinants in household pig production were shown. Last, the implication to improve the technical efficiency level was suggested.
Chapter IV: Biogas adoption in manure management of Vietnamese household pig production
This chapter used a logit model to determine the factors contributed to the decision to adopt Biogas system in manure management of households.
Chapter V: Impact of VietGAHP implementation on Vietnamese households ’ pig production
This chapter used a probit model to indicate the factors contribute to the decision to adopt a new management practice that aimed to improve the farmer’s production efficiency, high quality products as well as to reduce the impact on the environment and called VietGAHP. Also, this chapter assesses the impact of VietGAHP adoption in its implementation in terms of farmers’ perception.
Chapter VI: Differences in technical, allocative, and cost efficiencies among production scales
This chapter used again the two-stage Data Envelopment Analysis approach was used in the Chapter III to estimate not only technical efficiency but also another two components of
7 production efficiency were allocative and cost efficiency. This chapter also measured the impact of production scale on these efficiencies and that of VietGAHP as well.
Chapter VII: Main conclusion and policy implication
This chapter summarized all the main findings in this study and suggested policy implications to improve the performance for households raising pig in Vietnam.
8 Figure 1.2 The structure of dissertation
C ha pter I : In tr oduc ti on C ha pter I I: L ite ra tu re Re vi ew
Objective 1: To measure production efficiency of household pig production and its determinant
Chapter III: Technical efficiency and its determinants in household pig
production
Chapter VI: Differences in technical, allocative, and cost efficiencies among production
scales
C ha pter V II : M ai n co nc lus io n an d P ol ic y Im pl ic ati on Objective 2: To assess the adoption and impact of new technologies in pig
production management of household
Chapter IV: Biogas adoption in manure management of Vietnamese Household Pig
Production
Chapter V: Impact of VietGAHP implementation on Vietnamese
households’ pig production
9 CHAPTER II: LITERATURE REVIEW
This chapter will describe literature relevant to the research objectives of this dissertation. It is organized into three sections: (1) Vietnamese agriculture and trends of pig production; (2) Definition and trends in household pig production in Vietnam; (3) Introducing the history of VietGAHP for household pig production.
2.1 Vietnamese agriculture and pig production in Vietnam 2.1.1 Vietnamese agriculture
According to General Statistics Office of Vietnam, in 2017, GDP at current prices reached 5,006 trillion VND. In terms of 2017 economic structure, the agriculture, forestry and fishery sector continues the downtrend and made up 15.34% (Table 2.1).
Table 2.1 Shared of Vietnam's GDP by economic sector 2010-2018
Unit: % Year Agriculture,
forestry and fishing
Industry and
construction Service Products taxes less subsidies on products
2010 18.38 32.13 36.94 12.55
2011 19.57 32.24 36.73 11.46
2012 19.22 33.56 37.27 9.95
2013 17.96 33.19 38.74 10.11
2014 17.70 33.21 39.04 10.05
2015 16.99 33.25 39.73 10.02
2016 16.32 32.72 40.92 10.04
2017 15.34 33.40 41.26 10.00
Source: GSOV, 2019
While agriculture, forestry and fishing still shared the largest employed person at 15 year olds and above. It shared 55.09% of total employed persons in 2005 and shared 40.16% of total employed person in 2017 (Figure 2.1).
10 Figure 2.1 Shared of annual employed person at 15 years of age and above of agriculture, forestry and fishing
Source: GSOV, 2019
2.1.2 Trends of pig production 2.1.2.1 Trend of number of pig heads
According to General Statistics Office of Vietnam, the number of pigs as of annual 1st October in Vietnam fluctuated in the period of 2008-2017 (Figure 2.2). After the disease caused in 2008, the pig population in 2009 slight increased from 26,701,600 heads to 27,627,600 heads. Then the pig population as annual 1st October decreased gradually and reached a bottom to 26,264,400 heads in 2013. Again, the pig population rose and reached a peak at 29,075,300 heads in 2016 then fell in 2017 because of the price of output price fell.
Figure 2.2 Pig populations as of annual 1st October in Vietnam, 2008 – 2017 Source: GSO, 2020
55.09 52.94 52.31 51.54
49.50 48.39 47.37 46.73 46.28
44.02 41.86 40.16
- 10.00 20.00 30.00 40.00 50.00 60.00
2005 2007 2008 2009 2010 2011 2012 2013 2014 2015 2016 2017
%
26701.6
27627.6
27373.3
27056
26494
26264.4
26761.4
27750.7
29075.3
27406.8
24500 25000 25500 26000 26500 27000 27500 28000 28500 29000 29500
2008 2009 2010 2011 2012 2013 2014 2015 2016 2017
Thousand heads
11 Broken down the number of pig heads by region, it can be seen that Red River Delta is the top of region (Figure 2.3), followed by Northern midlands and mountainous area and North Central and Central Coast Area. In which, the number of pig heads of Northern midlands and mountainous area increased over time, that of North central and central coast area decreased.
Figure 2.3 Pig populations as of annual 1st October in Vietnam, 2008 – 2017 Source: GSO, 2020
2.1.2.2 Trend of volume of pork production
In Vietnam, pork is the main source of meat and is consumed the most. Among main livestock products, pig shared 79% of total living weight in 2008 and continues sharing 72%
in 2017 (Figure 2.4).
Figure 2.4 Share of living weight of pig among living weight of main livestock products 2008-2017
Source: GSO, 2020
0 1000 2000 3000 4000 5000 6000 7000 8000
2008 2009 2010 2011 2012 2013 2014 2015 2016 2017
Thousand heads
Red River Delta
Northern midlands and moutainous area
North Center and Center coastal areas
Central Highlands
South East
Mekong River Delta
79 78 76 74 74 74 73 73 73 72
- 20 40 60 80 100 120
2008 2009 2010 2011 2012 2013 2014 2015 2016 2017
Poultry production Beef production Buffalo production Pork production
12 Although the share of living weight of pig among living weight of main livestock products decreased slightly, total living weight of pig rise 34.2% over the period of ten year from 2008-2017 (Figure 2.5). The current of living weight of pig in 2017 is 3733.3 thousand tons and it continues to uptrend.
Figure 2.5 The living weight of pig in Vietnam, 2008 – 2017 Source: GSO, 2020
2.2 Definition and trends in pig-producing household in Vietnam 2.2.1 Definition of a pig-producing household
In general, a household joins in producing agricultural, forestry and finishing products is a household that all labors or most of labors take part in directly or indirectly in agriculture, forestry, and fishing activities. The household organizes their production and makes all decision of their production by their selves.
A livestock-producing household is a kind of livestock production at a family household with a scale production is less than the scale of a farm (usually called the commercial farm because it focus on produce the good selling to the market at a large scale) (MARD, 2016). The scale of a farm depends on the type of farms joining in producing livestock (MARD, 2011b). For the specialized farm in livestock production, it must have the total annual sale of livestock production at least 11 billion Vietnam dong. For the general farm
1Exchange rate: US$ 1 = 22,454 Vietnamese dong at the surveyed time.
2782.8
3035.9 3036.4 3098.9 3160 3228.7 3351.2 3491.6 3664.6 3733.3
0 500 1000 1500 2000 2500 3000 3500 4000
2008 2009 2010 2011 2012 2013 2014 2015 2016 2017
Thousand tons
13 that has a livestock production activity, it has a total agricultural land area is 3.1 hectares for South East region and Mekong River Delta region or 2.1 hectares for the rest regions in Vietnam and this farm joins in producing livestock production.
A pig-producing household in this study is a livestock-producing household who joins in pig activity for sale and total sale of all livestock products as well as the total agricultural land of this household are not met the requirement of the commercial farm defined by (MARD, 2011b).
2.2.2 Trends of pig-producing households
In general, in the period from 2006-2016, the total number of household raising pig in Vietnam and the number of very small-scale households who raising less 5 pig heads decreased sharply. However, the number of medium and large scale households increased, especially the households raising 50 pig heads and above. Also, there was a change of the structure of the number of pig-producing households among regions.
2.2.2.1 Changes in the number of pig-raising households
The number of pig-producing households in 2016 in Vietnam stood at 3,441,066, continuing a downward trend (Figure 2.6). It decreased 45.7% in the total number of households raising pig in whole country in ten years (Table 2.2).
Figure 2.6 Changes in the number of households raising pig in 2006, 2011, 2016 Source: GSO, 2007, 2012; Ban Chi Dao Tong Dieu Tra Trung Uong, 2017
6,331,941
4,131,513
3,441,066
- 1,000,000 2,000,000 3,000,000 4,000,000 5,000,000 6,000,000 7,000,000
2006 2011 2016
household
14 Table 2.2 Changes in the numbers of pig-producing households by regions
Unit: households Years Red River
Delta
Northern midlands and mountainous area
North Center and Center coastal areas
Central
Highlands South East Mekong River Delta
Whole country
2006 1,813,683 1,431,503 1,875,870 257,683 165,245 787,957 6,331,941
2011 870,504 1,204,391 1,238,887 210,796 110,075 496,860 4,131,513
2016 665,050 1,207,424 885,888 195,384 85,373 401,947 3,441,066
Changes (%) -63.3 -15.7 -52.8 -24.2 -48.3 -49.0 -45.7
Source: GSO, 2007, 2012; Ban Chi Dao Tong Dieu Tra Trung Uong, 2017
15 When households broken down by regions also indicate that the numbers of pig- producing households in 2016 in each region decreased from 10 years earlier (Table 2.2), with a remarkable decrease being seen in the Red River Delta with 63.3%.
Total number of pig-producing households mainly locates in three main regions including the Red River Delta, Northern Midlands and Mountain Area and North Central and Central Coast Area that are account for around 80% of total households in Vietnam (Table 2.3).
Table 2.3 The changes in the structure of the number of households raising pig by regions in the period 2006-2016
Unit: %
Year
Red River Delta
Northern midlands and mountainous
area
North Center and Center coastal areas
Central Highlands
South East
Mekong River Delta
2006 28.6 22.6 29.6 4.1 2.6 12.4
2011 21.1 29.2 30.0 5.1 2.7 12.0
2016 19.3 35.1 25.7 5.7 2.5 11.7
Changes (%)
-9.3 12.5 -3.9 1.6 -0.1 -0.8
Source: GSO, 2007, 2012; Ban Chi Dao Tong Dieu Tra Trung Uong, 2017
In term of the changes in the structure of the number of households raising pig by regions, it can be seen in the Table 2.3. This figure shows that there were sharply changes in the contribution of the Red River Delta and Northern midlands and mountainous area. The percentage of households raising pig in the Red River Delta decreased from 28.6% in 2006 to 19.3% in 2016 but that in the Northern midlands and mountainous area increased from 22.6%
in 2006 to 35.1% in 2016.
2.2.2.2 Changes in the production scale of the pig-producing households
The secondly, the households broken down by production scale indicate that in whole country the number of households raising less than 10 pig heads in 2016 decreased from 5 years ealier, with a remarkable decrease being seen in the number of households owing 5 pig heads and less (Table 2.4). However, the number of households in 2016 increased from 5 years earlier for owning 10-pig head or larger scales, with a remarkable rise being seen in the number of households owning 100 pig heads and more (Table 2.4).
16 Table 2.4 Changes in the numbers of pig-producing households by production scale in whole country
Unit: households
Production scale 2011 2016 Changes (%)
1-5 head 3,203,989 2,324,426 -27.5
6-9 head 367,169 323,306 -11.9
10-19 head 377,609 439,342 16.3
20-49 head 150,692 266,289 76.7
50-99 head 22,803 59,645 161.6
100 head or more 9,251 28,058 203.3
Total 4,131,513 3,441,066 -16.7
Source: Ban Chi Dao Tong Dieu Tra Trung Uong, 2017
Also, households broken down by production scale in Red River Delta indicates that the number of households in 2016 increased from 5 years earlier for households owing 20 pig heads or more, also with a remarkable rise being seen in the number of households owning 100 pig heads and more (Table 2.5). It indicates that the progress in production scale expansion at household level.
Table 2.5 Changes in the numbers of pig-producing households by production scale in Red River Delta
Unit: households
Production scale 2011 2016 Changes (%)
1-5 head 624,580 387,169 -38.0
6-9 head 66,042 46,916 -29.0
10-19 head 113,280 110,132 -2.8
20-49 head 56,097 89,913 60.3
50-99 head 8,113 21,622 166.5
100 head or more 2,392 9,298 288.7
Total 870,504 665,050 -23.6
Source: Ban Chi Dao Tong Dieu Tra Trung Uong, 2017
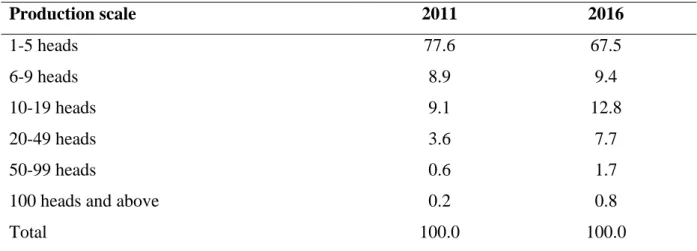
The changes in the structure of the number of pig-producing households by production scales in whole country show in the Table 2.6. It can be seen that the households raises from 1
17 to pig heads accounted the largest proportion in the number of households raising pig in 2016 with 67.5% although it decreased from 77.6% in 2011. However the portions of the other production scales increased, with a remarkable increase of production scale of 10 to 19 pig heads, a 3.7 percentage point increase.
Table 2.6 Changes in the structure of the number of pig-producing households by production scale in whole country
Unit: %
Production scale 2011 2016
1-5 heads 77.6 67.5
6-9 heads 8.9 9.4
10-19 heads 9.1 12.8
20-49 heads 3.6 7.7
50-99 heads 0.6 1.7
100 heads and above 0.2 0.8
Total 100.0 100.0
Source: Ban Chi Dao Tong Dieu Tra Trung Uong, 2017
In term of the changes in the structure of the number of pig-producing households by production scale in each region, it can be seen in the Table 2.7. The share of households had production scale of 1-5 pig heads was the largest and decreased from 2011 to 2016 in all regions. The sharply decreases of the share of the household having production scale of 1 to 5 pig heads belonged to the Mekong River Delta and Red River Delta with 15.2 percentage point and 13.5 percentage point, respectively.
18 Table 2.7 Changes in the structure of the number of pig-producing households by production scale in each region
Unit: % Production scale Red River
Delta
Northern Midlands and mountainous
area
North Center and Center coastal
areas
Central Highlands
South East Mekong River Delta
2011 2016 2011 2016 2011 2016 2011 2016 2011 2016 2011 2016
1-5 heads 71.7 58.2 80.2 72.0 85.0 76.3 74.5 70.0 43.2 34.2 71.4 56.2
6-9 heads 7.6 7.1 10.0 10.7 7.7 8.0 9.7 8.9 10.6 7.9 10.6 12.8
10-19 heads 13.0 16.6 7.5 11.1 5.5 9.6 10.7 11.5 22.8 20.0 11.7 17.4
20-49 heads 6.4 13.5 2.0 4.9 1.5 4.8 4.2 7.2 16.1 21.6 5.1 10.5
50-99 heads 0.9 3.3 0.2 0.9 0.2 0.9 0.6 1.5 4.3 8.8 0.8 2.2
100 heads and above
0.3 1.4 0.1 0.3 0.1 0.4 0.3 0.8 3.1 7.4 0.3 0.9
Total 100.0 100.0 100.0 100.0 100.0 100.0 100.0 100.0 100.0 100.0 100.0 100.0
Source: Ban Chi Dao Tong Dieu Tra Trung Uong, 2017
19 2.3 History of VietGAHP for pig production in Vietnam
This part will summarize the history of VietGAHP for pig production in Vietnam in Figure 2.7, which includes the year VietGAHP started, the characteristics of VietGAHP in each period and whose pig producers are applied by it. Also, this subsection will compare the detail the number of VietGAHP practices among their versions in Table 2.8 and Table 2.9
Figure 2.7 Flows of history of VietGAHP for pig production Source: Author summarized from MARD, 2008, 2011, 2015, 2016 2.3.1 Decision No. 1506 (2008)
Firstly, the Vietnam’s MARD has released the general VietGAHP procedure in pig production since 2008 under the Decision No.1506 (MARD, 2008) applied for all units who produces pigs in Vietnam including households, commercial farms, agricultural companies, agricultural cooperation and other individuals and organizations. This VietGAHP includes principles, guidance sequence for these organizations, production units to apply in their productions with purposes: (i) ensure their pig products to meet quality and food safety standards; (ii) ensure a social welfare, health’s pig producers, health’s pork consumers; (iii) protect the environment; and (iv) be product traceability;
This first assessment version includes 54 compulsory criteria (named A criteria) which have to follow if pig producers want to adopt VietGAHP in their pig production and 10
2016. Decision No.2509
Specific VietGAHP procedure in pig production applied for household level (all) included 29 practices
2015. Decision No.4653
The VietGAHPprocedure applied in pig production for all units 2011. Decision No. 1947
Specific VietGAHP procedure applied for household (HH) level (only HHs under Lifsap project-Livestock Competitiveness and Food Safety Project, 2010-2015, 12/63 provinces)
2008. Decision No. 1506
The first VietGAHP procedure in pig production in general (HH, farm level and other units)
20 optional criteria (named B criteria) which are practices encourage to comply (Table 2.8).
However, this version did not guide in detail to be satisfy and verify as an active VietGAHP pig producer that at least how many A and B criteria have to comply in full
Table 2.8 Assessment Checklist of VietGAHP for all pig producer untis No. Criteria group’s name Decision No.
1506 (2008)
Decision No.4653 (2015)
1 Location 3A, 0B 3A
2 Building infrastructure and equipment 9A, 3B Design production area:
3A, 1B
Building infrastructure and equipment: 3A, 0B
3 Breeding stocks and its management 3A, 0B 3A, 1B
4 Veterinary hygiene 9A, 0B 5A, 3B
5 Feeding, drinking water and cleaning water management
8A, 2B 5A, 2B
6 Pig herb management 1A, 1B
7 Selling management 2A
8 Transport 1A, 0B 1A, 1B
9 Disease management 2A, 0B 3A, 1B
10 How to use and storage of veterinary drug
1A, 0B 11 How to prevent and treat diseases 3A, 0B
12 Manure management 4A, 2B 2A,0B
13 Insects control 0A, 1B 0A, 1B
14 Human resources management 4A, 1B 1A, 2B
15 Recording production information, product traceability and product recall
1A, 0B 1A, 0B
16 Internal check 2A, 0B 1A, 1B
17 Complaint and its settlement 1A, 0B 0A, 1B
Total 64 (54A, 10B) 45 (31A, 14B)
At least Not specify 31A and 7 B
Source: Author summarize from MARD, 2008, 2011, 2012, 2015, 2016. Note: A:
Compulsory practices; B: Optional practices
21 2.3.2 Decision No. 1947 (2011)/Decision No. 2970 (2012)
From this decision, a specific VietGAHP applied for household level (only applied for the households under LIFSAP, 2010-2015, 12/63 provinces). LIFSAP aims to “increase the production efficiency of household-based livestock producers, reduce the environment impact of livestock production…” (World Bank, 2015).
Table 2.9 Assessment Checklist of VietGAHP for pig producing-household Group
No.
Criteria group’s name Decision No. 1947 (2011)/Decision No. 2970
(2012)
Decision No.2509 (2016)
1 Location, Building
infrastructure and equipment
3A, 3B 3A, 3B
2 Breeding stocks and its management
2A, 1B 2A, 1B
3 Feeding and its management 1A, 3B 1A, 3B
4 Water and its management 0A, 2B 0A, 2B
5 Veterinary practices and its hygiene 5A, 3B 5A, 3B
6 Selling management 2A, 1B 2A, 1B
7 Manure management 1A, 1B 1A, 1B
8 Recording production
information, product traceability and product recall
1A, 0B 1A, 0B
Internal check (1A if
mutimembers)
Total 29 (15A, 7B) Individual: 29
(15A, 14B) Multimember: 30
(16A, 14B)
At least 15A and 7B Individual: 15A
and 7B) Multimember:
16A and 7B Source: Author summarize from MARD, 2011, 2012, 2016. Note: A: Compulsory practices;
B: Optional practices
22 This version named VietGAHP for household based swine production which are principles, guidance sequence in order to: (i) ensure pig products to meet food safety standards; (ii) ensure a social security, health’s pig producers, health’s pork consumers; (iii) protect the environment; and (iv) be product traceability;
This version is simpler than the version of VietGAHP in 2015, it includes 15 compulsory (named A) and 14 optional criteria (named B criteria) in the checklist of assessment that attached in a Decision No. 2970, 23/Nov/2012 (Table 2.9). A household satisfied 15/15 A criteria and at least 7 B Criteria can become a VietGAHP household.
2.3.3 Decision No.4653 (2015)
The VietGAHP for pig production in Vietnam for all units nameds VietGAHP for for pig production. It aims to (i) ensure pig products to meet food safety standards; (ii) protect the environment; and (iii) protect the health of a community.
The assessment is basically based on the version assessment of Decision No. 1506 in 2008. It divided into 31 forced criteria (named A) and 14 optional criteria (named B criteria) in the checklist of VietGAHP for pig production assessment that attached in this decision (Table 2.8). However, this assessment version is clearly about the number of criteria that pig producers have to fully comply if they want to certify as an active VietGAHP pig producers.
If a farm satisfied 31/31 A criteria and at least 7 B criteria can become a VietGAHP farm.
2.3.4 Decision No.2509 (2016)
The Decision No.2509 is the updated of the specific VietGAHP for household based swine production and it is applied for all households (that is not limited for only households under supported by LIFSAP). This version is basically based on the version of the Decision No.1947 and Decision No. 2970. It includes principles, guidance sequence to: (i) ensure and enhance the quality of pig products to meet food safety standards, the health of pig producers and the health of pork consumers; (ii) protect the environment; and (iii) be the product traceability;
The assessment of this VietGAHP version divided into 15 forced criteria (named A) and 14 optional criteria (named B criteria) in Table 2.9. If HH satisfied 15/15 A criteria and at least 7 B criteria can become a VietGAHP HH. All criteria is divided into 8 groups: Group 1:
Location, pig housing and equipment used in the pig production (3A, 3B); Group 2: Breeds and breeding management (2A, 1B); Group 3: Feeds and feeding management (1A, 3B);
Group 4: Water use (2B); Group 5: Veterinary and veterinary hygiene (5A, 3B); Group 6:
Marketing (2A, 1B); Group 7: Environment (1A, 1B), and Group 8: Recording (1A) (Table
23 2.9). In this version, there is an updated criteria related to the group of producers who want to adopt VietGAHP for multi members in their groups. Beside to comply all 15A and at least 7B, they need to comply one more A criteria related to assess their internal group.
24
CHAPTER III: TECHNICAL EFFICIENCY IN VIETNAMESE HOUSEHOLDS’ PIG PRODUCTION
3.1 Introduction
In Vietnam, pig production is not only one of the main agricultural sectors but also a major source of income and central household activity in rural areas. According to the General Statistics Office of Vietnam (GSO) (GSO, 2013), the value of livestock constitutes 26.8% of the gross agricultural output, a ratio that has been growing overtime. It is predicted that by 2020, livestock production, of which pig production is the greatest component, will constitute over 42% of agricultural output. It is further thought that pig production will come to supply 63% of the country’s total meat production by that same time (Vietnamese Prime Minister, 2008). Pig production is almost entirely conducted by small farmers, who own approximately 80% of all pigs (AGAL, 2005). Epprecht (2005) argues that the pig sector is one of the most important contributors to household income within the livestock sector.
However, household pig production is reliant on the family’s own resources, such as labor, land, and feed produced from agricultural products. In addition, the Vietnamese government’s strategy for the future of the pig sector through 2020 holds that production should be shifted from small-scale and family operations to large, intensive and commercial scale operations (Vietnamese Prime Minister, 2008). Thus, household pig production will face increased threats, though it is still believed that it will continue to dominate Vietnam’s pork industry (Tisdell, 2010). Furthermore, it is also believed that household pig producers have a comparative advantage within the pig industry (Lapar et al., 2012).
Thus, if households want pig production to continue contributing to their income and to continue supplying pork, they must utilize their resources more efficiently. This study focuses on farrow-to-finish household pig producers who account for 55.85% of Vietnam’s pig farmers (Tung, 2009). Farrow-to-finish is a full cycle pig production process that keeps breeding sows and producing piglets that are grown and fattened until they can be sold for their meat (Costales et al., 2006; Lapar et al., 2012). Furthermore, in order to create jobs and income, household farrow-to-finish pig producers increase the scale of their operation and utilize husbandry techniques, such as cross breeding and artificial insemination, in order to improve their performance.
Based on Farrell (1957) seminal article, technical efficiency is defined as “the ability of a farm to use minimum level of inputs given the same output.” Recently, several studies
25 have used DEA approaches to study productive efficiency in pig farming; however, most of these ignored small-scale household operations in developing countries, where pig production is integral to both the agricultural sector and to households. To our knowledge, only Mugera
& Featherstone (2008) investigated technical efficiency and its determinants in backyard pig production, with their focus being limited to the Philippines.
However, they still face numerous challenges, such as limited resources, poor genetic stock, low quality feed and diseases, a lack of political support, and poor husbandry techniques (Lapar et al., 2012). As such, the technical efficiency in farrow-to-finish pig production varies based on both time and the farmer in question. It is necessary to improve the efficiency of pig production in households based on their condition combine with management practices in order to improve their income and the abitlity of pork supply in pig industry in Vietnam. This study aims to (i) estimate the level of technical efficiency (TE) in farrow-to–finish pig production in Vietnamese household and (ii) determine factors effecting on TE in farrow - to – finish pig production as well.
3.2 Data and Methodology 3.2.1 Study site
Figure 3.1 The located of Tien Lu district, Hung Yen province
http://vi.wikipedia.org/wiki/H%C6%B0ng_Y%C3%AAn#mediaviewer/File:
Hungyenmoi.jpg
http://en.wikipedia.org/wiki /H%C6%B0ng_Y%C3%A An_Province
Hung Yen province