O R I G I N A L A R T I C L E
Improving the assessment of adverse drug reactions using the Naranjo Algorithm in daily practice: The Japan Adverse Drug Events Study
Hiroki Murayama | Mio Sakuma | Yuri Takahashi | Takeshi Morimoto
Department of Clinical Epidemiology, Hyogo College of Medicine, Nishinomiya, Japan
Correspondence
Takeshi Morimoto, Department of Clinical Epidemiology, Hyogo College of Medicine, Nishinomiya, Japan.
Email: [email protected]
Funding information
JSPS KAKENHI, Grant/Award Number:
JP17689022, JP21659130, JP22390103, JP23659256, JP26293159; Ministry of Health, Labour and Welfare of Japan; Pfizer Health Research Foundation; Uehara Memorial Foundation
Abstract
It is difficult to determine adverse drug reactions (ADRs) in daily complicated clinical practice in which many kinds of drugs are prescribed. We evaluated how well the Naranjo Algorithm (NA) categorized ADRs among suspected ADRs. The Japan Adverse Drug Events (JADE) study was a prospective cohort study of 3459 inpa- tients. After all suspected ADRs were reported from research assistants, a single physician reviewer independently assigned an NA score to each. After all NA score of suspected ADRs were scored, two physician reviewers discussed and determined ADRs based on the literature. We investigated the sensitivity and specificity of NA and each component to categorize ADRs among suspected ADRs. A total of 1579 suspected ADRs were reported in 962 patients. Physician reviewers determined 997 ADRs. The percentage of ADRs was 94% if the total NA score reached 5. The modified NA consisted of 5 components that showed high classification abilities; its area under the curve (AUC) was 0.92 for categorizing ADRs, the same as the original. When we set the total NA score cut-off value to 5, specificity was 0.95 and sensitivity was 0.59. When we reclassified NA components as binary variables, the specificity increased to 0.98 with a cut-off value of 4 and yielded an AUC of 0.93. In conclusion, we showed that both NA and modified NA could categorize ADRs among suspected ADRs with a high likelihood in daily clinical practice.
K E Y W O R D S
adverse drug reactions, categorization, daily practice, JADE study, modification, Naranjo Algorithm, patient safety, pharmacovigilance, sensitivity, specificity
1 | I N T R O D U C T I O N
Discriminating adverse drug events (ADRs) from various symptoms in daily practice is important in order for physicians to take action to mitigate the adverseness and prevent recurrence. However, patients are usually treated with many kinds of drugs, which make it difficult to identify an ADR in daily practice. A tool to categorize ADRs
Abbreviations: ADRs, adverse drug reactions; AUC, area under the curve; JADE, The Japan Adverse Drug Events; NA, Naranjo Algorithm; ROC, receiver operating characteristic.
A statement about prior postings and presentations: This work has not been previously pub- lished in another journal. It has been presented as a poster at the 33rd International Scien- tific Meeting on Quality and Safety in Health Care in Tokyo, Japan, 16th-19th October 2016.
- - - - This is an open access article under the terms of the Creative Commons Attribution License, which permits use, distribution and reproduction in any medium, provided the original work is properly cited.
©2018 The Authors.Pharmacology Research & Perspectivespublished by John Wiley & Sons Ltd, British Pharmacological Society and American Society for Pharmacology and Experimental Therapeutics.
Received: 9 October 2017
|
Accepted: 19 October 2017 DOI: 10.1002/prp2.373Pharmacol Res Perspect.2018;e00373. wileyonlinelibrary.com/journal/prp2 | 1 of 7
among complicated suspected symptoms could be useful for health- care professionals to take action proactively as well as to confirm the probability of ADRs retrospectively.
Naranjo et al proposed a tool to evaluate the probability of true ADRs from suspected ADRs,1,2 and it has been widely used as the Naranjo Algorithm (NA).3-6In addition to the NA, several assessment tools have been developed, such as the Liverpool adverse drug reac- tion causality assessment tool7and the French Causality Assessment Method.8 These tools are used to evaluate the probability of an ADR rather than to screen ADRs from suspected ADRs prospectively to take action. While the NA is a traditional tool, it consists of 10 components, and it is complicated to calculate the total score and would require time to utilize it in a daily clinical setting. To save time and resources, a convenient tool to categorize ADRs with high speci- ficity is needed.
We recently conducted the Japan Adverse Drug Events (JADE) study, which evaluated the incidence of ADRs and medication errors among Japanese hospitalized inpatients.9-14In the present study, we evaluated the usefulness of the NA to categorize ADRs among sus- pected ADRs using the JADE database and tried to modify it into a convenient tool to use in daily clinical practice.
2 | M A T E R I A L S A N D M E T H O D S 2.1 | Study design and patient population
The JADE study was a multicenter prospective cohort study that included 3459 inpatients aged≥15 years. The study site was three urban tertiary care hospitals in Japan, patients admitted at 15 ran- domly selected medical and surgical wards as well as three intensive care units from January through June 2004 were eligible for this study.9 The institutional review boards of the three participating hospitals approved the study. Informed consent was waived because all data were collected in daily practice.
2.2 | Naranjo Algorithm
The NA consists of 10 components assessing the likelihood of ADRs.1,2 Each component is scored from 1 to+2 based on the findings of each event, including (1) previous conclusive reports, (2) time course, (3) improvement after withdrawal or treatment, (4) re-emergence after re- challenge, (5) other causative conditions of symptoms, (6) response to placebo if used, (7) evidence in blood of toxicity, (8) dose response, (9) similar reactions before, and (10) other objective evidence.
2.3 | Data collection and review process
Research assistants, who were trained nurses or nursing students, reviewed all medical charts, along with laboratory results, incident reports, and prescription queries by pharmacists with the standard- ized form daily. They reported any suspected ADRs that might be potential ADRs in a standard manner.15 After all suspected ADRs were reported from research assistants, a single physician reviewer
independently assigned an NA score to each suspected ADR. After all NA score of suspected ADRs were scored, two independent physician reviewers evaluated all suspected ADRs and classified them as confirmed ADRs or not. If discordance happened, such dis- cordance was resolved through discussion to reach consensus.
2.4 | Statistical analyses
A continuous variable is presented as the meanstandard deviation (SD) and categorical variables are shown as numbers and percent- ages. We expressed the distribution of NA scores in each compo- nent as the percentage of confirmed ADRs among suspected ADRs for each score in each component. We evaluated the percentage of confirmed ADRs among suspected ADRs for each total NA score.
ADRs which are confirmed by physician reviewers are considered as true positive. All suspected ADRs were categorized as positive or negative based on the NA score; then sensitivity and specificity were calculated by these figures. We constructed a receiver operating characteristic (ROC) curve for the summed score of all and selected NA components to compare the categorization abilities of original and modified NA scores. To simplify the NA for convenient use, we reclassified NA components as binary variables. For example, an NA component that had three possible scores, such as+2, 0, and 1 or +1, 0, and 1, were converted to+1 and 0 in which the positive score was converted to+1 and the 0 and negative scores were summa- rized as 0. We carried out all analyses using JMP 11.2 (SAS Institute Inc., Cary, NC, USA) software.
3 | R E S U L T S
There were 1579 suspected ADRs occurring in 962 patients from among 3459 patients enrolled (Figure 1). Physician reviewers finally concluded that 997 actual ADRs occurred from among the suspected ADRs. Among the 962 patients with NA scores, 517 (54%) were men and the mean age was 70 (SD 15) years. The medical and surgi- cal wards and the ICUs admitted 437 (45%), 410 (43%), and 115 (12%) patients, respectively. Comorbidities based on the Charlson index are summarized in Table 1. Medications that were the most frequently associated with ADRs were electrolytes or fluids (n=623, 62%), followed by antibiotics (n=569, 57%) and peptic ulcer drugs (n=463, 46%) (Table 2).
3.1 | Distribution of NA score and percentage of ADRs by each component
NA components 6 through 10 (response to placebo if used, evidence in blood of toxicity, dose response, similar reactions before, and other objective evidence) classified more than 95% of suspected ADRs with a specific score; in which 99.8% (n=1576) of suspected ADRs were classified with a score 0 (do not know) for component 6, and 99.9% of suspected ADRs were classified with a score 0 (no or do not know) for component 7. Thus, components 6 through 10 did
2 of 7
|
MURAYAMAET AL.not show sufficient categorization in identifying ADRs in this cohort.
On the other hand, components 1 through 5 (previous conclusive report, time course, improvement after withdrawal or treatment, re-
emergence after re-challenge, and other causative conditions of symptoms) showed good categorization in identifying ADRs from among suspected ADRs for each component; in which 64%
(n=1002) of suspected ADRs were classified with a+1 score (yes) and 37% (n=577) of suspected ADRs were classified with a 0 score (no or do not know) for component 1 (Table 3).
Each NA component 1 to 5 had relatively high sensitivity or specificity for categorizing ADRs among suspected ADRs. With component 1, 86% (n=866) of suspected ADRs were confirmed as ADRs among 1002 suspected ADRs assigned a+1 score (Yes), and 23% (n=131) of suspected ADRs were confirmed as ADRs among 577 suspected ADRs assigned a 0 score (No/Do not know) (Figure 2). Since the NA has a “Do not know” classification, we simply could not calculate specificity. When we classified “do not know” as “no”, the sensitivity was 0.87 and specificity was 0.77 for component 1. Similarly, the approximate sensitivity and specificity were 0.99 and 0.68, respectively, for component 2; 0.31 and 0.97, respectively, for component 3; 0.27 and 0.93, respec- tively, for component 4; and 0.71 and 0.91, respectively, for com- ponent 5.
3.2 | Relationship between total NA score and ADRs percentage of suspected ADRs
The total NA score calculated for each suspected ADR ranged from 2 to 11. The most frequent total NA score was 0 (n=403) followed by 5 (n=280). The percentage of ADRs was 56% if the total NA score was 1, and it gradually increased to 94% if the total NA score reached 5 (Figure 3). We did not show the total NA scores of 2 and 1 since only 2 and 0 suspected ADRs, respectively, were assigned these scores.
Enrolled paents ( n = 3459)
Suspected ADRs screened by research assistants and physician reviewers evaluated Naranjo score
for all of them
(1579 suspected ADRs from 962 paents)
ADRs confirmed by physician reviewers independently
(997 ADRs from 962 paents)
F I G U R E 1 Evaluation process for adverse drug events (ADRs).
ADRs were evaluated using 3 steps. Research assistants suggested suspected ADRs from potential drug-related incidents. A physician reviewer scored each suspected ADR independently using the NA.
Two physician reviewers identified ADRs based on consensus of an expert panel
T A B L E 1 Characteristics and demographics of patients on admission Characteristic
MeanSD or n (%) n=962
Age (years) 70.014.8
Male sex 517 (54)
Race (Japanese) 957 (99.5)
Admitting ward
Medical 437 (45)
Surgical 410 (43)
Intensive care units 115 (12)
Comorbidity
Myocardial infarction 67 (7)
Heart failure 141 (15)
Peripheral vascular disease 54 (6)
Cerebrovascular disease 136 (14)
Dementia 143 (15)
Chronic obstructive pulmonary disease 122 (13)
Rheumatologic 38 (4)
Peptic ulcer 247 (26)
Liver diseases 177 (18.4)
Diabetes 163 (16.9)
Chronic kidney disease 61 (6)
Any tumor 377 (39.2)
Most parameters are duplicated to a certain degree, as many patients experienced multiple medical events.
T A B L E 2 Medications suspected to induce adverse drug reactions (ADRs)
Medication
n (%) n=997
Electrolytes or fluids 623 (62)
Antibiotics 569 (57)
Peptic ulcer drugs 463 (46)
Sedatives 360 (36)
Antihypertensive 302 (30)
Laxatives 254 (25)
Diuretics 221 (22)
Cardiovascular 202 (20)
NSAIDs 194 (19)
Anticoagulants 170 (17)
Antidiabetics 139 (14)
Antipsychotics 119 (12)
Dyslipidemic agents 73 (7)
Analgesics 42 (4)
NSAIDs, nonsteroidal anti-inflammatory drugs.
MURAYAMAET AL.
|
3 of 73.3 | Sensitivity and specificity of the NA to determine ADRs
The area under the curve (AUC) to confirm ADRs was 0.92 (95%
confidence interval [CI]: 0.91-0.94) based on the total NA sore; the
specificity was 0.94 and the sensitivity was 0.61 if the cut-off value was set at 5 (Figure 4A). Since more than 97% of suspected ADRs were assigned a score of 0 for components 6 through 10, we con- sidered that these components were not useful in the real-world set- ting. We generated a modified NA that consisted of components 1 T A B L E 3 Distribution of the Naranjo Algorithm (NA) score for each component
Component
Score
+2 +1 0 –1
1 Are there previous conclusive reports on this reaction? — 1002 (64) 577 (37) —
2 Did the adverse event appear after the suspected drug was administered? 1172 (74) — 400 (25) 7 (0.4) 3 Did the adverse reaction improve when the drug was discontinued or a specific
antagonist was administered?
— 322 (20) 1257 (80) —
4 Did the adverse reaction reappear when the drug was readministered? 309 (20) — 1040 (66) 230 (15) 5 Are there alternative causes (other than the drug) that could on their own
have caused the reaction?
761 (48) — 422 (27) 396 (25)
6 Did the reaction reappear when a placebo was given? — 3 (0.2) 1576 (99.8) 0 (0)
7 Was the drug detected in the blood (or other fluids) in concentrations known to be toxic? — 2 (0.1) 1577 (99.9) — 8 Was the reaction more severe when the dose was increased or less severe
when the dose was decreased?
— 24 (2) 1555 (98) —
9 Did the patient have a similar reaction on the same or similar drugs in any previous exposure? — 35 (2) 1544 (98) —
10 Was the adverse event confirmed by any objective evidence? — 53 (3) 1526 (97) —
Data expressed as n (%).
10. Other objecve evidence
5. Other causave ADR No ADR condions of symptoms 4. Re-emergence
aer re-challenge 3. Improvement
aer withdrawal or treatment 2. Time course
1. Previous conclusive reports
9. Similar reacons before
8. Dose response 7. Evidence in
blood of toxicity 6. Response to
placebo if used
F I G U R E 2 Distribution of adverse drug reactions (ADRs) by each Naranjo Algorithm (NA) component. The distribution of ADRs identified by physician reviewers for scored suspected ADRs by each NA component is shown. A total of 10 components, each consisting of 2 or 3 classifications were evaluated
4 of 7
|
MURAYAMAET AL.through 5. This modified NA confirmed ADRs with an AUC of 0.92 (95% CI: 0.91-0.94), which was the same AUC as the original NA (Figure 4B). If the cut-off value was set at 5, the specificity was 0.95 and sensitivity was 0.59. In the modified NA, we reclassified NA components 2, 4, and 5 into binary variables, which increased the specificity to 0.98 and sensitivity of 0.34 with an AUC of 0.93
(95% CI: 0.91-0.94) if the cut-off value was set at 4 (Figure 4C).
We further modified the NA to consist of components 2 through 5 as binary variables. This simplest NA confirmed ADRs with an AUC of 0.92 (95% CI: 0.90-0.93) and showed a specificity of 0.97 and sensitivity of 0.40 if the cut-off value was set at 3 (Table 4, Fig- ure 4D).
Total NA score
0 10 20 30 40 50 60 70 80 90 100
0 1 2 3 4 5 6 7 8 9 10 11
Fr equency of ADRs (%)
403 102 149 62 220 280 168 130 51 7 3 1 Number of
suspected ADRs
F I G U R E 3 Relationship between the total Naranjo Algorithm (NA) score and the percentage of identified adverse drug events (ADRs) among suspected ADRs.
The percentage of confirmed ADRs among suspected ADRs are expressed for each total NA score (0 through 11)
(B)
0.00 0.20 0.40 0.60 0.80 1.00
0.00 0.20 0.40 0.60 0.80 1.00
AUC = 0.92 (95% CI: 0.91–0.94)
1-specificity
1-specificity 1-specificity
0.00 0.20 0.40 0.60 0.80 1.00
0.00 0.20 0.40 0.60 0.80 1.00
y
(A)
AUC = 0.92 (95% CI: 0.91–0.94)
0.00 0.20 0.40 0.60 0.80 1.00
0.00 0.20 0.40 0.60 0.80 1.00
(C)
AUC = 0.93 (95% CI: 0.91–0.94)
Sensi Ɵ vity Sensi Ɵ vity
1-specificity
0.00 0.20 0.40 0.60 0.80 1.00
0.00 0.20 0.40 0.60 0.80 1.00
AUC = 0.92 (95% CI: 0.90–0.93) (D)
F I G U R E 4 Receiver operating characteristic curve for adverse drug events (ADRs) and total Naranjo Algorithm (NA) score. A, The AUC for the sum of all NA components. B, The AUC for selected NA components (1-5). C, The AUC for selected NA components (1-5) converted to binary scores (0 or 1). D, The AUC for selected NA components (2-5) converted to binary scores (0 or 1)
MURAYAMAET AL.
|
5 of 74 | D I S C U S S I O N
We showed that the NA was able to categorize ADRs among sus- pected ADRs efficiently in daily clinical practice using the large-scale JADE database,9which was independent with a consensus panel by physicians’ reviewers. While each NA component showed relatively high sensitivity or specificity, we evaluated the sensitivity or speci- ficity for the total NA score, since healthcare professionals usually make a decision from multiple factors in the actual clinical setting.
We also showed that the modified NA, consisting of components 1 through 5, also effectively categorized ADRs with a high likelihood.
We further modified the NA to include all binary scores for compo- nents 1 through 5 and found that this algorithm determined ADRs with high likelihood, also similar to the original. In addition, we removed component 1 because this component required sufficient knowledge of ADRs for each suspected drug. We considered that the modified NA with binary scores for components 2 through 5 was the most reasonable in terms of the practical use in daily clinical practice and its effectiveness in determining ADRs with a high likeli- hood, similar to the original index and all of the other modified NAs.
In previous studies, the NA was utilized retrospectively to evalu- ate the probabilities of ADRs in a specific case or cohort.3-6In this study, however, we showed that the NA had high predictive accu- racy for determining true ADRs among suspected ADRs, which could contribute to safety monitoring activities by healthcare professionals or pharmaceutical manufacturers. If the modified NA score is simul- taneously reported with a suspected ADR, a health authority or pharmaceutical manufacturers could evaluate the suspected ADR more easily and quickly and could allocate time and resources more effectively. For example, pharmaceutical manufacturers could start an intensive survey giving priority to a suspected ADR with a high modified NA score. Additionally, healthcare professionals could start preclinical studies to clarify the mechanism of ADRs focusing on a high modified NA score. Thus, the modified NA score could help healthcare professionals or pharmaceutical manufacturers take their own action in preventing ADRs as early as possible before health authorities issue a warning or guidance.
NA was reported to show poor performance for causality assessment of hepatic adverse reactions.16,17 On the other hand, NA and modified NA were able to categorize ADRs among sus- pected ADRs including hepatic adverse reactions in the current study. However, the number of hepatic adverse reactions was lim- ited in the current study, the reliability to assess such hepatic adverse reactions was uncertain. Further studies which address the accuracy of NA and modified NA against hepatic adverse reaction should be considered.
Other than the NA, Gallagher et al reported the usefulness of the Liverpool adverse drug reaction causality assessment tool.7 Although this tool also tried to simplify the NA and increase its cred- ibility, their study had different objectives. It takes time to evaluate one case and provide an outcome (possible, probable, or definite) using the probability tree in the Liverpool tool. Additionally, this tool does not provide any score to be evaluated for sensitivity and speci- ficity, similar to the NA. Also WHO-UMC causality assessment could be another simple tool to categorize ADR.18 While this tool takes number of assessment criteria into consideration to categorize ADRs and each assessment criteria are similar to NA, it does not provide any score to be evaluated for sensitivity and specificity as well. Thus, there have been few reports proposing a tool that could be used to take action to mitigate adverseness and to prevent recurrence proactively rather than merely confirming the probability of ADRs retrospectively. We think our modified NA will not jeopardize the spontaneous ADR reporting but increase the awareness of ADR reporting with simple tool. It is still challenge for medical profession- als to report suspected ADRs spontaneously because the importance of ADR reporting could not be understood well and medical profes- sionals do not have an effective trigger tool to report ADRs. We are convinced that simple ADR assessment tools including our modified NA can introduce more frequent ADR reporting among medical pro- fessionals and can be used as a trigger tool to report ADRs.
Our study has several limitations. First, the JADE study only enrolled inpatients. Therefore, the modified NA score in this study might not be applicable in outpatients. Pharmacovigilance for inpa- tient should be different from usual pharmacovigilance situation of spontaneous reporting. Further studies are needed to clarify whether our findings could be applicable in outpatient settings and to gener- alize the modified NA for use in a pharmacovigilance system. Sec- ond, we removed components 6-10 in the modified NA model. For drugs in which the blood level should be known, such as vancomycin or theophylline, component 7 could be useful for detecting ADRs.
However, only 2 cases were given a score of+1 for that component in this study, which shows that measuring blood levels of suspected drugs is not frequent in daily clinical practice. Third, the same inde- pendent physician reviewer classified the ADR and scored NA at dif- ferent times, which might have led to a connection between ADR classification and NA scoring and subsequently to misclassification of the NA based on the reviewer’s background or knowledge. Fourth, the JADE study only enrolled Japanese patients. To generalize the results globally, we need to study the modified NA in other coun- tries to evaluate its ability to categorize ADRs among various races T A B L E 4 Modified Naranjo Algorithm (NA)
Component
Score
Yes No/Do not know 2 Did the adverse event appear after the
suspected drug was administered?
+1 0
3 Did the adverse reaction improve when the drug was discontinued or a specific antagonist was administered?
+1 0
4 Did the adverse reaction reappear when the drug was readministered?
+1 0
5 Are there alternative causes (other than the drug) that could on their own have caused the reaction?
0 +1
6 of 7
|
MURAYAMAET AL.and in different healthcare systems, which affect decision-making by healthcare professionals. Fifth, the JADE study was conducted in 2004 and the data used seemed relatively old. However, NA was developed in 1981 and still used for clinical settings. The drug used in this study and spontaneous ADR reporting system has not been changed for decades. Thus, the findings and clinical implication of this study should be valid at present time. Finally, we focused on the most suspected drug among all drugs administered when symptoms occurred in this study. Therefore, we could not exclude the possibil- ity of synergistic effects of multiple drugs and drug-drug interaction.
In conclusion, we assessed the categorization abilities of the orig- inal and modified NAs in daily practice and found that the modified NA could be easily used to categorize actual ADRs among suspected ADRs with high predictive accuracy. Therefore, use of the modified NA could help to save time and resources and categorize ADRs more effectively and promptly in daily clinical practice. Additionally, utilizing this tool for a pharmacovigilance system could be useful to enable professionals take prompt action in developing a strategy to prevent and mitigate the adverseness of ADRs.
A C K N O W L E D G E M E N T
The JADE study for adult inpatients was conducted by the following investigators: Kunihiko Matsui, MD, MPH, Nobuo Kuramoto, MD, Jini- chi Toshiro, MD, Junji Murakami, MD, Tsuguya Fukui, MD, MPH, Mayuko Saito, MD, MPH, Atsushi Hiraide, MD, and David W. Bates, MD, MSc. We are also indebted to Ms. Makiko Ohtorii, Ms. Ai Mizu- tani, Ms. Mika Sakai, Ms. Izumi Miki, Ms. Kimiko Sakamoto, Ms. Eri Miyake, Ms. Takako Yamaguchi, Ms. Yoko Oe, Ms. Kyoko Sakaguchi, Ms. Kumiko Matsunaga, Ms. Yoko Ishida, Ms. Kiyoko Hongo, Ms.
Masae Otani, Ms. Yasuko Ito, Ms. Ayumi Samejima, and Ms. Shinobu Tanaka for their data collection and management. This work was sup- ported by JSPS KAKENHI Grant Numbers JP17689022, JP21659130, JP22390103, JP23659256, JP26293159, and Grants from the Min- istry of Health, Labour and Welfare of Japan, Grants from the Pfizer Health Research Foundation and the Uehara Memorial Foundation.
D I S C L O S U R E S
H. Murayama and Y. Takahashi: Employees of Novartis Pharma KK;
M. Sakuma and T. Morimoto: None Declared.
O R C I D
Takeshi Morimoto http://orcid.org/0000-0002-6844-739X
R E F E R E N C E S
1. Naranjo CA, Busto U, Sellers EM, et al. A method for estimating the probability of adverse drug reactions. Clin Pharmacol Ther.
1981;30:239-245.
2. Busto U, Naranjo CA, Sellers EM. Comparison of two recently pub- lished algorithms for assessing the probability of adverse drug reac- tions.Br J Clin Pharmacol. 1982;139:223-227.
3. Davies EC, Green CF, Taylor S, et al. Adverse drug reactions in hospi- tal in-patients: a prospective analysis of 3695 patient-episodes.PLoS ONE. 2009;4:e4439. https://doi.org/10.1371/journal.pone.0004439.
4. Pirmohamed M, James S, Meakin S, et al. Adverse drug reactions as cause of admission to hospital: prospective analysis of 18,820 patients.Br Med J. 2004;329:15-19.
5. Khan A, Adil MS, Nematullah K, et al. Causality assessment of adverse drug reaction in Pulmonology Department of a Tertiary Care Hospital.J Basic Clin Pharm. 2015;6:84-88.
6. Ide K, Yamada H, Kitagawa M, et al. Methods for estimating causal relationships of adverse events with dietary supplements.BMJ Open.
2015;5:e009038. https://doi.org/10.1136/bmjopen-2015-009038.
7. Gallagher RM, Kirkham JJ, Mason JR, et al. Development and inter- rater reliability of the Liverpool adverse drug reaction causality assessment tool. PLoS ONE. 2011;6:e28096. https://doi.org/10.
1371/journal.pone.0028096.
8. Theophile H, Dutertre JP, Gerardin M, et al. Validation and repro- ducibility of the updated French Causality Assessment Method: an evaluation by pharmacovigilance centres & pharmaceutical compa- nies.Therapie. 2015;70:465-476.
9. Morimoto T, Sakuma M, Matsui K, et al. Incidence of adverse drug events and medication errors in Japan: the JADE study.J Gen Intern Med. 2011;26:148-153.
10. Sakuma M, Ida H, Nakamura T, et al. Adverse drug events and medi- cation errors in Japanese paediatric inpatients: a retrospective cohort study.BMJ Qual Saf. 2014;23:830-837.
11. Sakuma M, Morimoto T, Matsui K, et al. Epidemiology of potentially inappropriate medication use in elderly patients in Japanese acute care hospitals.Pharmacoepidemiol Drug Saf. 2011;20:386-392.
12. Sakuma M, Bates DW, Morimoto T. Clinical prediction rule to iden- tify high-risk inpatients for adverse drug events: the JADE Study.
Pharmacoepidemiol Drug Saf. 2012;21:1221-1226.
13. Ohta Y, Sakuma M, Koike K, et al. Influence of adverse drug events on morbidity and mortality in intensive care units: the JADE study.
Int J Qual Health Care. 2014;26:573-578.
14. Sakuma M, Kanemoto Y, Furuse A, et al. Frequency and severity of adverse drug events by medication classes: the JADE Study. J Patient Saf2015 [Epub ahead of print].
15. Morimoto T, Gandhi TK, Seger AC, et al. Adverse drug events and medication errors: detection and classification methods. Qual Saf Health Care. 2004;13:306-314.
16. Carrascosa MF, Lucena MI, Andrade RJ, et al. Fatal acute hepatitis after sequential treatment with levofloxacin, doxycycline, and naproxen in a patient presenting with acute Mycoplasma pneumo- niae infection.Clin Ther. 2009;31:1014-1019.
17. Lavonas EJ, Reynolds KM, Dart RC. Therapeutic acetaminophen is not associated with liver injury in children: a systematic review.Pedi- atrics. 2010;126:e1430-e1444.
18. The Uppsala Monitoring Centre. The use of the WHO-UMC system for standardized case causality assessment. https://www.who-umc.
org/media/2768/standardised-case-causality-assessment.pdf, July 3rd 2017 accessed.
How to cite this article:Murayama H, Sakuma M, Takahashi Y, Morimoto T. Improving the assessment of adverse drug reactions using the Naranjo Algorithm in daily practice: The Japan Adverse Drug Events Study.Pharmacol Res Perspect.
2018;e00373.https://doi.org/10.1002/prp2.373
MURAYAMAET AL.
|
7 of 7R E S E A R C H Open Access
Effect of norepinephrine dosage on mortality in patients with septic shock
Hitoshi Yamamura
1*, Yu Kawazoe
2, Kyohei Miyamoto
3, Tomonori Yamamoto
4, Yoshinori Ohta
5and Takeshi Morimoto
6Abstract
Background: Use of high-dose norepinephrine is thought to have an immunosuppressive action that increases mortality. This study aimed to evaluate the correlation between norepinephrine dosage and prognosis of patients with septic shock.
Methods: This study was a nested cohort of the DExmedetomidine for Sepsis in Intensive Care Unit Randomized Evaluation (DESIRE) trial. We evaluated 112 patients with septic shock and an initial Sequential Organ Failure Assessment Cardiovascular (SOFA-C) category score > 2 and initial lactate level > 2 mmol/L. We divided the patients into two groups according to the norepinephrine dosage administered over the initial 7 days: high dose ( ≥ 416 μ g/kg/week) (H group, n = 56) and low dose (< 416 μ g/kg/week) (L group, n = 56). The primary outcome of interest was 28-day mortality. Secondary outcomes were ventilator-free days, initial 24-h infusion volume, initial 24- to 48-h infusion volume, and the need for renal replacement therapy. For comparisons between the H group and L group, we used the chi-square test or Fisher ’ s exact test for categorical variables and the t test or Wilcoxon rank sum test for continuous variables. For time-to-event outcomes, Cox proportional hazards models were used. Kaplan-Meier survival curves were created for graphical representation.
Results: Patient characteristics appeared to be similar between the two groups except for the SOFA-C score and fibrinogen degradation product level. The cumulative incidence of death at 28 days was 29.9% (16 patients) in the L group and 29.7%
(15 patients) in the H group ( p = 0.99). The median number of 28-day ventilator-free days was 20 (0, 25) in the L group and 16 (0, 22) in the H group ( p < 0.05). Initial infusion volume at 0 – 24 h in the H group was significantly higher than that in the L group ( p = 0.004). Infusion volume at 24 – 48 h in the H group was also significantly higher than that in the L group ( p = 0.03).
Conclusions: No statistically significant difference was observed in 28-day mortality between patients with septic shock treated with high-dose norepinephrine compared with those treated with low-dose norepinephrine. However, the number of ventilator-free days in the L group was higher than that in the H group.
Trial registration: clinicaltrials.gov Identifier: NCT01760967 Date of trial registration: January 4, 2013.
Keywords: Norepinephrine, Septic shock, Ventilator-free days
* Correspondence:[email protected]
1Department of Disaster and Critical Care Medicine, Hirosaki University School of Medicine, 5 Zaifuchou, Hirosaki, Aomori 036-8562, Japan Full list of author information is available at the end of the article
© The Author(s). 2018Open AccessThis article is distributed under the terms of the Creative Commons Attribution 4.0 International License (http://creativecommons.org/licenses/by/4.0/), which permits unrestricted use, distribution, and reproduction in any medium, provided you give appropriate credit to the original author(s) and the source, provide a link to the Creative Commons license, and indicate if changes were made. The Creative Commons Public Domain Dedication waiver (http://creativecommons.org/publicdomain/zero/1.0/) applies to the data made available in this article, unless otherwise stated.
Yamamuraet al. Journal of Intensive Care (2018) 6:12 https://doi.org/10.1186/s40560-018-0280-1
Background
Norepinephrine is the vasopressor of first choice for patients with septic shock [1]. Norepinephrine recruits unstressed volume through alpha adrenergic effects on venous and arterial vessels and might recruit volume to the macrovasculature. However, norepinephrine is also thought to have an immunosuppressive action that causes a poor prognosis [2, 3]. Previous reports showed that norepinephrine dosage was associated with inten- sive care unit (ICU) mortality, with an especially high mortality rate at doses above 1 μg/kg per min [2]. From this previous study, the high-dose usage of norepineph- rine was thought to cause high mortality in patients with sepsis. As another problem, in the treatment strategy of septic shock, it is important to include early recognition, fluid resuscitation, and maintenance of the blood pres- sure. However, if massive fluid resuscitation is required, this can cause pulmonary edema and prolonged the number of ventilator days. In this study, we aimed to evaluate the correlation between norepinephrine dosage and prognosis and the number of ventilator-free days (VFD) of patients with septic shock.
Methods
Patient selectionThe DExmedetomidine for Sepsis in Intensive Care Unit Randomized Evaluation (DESIRE) trial was conducted from February 2013 to January 2016 [4]. This trial was a multicenter, randomized, controlled trial that enrolled 201 adult patients with sepsis undergoing ventilation. It was designed to assess the effects of a sedation strategy with dexmedetomidine compared with that without dexmedetomidine. The results of this trial in the 201 patients showed that treatment with dexmedetomidine vs that without dexmedetomidine did not significantly reduce the number of VFD (20 vs 18 days) or 28-day
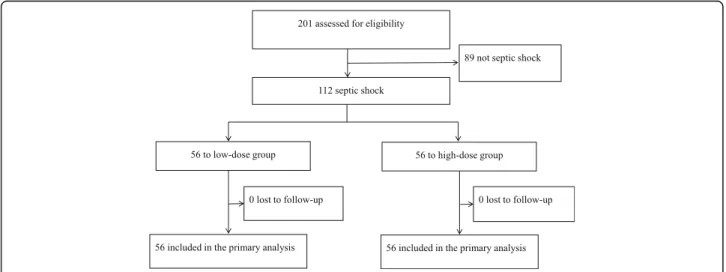
mortality (23 vs 31%, hazard ratio 0.69). This sub- analysis of the 201 randomized patients included those with septic shock. Septic shock was defined as a Sequen- tial Organ Failure Assessment (SOFA) score > 2 for the cardiovascular category and a lactate level > 2 mmol/L at randomization. We enrolled 112 patients and divided the patients into two groups according to the total dos- age of norepinephrine administered over the initial 7 days: low dose (< 416 μg/kg/week) (L group, n = 56) and high dose (≥ 416 μg/kg/week) (H group, n = 56) (Fig. 1).
Treatment protocol
The treatment protocol for sepsis was based on the Guidelines for the Management of Sepsis [1]. In the resuscitation from septic shock-induced hypoperfu- sion, we initially administered an adequate amount of crystalloid on admission to maintain a mean arterial pressure of 65 mmHg, central venous pressure of 8–12 mmHg, and urinary output of > 0.5 mL/kg/h.
Following fluid resuscitation, if the blood pressure could not be maintained, we used norepinephrine or vasopressin as the vasopressor.
Measurements
We collected data on the initial serum lactate level, SOFA score, and Acute Physiology and Chronic Health Evaluation II (APACHE II) score at randomization. White blood cell (WBC) count, levels of fibrinogen, D-dimer, fibrinogen degradation products (FDP), C-reactive protein (CRP), and procalcitonin (PCT) and norepinephrine dosage were assessed. Infusion volume was assessed on the first and second days, and the dosages of other vasopressors were assessed on the first 7 days after randomization.
The primary outcome of interest was 28-day mortality.
For other outcomes, patients were followed in the hospital
Fig. 1Flow of participants in the norepinephrine dosage for septic shock study
Yamamuraet al. Journal of Intensive Care (2018) 6:12 Page 2 of 7
from enrollment for 28 days or until discharge or death if earlier. Secondary outcomes included the number of VFD, defined as the number of days without use of a ventilator during the 28-day study period, initial 24-h infusion volume, initial 24- to 48-h infusion volume, and the need for renal replacement therapy including continuous renal replacement therapy and hemodialysis.
Statistical analysis
Continuous variables are presented as the mean ± stand- ard deviation (SD) or the median and interquartile range (IQR). Categorical variables are presented as numbers and percentages (%). For comparisons between the H group and L group, we used the chi-square test or Fish- er’s exact test for categorical variables and the t test or Wilcoxon rank sum test for continuous variables.
For time-to-event outcomes (time to ICU discharged death), Cox proportional hazards models were used.
Kaplan-Meier survival curves were created for graphical representation of these time-to-event outcomes. When examining 28-day mortality, patients were censored at the time of last contact while alive or at 28 days from enrollment, whichever came first. Censoring for hospital discharge analyses occurred at the time of death or, rarely, at study withdrawal. To account for any effect of site and for baseline imbalances, a Cox proportional hazards regression model was used with patients nested within site, and site treated as a random effect with the following covariates included in the model: APACHE II score > 23, age > 65, emergency operation, infection site is lung, and treated with dexmedetomidine. A two-sided p value of < 0.05 was considered statistically significant, and all analyses were performed using JMP Pro software (version 12.2; SAS Institute Inc., Cary, NC, USA).
Results
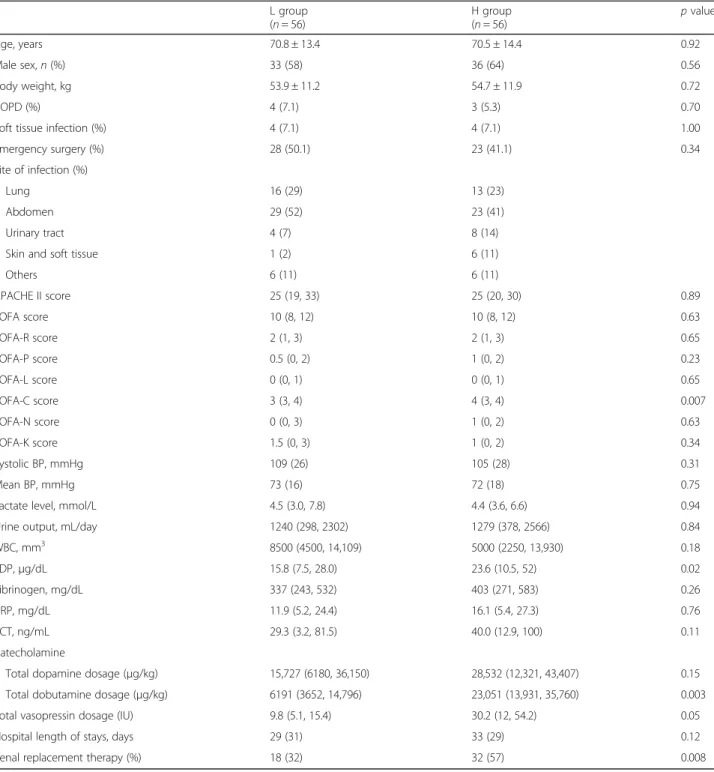
Patient characteristics appeared to be similar between the two groups except for the Sequential Organ Failure Assessment Cardiovascular (SOFA-C) score and FDP level (Table 1). In the H group, use of another vasopres- sor, such as dobutamine, and total vasopressin dosage within 7 days were significantly higher than those in the L group. Causes of sepsis were lung (n = 29), abdomen (n = 52), and others (n = 31).
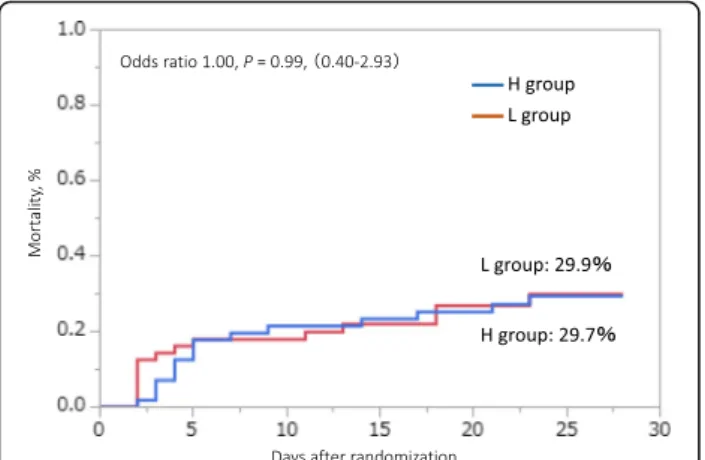
As the primary outcome, the cumulative incidence of death at 28 days was not significantly different between the two groups: 29.9% (16 patients) in the L group and 29.7% (15 patients) in the H group (p = 0.99) (Fig. 2).
The analysis adjusted for infusion volume over the first 24 h also did not show a significant difference (p = 0.38).
The median 28-day VFD in the L group was significantly higher than that in the H group (20 [0, 25] vs 16 [0, 20]
days: p < 0.05) (Fig. 3). Using the Cox proportional hazards model to adjust for all five of the covariates,
VFD was incorporated into the model, with similar results compared with the primary analysis. The dose of norepinephrine used was significantly different between the two groups on each of the first 7 days. Especially, the highest dose of norepinephrine administered was in the H group on day 2 at 345.1 (170.9) μg/kg (Fig. 4).
Initial infusion volume at 0–24 h in the H group was significantly higher than that in the L group (7829 [5689, 10,676] vs 5544 [3985, 8000] mL, p = 0.004). Infusion volume at 24–48 h in the H group was also significantly higher than that in the L group (3530 [2382, 4612] vs 2689 [1962, 3916] mL, p = 0.03). Within the first 3 days after admission, 7 patients died in the H group and 9 patients died in the L group. The cumulative incidences of death at 28 days except for the patients with death within 3 days were not significantly different between the two groups: 32.8% in the L group and 28.4% in the H group (p = 0.39). Renal replacement therapy was per- formed in 32 patients in the H group and in 18 patients in the L group.
Discussion
Septic shock is defined as a subset of sepsis in which underlying abnormalities of circulatory and cellular metabolism are profound enough to substantially in- crease mortality [5]. Norepinephrine is the vasoactive agent of first choice for patients with septic shock after adequate volume resuscitation [1]. Our results showed that the dosage of norepinephrine did not affect the mortality of patients with septic shock, but the number of VFD was lower in the H group. The reason for the difference in the number of VFD between the two groups was that the infusion volume in the H group was significantly higher than that in the L group. Massive infusion volumes can bring about pulmonary dysfunc- tion and cardiovascular failure. Generally, such condi- tions require ventilator support. Thus, we thought that the factors contributing to the lower number of VFD in the H group were the unstable circulatory status and massive infusion volume administered. A previous report showed that a norepinephrine dosage of 1 μ g/kg per minute was associated with an ICU death rate of 90%
and suggested that a dosage of norepinephrine greater than 1 μ g/kg per minute is an independent factor associ- ated with mortality in patients with septic shock [2].
However, the study by Martin and colleagues had a few problems related to fluid treatment for septic shock. The non-survivors group did not receive the same resuscita- tion infusion volume as the survivors group. Crystalloid was 1.0 L (0.0 – 2.5) in the 168 survivors vs 1.0 L (0.0 – 2.0) in the 156 non-survivors, and cumulative fluid ad- ministration was 1.5 L (0.9–3.0) in the 168 survivors vs 1.0 L (0.5 – 2.0) in the 156 non-survivors [2]. These results indicate that the non-survivors were not infused
Yamamuraet al. Journal of Intensive Care (2018) 6:12 Page 3 of 7
with an adequate amount of resuscitation volume in the initial period.
In our study, the H group received an adequate amount of resuscitation fluid compared with the L group over the initial 24 h and at 48 h. The most important
treatment strategy for patients with septic shock is initial fluid resuscitation and maintenance of the blood pres- sure. If patients with septic shock receive adequate infusion of fluid volume, the dose of norepinephrine may not be related to patient prognosis.
Table 1Patient characteristics
L group (n= 56)
H group
(n= 56) pvalue
Age, years 70.8 ± 13.4 70.5 ± 14.4 0.92
Male sex,n(%) 33 (58) 36 (64) 0.56
Body weight, kg 53.9 ± 11.2 54.7 ± 11.9 0.72
COPD (%) 4 (7.1) 3 (5.3) 0.70
Soft tissue infection (%) 4 (7.1) 4 (7.1) 1.00
Emergency surgery (%) 28 (50.1) 23 (41.1) 0.34
Site of infection (%)
Lung 16 (29) 13 (23)
Abdomen 29 (52) 23 (41)
Urinary tract 4 (7) 8 (14)
Skin and soft tissue 1 (2) 6 (11)
Others 6 (11) 6 (11)
APACHE II score 25 (19, 33) 25 (20, 30) 0.89
SOFA score 10 (8, 12) 10 (8, 12) 0.63
SOFA-R score 2 (1, 3) 2 (1, 3) 0.65
SOFA-P score 0.5 (0, 2) 1 (0, 2) 0.23
SOFA-L score 0 (0, 1) 0 (0, 1) 0.65
SOFA-C score 3 (3, 4) 4 (3, 4) 0.007
SOFA-N score 0 (0, 3) 1 (0, 2) 0.63
SOFA-K score 1.5 (0, 3) 1 (0, 2) 0.34
Systolic BP, mmHg 109 (26) 105 (28) 0.31
Mean BP, mmHg 73 (16) 72 (18) 0.75
Lactate level, mmol/L 4.5 (3.0, 7.8) 4.4 (3.6, 6.6) 0.94
Urine output, mL/day 1240 (298, 2302) 1279 (378, 2566) 0.84
WBC, mm3 8500 (4500, 14,109) 5000 (2250, 13,930) 0.18
FDP,μg/dL 15.8 (7.5, 28.0) 23.6 (10.5, 52) 0.02
Fibrinogen, mg/dL 337 (243, 532) 403 (271, 583) 0.26
CRP, mg/dL 11.9 (5.2, 24.4) 16.1 (5.4, 27.3) 0.76
PCT, ng/mL 29.3 (3.2, 81.5) 40.0 (12.9, 100) 0.11
Catecholamine
Total dopamine dosage (μg/kg) 15,727 (6180, 36,150) 28,532 (12,321, 43,407) 0.15
Total dobutamine dosage (μg/kg) 6191 (3652, 14,796) 23,051 (13,931, 35,760) 0.003
Total vasopressin dosage (IU) 9.8 (5.1, 15.4) 30.2 (12, 54.2) 0.05
Hospital length of stays, days 29 (31) 33 (29) 0.12
Renal replacement therapy (%) 18 (32) 32 (57) 0.008
Data are shown as mean ± SD, number of subjects (%), or median (IQR), as appropriate
SDstandard deviation,COPDchronic obstructive pulmonary disease,IQRinterquartile range,APACHE IIAcute Physiology and Chronic Health Evaluation II,SOFA Sequential Organ Failure Assessment,SOFA-RSequential Organ Failure Assessment Respiration score,SOFA-PSequential Organ Failure Assessment Coagulation score,SOFA-LSequential Organ Failure Assessment Liver score,SOFA-CSequential Organ Failure Assessment Cardiovascular score,SOFA-NSequential Organ Failure Assessment Central nervous system score,SOFA-KSequential Organ Failure Assessment Renal score,BPblood pressure,WBCwhite blood cell,FDP fibrinogen degradation products,CRPC-reactive protein,PCTprocalcitonin
Yamamuraet al. Journal of Intensive Care (2018) 6:12 Page 4 of 7
In previous in vitro and animal studies, norepineph- rine was shown to exert multiple anti-inflammatory actions [6, 7]. Exogenous norepinephrine infused into the portal vein of rats resulted in elevation of serum levels of IL-10 and IL-1 beta [8, 9]. Another study showed neutrophils incubated with norepinephrine dis- played an immunosuppressive phenotype [10–12]. These studies indicate that epinephrine may have anti- inflammatory effects. In contrast, clinical studies have not investigated norepinephrine in relation to immuno- suppressive reactions. Some studies investigating the correlation of the dosage of norepinephrine with mortal- ity indicated that a high norepinephrine level is associ- ated with high mortality in patients with septic shock [13]. However, no study found any correlation between the dosage of norepinephrine and immunological param- eters. The blocking action of endogenous catecholamine with β-blockers has improved the prognosis in patients with sepsis [14, 15] and reduced secondary infection in
pediatric burn patients [16]. These clinical studies suggested that a high catecholamine level may have led to immunoparalysis [17, 18].
In our study, some alternative vasopressors were also used to treat the patients with septic shock. More dobu- tamine, vasopressin, and renal replacement therapy were used in the H group than in the L group. However, mor- tality was not significantly different between the two groups. Our results indicated that renal replacement therapy and total dobutamine dosage also did not affect mortality. We surmise that because of the greater inflammatory action in the H group, the patients did not respond to the epinephrine effect and required the use of vasopressin and another vasopressor to maintain their blood pressure. The patients in a severe condition died earlier, and as a result, the doses of norepinephrine or another vasopressor in these patients might be smaller.
We also assessed the incidence of death at 28 days after excluding the patients who died within 3 days. However, there was no significant difference between the two groups, and thus we thought that the early death of some patients had no influence on mortality.
Several adverse effects of catecholamines were re- ported previously, such as pulmonary edema, bowel is- chemia, immunomodulation, increase cellular energy expenditure, and hyperglycemia [19 – 21]. Generally, we believed that a high concentration of catecholamine would increase mortality and worsen patient prognosis.
However, our results were contrary to those of previous reports and did not indicate that high norepinephrine usage worsened mortality or caused organ dysfunction such as bowel ischemia and pulmonary edema although we did not measure the actual catecholamine concentra- tion in serum. We think that high-dose norepinephrine may be used safely with no associated complications.
This study has several limitations. First, it was a nested cohort of a randomized control study, and use of a vaso- pressor other than norepinephrine was not allowed by
Fig. 2Twenty-eight-day mortality between the high-dose group and low-dose group
Fig. 3Ventilator-free days between the high-dose group and low-dose group.p= 0.03; by Wilcoxon
Fig. 4Dose of norepinephrine on each day. *p< 0.05 vs L group at each day
Yamamuraet al. Journal of Intensive Care (2018) 6:12 Page 5 of 7
the treatment protocol. Our study concentrated on the use of noradrenaline as the initial vasopressor, and use of another vasopressor was uneven. Second, use of an alternate vasopressor other than norepinephrine was left to each physician’s judgment. Third, we cannot deter- mine to what extent the mechanism of norepinephrine contributed to the change in mortality. Also, the duration of shock was similar because there was no significant difference in initial lactate levels and APA- CHE II scores between the two groups. However, the initial SOFA-C score was different. We attribute this difference in SOFA-C score to the catecholamine dosage in the two groups because the initial blood pressure was not different between the groups. The early recognition and treatment of septic shock in our patients may be one factor influencing our results. However, the greater inflammatory action occurring in the H group required a high-dose vasopressor.
Conclusions
There was no statistically significant difference in 28-day mortality between the patients with septic shock treated with high-dose norepinephrine vs those treated with low-dose norepinephrine. However, the number of VFD was significantly higher in the group treated with low- dose norepinephrine than in the group treated with high-dose norepinephrine.
Abbreviations
APACHE II:Acute Physiology and Chronic Health Evaluation II; CRP: C-reactive protein; FDP: Fibrinogen degradation products; ICU: Intensive care unit;
IQR: Interquartile range; PCT: Procalcitonin; SD: Standard deviation; SOFA: Sequential Organ Failure Assessment; SOFA-C: Sequential Organ Failure Assessment Cardiovascular; VFD: Ventilator-free days; WBC: White blood cell
Acknowledgements
We would like to thank the DESIRE Trial Investigators: Akihiro Fuke, MD (Osaka City General Hospital, Osaka, Japan); Atsunori Hashimoto, MD (Hyogo College of Medicine, Nishinomiya, Japan); Hiroyuki Koami, MD (Saga University Hospital, Saga, Japan); Satoru Beppu, MD (National Hospital Organization Kyoto Medical Center, Kyoto, Japan); Yoichi Katayama, MD (Sapporo Medical University, Sapporo, Japan);
and Makoto Itoh, MD (Yamaguchi Grand Medical Center, Yamaguchi, Japan).
Funding
The original study was supported in part by a noncontractual research grant to Wakayama Medical University provided by Hospira Japan.
Availability of data and materials
The datasets generated during and/or analyzed during the present study are not publicly available owing to currently ongoing research studies, but the data are available from the corresponding author on reasonable request.
Authors’contributions
HY made substantial contributions in data acquisition and writing of the manuscript. HY, YO, and TM contributed to the study design, statistical analysis, interpretation of data, and final approval of the manuscript. YK, TY, and KM made equally substantial contributions in data acquisition and reviewing the manuscript. HY critically revised the manuscript for important intellectual content. TM supervised the study. All authors read and approved the final manuscript.
Ethics approval and consent to participate
This study was approved by the institutional review boards of Wakayama Medical University and each participating institution. All patients provided necessary consent to participate in this study.
Consent for publication
No individual personal data are included in the study. All patients provided necessary consent to participate in this study.
Competing interests
Dr. Yamamura reports receipt of lecture fees from Hospira Japan, Nipro, and Asahi Kasei and educational consulting fees from Toray Industries, CSL Behring, Teijin Pharma, and Nihon Pharmaceutical. Dr. Kawazoe reports receipt of lecture fees from Hospira Japan and Pfizer Japan and a scholarship from Hospira Japan. Dr. Miyamoto reports receipt of lecture fees from Becton Dickinson and Pfizer Japan. Dr. Morimoto reports receipt of lecture fees from AbbVie, AstraZeneca, Daiichi-Sankyo, Kowa, Kyorin, Mitsubishi-Tanabe, and Pfizer Japan and consulting fees from Asahi Kasei and Boston Scientific. Dr.
Tomonori Yamamoto and Dr.Yoshinori Ohta, have no competing interests.
The other authors declare no competing interests.
Publisher ’ s Note
Springer Nature remains neutral with regard to jurisdictional claims in published maps and institutional affiliations.
Author details
1Department of Disaster and Critical Care Medicine, Hirosaki University School of Medicine, 5 Zaifuchou, Hirosaki, Aomori 036-8562, Japan.2Division of Emergency and Critical Care Medicine, Tohoku University, Sendai, Japan.
3Department of Emergency and Critical Care Medicine, Wakayama Medical University, Wakayama, Japan.4Department of Trauma and Critical Care Medicine, Osaka City University, Osaka, Japan.5Division of General Medicine, Hyogo College of Medicine, Nishinomiya, Japan.6Department of Clinical Epidemiology, Hyogo College of Medicine, Nishinomiya, Japan.
Received: 21 December 2017 Accepted: 8 February 2018
References
1. Rhodes A, Evans LE, Alhazzani W, Levy MM, Antonelli M, Ferrer R, et al.
Surviving sepsis campaign: international guidelines for management of sepsis and septic shock: 2016. Intensive Care Med. 2017;43:304–77.
2. Martin C, Medam S, Antonini F, Alingrin J, Haddam M, Hammad E, et al.
Norepinephrine: not too much, too long. Shock. 2015;44:305–9.
3. Stolk RF, van der Poll T, Angus DC, van der Hoeven JG, Pickkers P, Kox M.
Potentially inadvertent immunomodulation: norepinephrine use in sepsis.
Am J Respir Crit Care Med. 2016;194:550–8.
4. Kawazoe Y, Miyamoto K, Morimoto T, Yamamoto T, Fuke A, Hashimoto A, et al. Effect of dexmedetomidine on mortality and ventilator-free days in patients requiring mechanical ventilation with sepsis: a randomized clinical trial. JAMA. 2017;317:1321–8.
5. Singer M, Deutschman CS, Seymour CW, Shankar-Hari M, Annane D, Bauer M, et al. The third international consensus definitions for sepsis and septic shock (sepsis-3). JAMA. 2016;315:801–10.
6. Lyte M, Freestone PP, Neal CP, Olson BA, Haigh RD, Bayston R, et al.
Stimulation of Staphylococcus epidermidis growth and biofilm formation by catecholamine inotropes. Lancet. 2003;361:130–5.
7. Lyte M, Bailey MT. Neuroendocrine-bacterial interactions in a neurotoxin- induced model of trauma. J Surg Res. 1997;70:195–201.
8. Zhou M, Das P, Simms HH, Wang P. Gut-derived norepinephrine plays an important role in up-regulating IL-1beta and IL-10. Biochim Biophys Acta.
2005;1740:446–52.
9. Woiciechowsky C, Asadullah K, Nestler D, Eberhardt B, Platzer C, Schoning B, et al. Sympathetic activation triggers systemic interleukin-10 release in immunodepression induced by brain injury. Nat Med. 1998;4:808–13.
10. Tsuda Y, Kobayashi M, Herndon DN, Suzuki F. Impairment of the host’s antibacterial resistance by norepinephrine activated neutrophils. Burns.
2008;34:460–6.
11. Dunser MW, Ruokonen E, Pettila V, Ulmer H, Torgersen C, Schmittinger CA, et al. Association of arterial blood pressure and vasopressor load
Yamamuraet al. Journal of Intensive Care (2018) 6:12 Page 6 of 7
with septic shock mortality: a post hoc analysis of a multicenter trial.
Crit Care. 2009;13:R181.
12. Povoa PR, Carneiro AH, Ribeiro OS, Pereira AC. Influence of vasopressor agent in septic shock mortality. Results from the Portuguese Community- Acquired Sepsis Study (SACiUCI study). Crit Care Med. 2009;37:410–6.
13. Yoshigi M, Hu N, Keller BB. Dorsal aortic impedance in stage 24 chick embryo following acute changes in circulating blood volume. Am J Phys.
1996;270(5 Pt 2):H1597–606.
14. Morelli A, Ertmer C, Westphal M, Rehberg S, Kampmeier T, Ligges S, et al.
Effect of heart rate control with esmolol on hemodynamic and clinical outcomes in patients with septic shock: a randomized clinical trial. JAMA.
2013;310:1683–91.
15. Macchia A, Romero M, Comignani PD, Mariani J, D'Ettorre A, Prini N, et al.
Previous prescription of beta-blockers is associated with reduced mortality among patients hospitalized in intensive care units for sepsis. Crit Care Med.
2012;40:2768–72.
16. Jeschke MG, Norbury WB, Finnerty CC, Branski LK, Herndon DN. Propranolol does not increase inflammation, sepsis, or infectious episodes in severely burned children. J Trauma. 2007;62:676–81.
17. Boomer JS, To K, Chang KC, Takasu O, Osborne DF, Walton AH, Bricker TL, et al. Immunosuppression in patients who die of sepsis and multiple organ failure. JAMA. 2011;306:2594–605.
18. Leentjens J, Kox M, van der Hoeven JG, Netea MG, Pickkers P.
Immunotherapy for the adjunctive treatment of sepsis: from
immunosuppression to immunostimulation. Time for a paradigm change?
Am J Respir Crit Care Med. 2013;187:1287–93.
19. Dunser MW, Hasibeder WR. Sympathetic overstimulation during critical illness: adverse effects of adrenergic stress. J Intensive Care Med. 2009;24:
293–316.
20. Schmittinger CA, Torgersen C, Luckner G, Schroder DC, Lorenz I, Dunser MW. Adverse cardiac events during catecholamine vasopressor therapy: a prospective observational study. Intensive Care Med. 2012;38:950–8.
21. de Montmollin E, Aboab J, Mansart A, Annane D. Bench-to-bedside review:
beta-adrenergic modulation in sepsis. Crit Care. 2009;13:230.
• We accept pre-submission inquiries
• Our selector tool helps you to find the most relevant journal
• We provide round the clock customer support
• Convenient online submission
• Thorough peer review
• Inclusion in PubMed and all major indexing services
• Maximum visibility for your research Submit your manuscript at
www.biomedcentral.com/submit
Submit your next manuscript to BioMed Central and we will help you at every step:
Yamamuraet al. Journal of Intensive Care (2018) 6:12 Page 7 of 7
O R I G I N A L R E S E A R C H A R T I C L E
Differences in Adverse Drug Events Among Pediatric Patients With and Without Cancer: Sub-Analysis of a Retrospective Cohort Study
Akira Koizumi
1•Yoshinori Ohta
2•Mio Sakuma
1•Rika Okamoto
1•Chisa Matsumoto
1•David W. Bates
3,4•Takeshi Morimoto
1Published online: 4 August 2017
ÓThe Author(s) 2017. This article is an open access publication
Abstract
Objectives This study investigated the differences in the incidence and severity of adverse drug events (ADEs) in pediatric patients with and without cancer.
Methods We used data from the Japan Adverse Drug Events Study for pediatrics, a cohort study enrolling pediatric inpatients at two tertiary care teaching hospitals in Japan. ADEs were identified by on-site review of all medical charts, incident reports, and prescription queries by pharmacists. Two independent physicians reviewed all potential ADEs and classified ADEs in terms of severity and class of causative medication. We compared the inci- dence and characteristics of ADEs between pediatric can- cer patients and non-cancer patients.
Results We enrolled 1189 patients during the study period, 27 with cancer and 1162 without cancer. We identified 480 ADEs in 234 patients (20%): 191 ADEs among 21 cancer
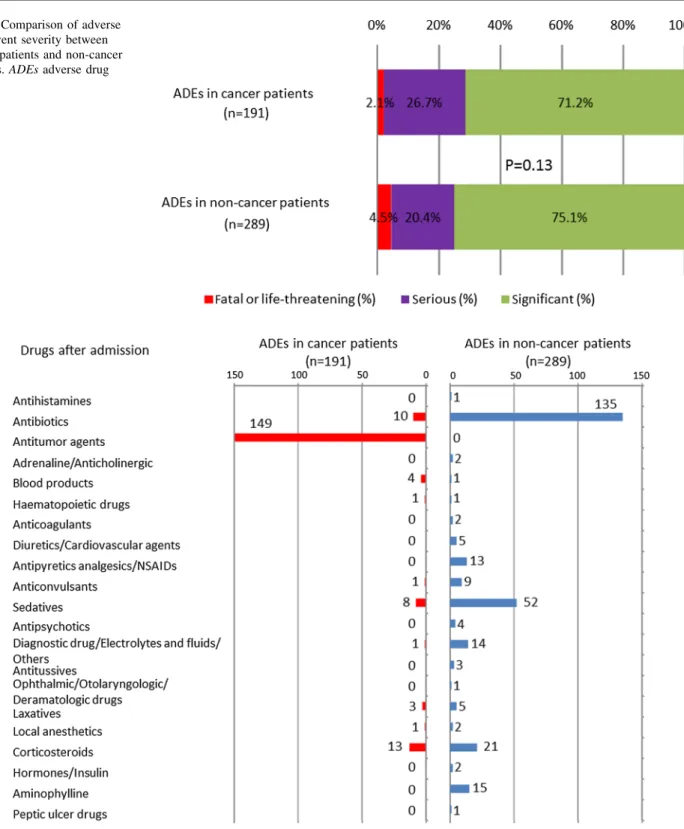
patients and 289 ADEs among 213 non-cancer patients (7.1 per patient vs. 0.25 per patient, respectively; p \ 0.0001).
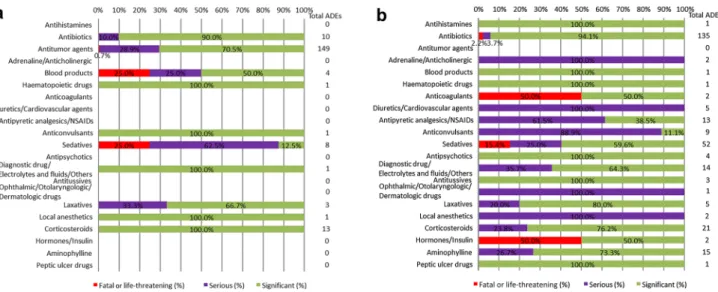
The most common medications associated with ADEs in cancer patients were antitumor agents; in contrast, medi- cations associated with fatal or life-threatening ADEs in cancer patients were most often sedatives (25%) and blood products (25%). Medications associated with fatal or life- threatening ADEs among non-cancer patients were most often sedatives (15%). The percentages of fatal or life- threatening ADEs in cancer patients and non-cancer patients were 2.1 and 4.5%, respectively.
Conclusions Pediatric patients with cancer have a higher risk for ADEs. Although the overall severity was similar between patients with and without cancer, the most com- mon classes of causative medication and medications associated with a higher rate of severe ADEs differed.
Application of this information may help minimize the impact of ADEs in pediatric patients.
Key Points
Adverse drug events occurred in pediatric patients with cancer 28 times more frequently than in those without cancer.
As expected, the medications most commonly associated with adverse drug events in pediatric patients with cancer were antitumor agents, but fatal or life-threatening events due to such medications were rare (0.7%).
The category of causative medication and severity of adverse drug events differed between pediatric patients with cancer and without cancer.
& Takeshi Morimoto
1 Department of Clinical Epidemiology, Hyogo College of Medicine, 1-1 Mukogawa, Nishinomiya, Hyogo 663-8501, Japan
2 Division of General Internal Medicine, Hyogo College of Medicine, Nishinomiya, Japan
3 Division of General Internal Medicine and Primary Care, Brigham and Women’s Hospital and Harvard Medical School, Boston, MA, USA
4 Department of Health Policy and Management, Harvard School of Public Health, Boston, MA, USA
Drugs - Real World Outcomes (2017) 4:167–173 DOI 10.1007/s40801-017-0115-8
1 Introduction
Adverse drug events (ADEs) are injuries due to medication use. ADEs represent a serious problem in healthcare because they are the most frequent cause of injuries due to medical care in hospitals in developed countries [1, 2]. In Japan, the JADE (Japan Adverse Drug Events) study, a multicenter cohort study, was conducted to estimate the epidemiology of ADEs in several settings [3]. In both Japan and in Western countries, ADEs have been associ- ated with substantial increases in morbidity and mortality [1, 3–5]. Patients who need chemotherapy often experience ADEs as the result of antitumor agents [6]. Pediatric inpatients are vulnerable to ADEs because they often cannot describe their symptoms and have small metabolic reserves [7, 8]. In particular, pediatric cancer patients receiving antitumor agents are at high risk for ADEs because of the nature of the patients and drugs involved [9, 10].
To examine the epidemiology of ADEs in pediatric inpatients, we conducted the JADE study for pediatric patients [11]. As a sub-study, we analyzed differences in ADEs between pediatric patients with and without cancer and evaluated the causes, symptoms, and severity of the ADEs.
2 Methods
2.1 Study Design and Patient Population
This study was based on the data from the JADE study for pediatric inpatients, which was a historical cohort study performed in two tertiary care teaching hospitals in Japan. The details of the study have been described elsewhere [11]. Briefly, we included all patients aged B15 years admitted to any ward, including the neonatal intensive care unit (NICU) and pediatric intensive care unit (ICU), and patients aged [ 15 years admitted to any pediatric ward over a 3-month period in 2009. Because some adult patients with congenital or metabolic diseases were cared for by pediatricians from a young age, such patients were included in this cohort study based on the protocol. We excluded neonates in well-baby nurseries from this study because they were healthy and not cared for by pediatricians. If neonates had a problem such as temporary dyspnea or mild cyanosis of the limbs at birth, they were admitted to the NICU and cared for by neonatologists. We included these neonates in this study.
We categorized the age groups as follows: neonates (aged \ 1 month), infants (1 month to \ 1 year), preschoolers (1 year to \ 7 years), school-aged children
(7 to \ 13 years), teenagers (13 to \ 19 years), and adults (C19 years).
The institutional review boards of the two participating hospitals approved the study. Because all data were obtained as part of routine daily practice, the institutional review boards waived the need for informed consent.
2.2 Definitions
The primary outcome of the study was the occurrence of ADEs, which we compared between pediatric patients with and without cancer. Cancer patients were defined as those who were diagnosed with any malignant tumor or those who had a tumor and were receiving antitumor agents. Non-cancer patients included those with benign or other tumors. We used validated methodology for the classification of ADEs [12]. An ADE was defined as a health injury occurring because of medication use. For example, nausea or vomiting in a patient receiving an antitumor agent was considered an ADE. We categorized the severity of ADEs as follows: fatal (resulting in death), life-threatening (requiring transfer to the ICU or causing anaphylactic shock), serious (neutropenia requiring a special protective environment, cutaneous lesions requiring therapy, gastrointestinal bleeding, altered mental status, excessive sedation, increased creatinine level, or decreased blood pressure), or significant (rash, diarrhea, or nausea).
Categories of ADE symptoms included bleeding; central nervous system; allergic or skin reaction; liver or metabolic dysfunction; cardiovascular; gastrointestinal; renal; respira- tory; bone marrow suppression or cytopenia; and other.
We categorized medications as follows: antihistamines, antibiotics, antitumor agents, adrenaline/anticholinergics, blood products, hematopoietic drugs, anticoagulants, diuretics/cardiovascular agents, antipyretic analgesics/
nonsteroidal anti-inflammatory drugs (NSAIDs), anticon- vulsants, sedatives, antipsychotics, diagnostic drugs/elec- trolytes and fluids/others, antitussives, ophthalmic/
otolaryngologic/dermatologic drugs, laxatives, local anes- thetics, corticosteroids, hormones/insulin, aminophylline, and peptic ulcer drugs. Antitussives did not include codeine but did include expectorants, and sedatives did not include narcotics or opiates. Because doses for pediatric patients were generally determined by body weight, and the stan- dard doses varied between drugs, we did not account for dose in the analyses.
2.3 Data Collection and Review Process
Trained reviewers based at each participating hospital reviewed all medical charts, laboratory results, incident reports, and prescription queries from pharmacists. The trained reviewers included a board-certified pediatrician,
168 A. Koizumi et al.