神戸学院経済学論集
第50巻 第3号 抜刷 平成30年12月発行
Halasiuk Viktor
Gross Fixed Capital Formation as Indicator of the Prospects for Economic
Development of the Country
Halasiuk Viktor
1Abstract
The article depicts the role of the gross fixed capital formation in ensuring the upward dynamics of the national economy development. The author elaborates the basic classification of the modes of investment activity by the ratio of gross fixed capital formation to gross domestic product of the country. The article analyses Ukraine’s background in accumulation of the investment resources with reference to economic dynamics of the country. The author develops his vision on measures, tools and mechanisms of the economic policy of the country to en- sure accelerated economic development of Ukraine based on intensification of in- vestment activity.
Key words: investment, gross fixed capital formation (GFCF), structure of economy, added value, gross domestic product(GDP), moderniza- tion, economic growth.
JEL Classification : E22, O16.
Gross Fixed Capital Formation as Indicator of the Prospects for Economic
Development of the Country
1 Ph. D. President of the Ukrainian Association for the Club of Rome. Associated Member of the World Academy of Arts and Science. Chairman of the Committee on Industrial Policy and Entrepreneurship in the Parliament of Ukraine, 3 Sadova Str., Kyiv, Ukraine, 01008.
1. Introduction
Examples of economic development of countries demonstrate that the success of modernization measures and structural transformation of the economy is largely determined by the level of investment in fixed capital(Briukhovetska, 2012). A number of researchers have devoted their scientific studies to this problem : Scutaru et al. (2008) studied the peculiarities of forecasting gross fixed capital accumulation in the national economy ; Nweke et al.(2017)developed a model for assessing the impact of the accumulation of fixed capital on the national economy development ; Lach L.(2010)summarized Poland’s experience of gross fixed capi- tal accumulation and assessed its importance for Poland’s GDP growth in the long run ; Mr. Horiachuk(2010)has defined that the task of the state policy should be to increase the quantitative and qualitative indicators of gross fixed capital forma- tion in the country ; Ms. Zymovets(2013)has given a detailed research on the financial policy measures which are necessary to take for gross fixed capital forma- tion in the real sector of economy ; Mr. Mahdich(2013)has studied the experience of Central and Eastern Europe in gross fixed capital formation during the period of market transformations. The article sets the goal to outline the set of industrial, monetary, fiscal and foreign trade instruments which are aimed at increasing of investment activity and accelerating of economic growth in the countries where the level of gross fixed capital formation is low.
Given the level of investment activity, the state of economic system of a country can be roughly divided into three modes : consumption, stabilization and moderniza- tion. The starting point to estimate these regimes is the ratio of gross fixed capital formation(GFCF)to gross domestic product(GDP). Gross fixed capital formation measures non-financial assets gains which will be used in economy for a long period
of time. In fact, these are the key investments in the further economic develop- ment. When ratio of GFCF to GDP is lower than 15%, it can therefore be said that the country is in the mode of consumption and its economy is doomed to stagnation in the long run even if the current market trends are favorable for a short-term growth. Such a mode is typical for the majority of commodity driven economies which demonstrate downward trends in the well-being level for a long period.
Preservation for several decades of the critically low ratio of GFCF to GDP con- serves recession and poverty, which gain considerable inertia and therefore, as a rule, require a lot of time and significant resources to address these challenges.
Among the countries which tend to live in such a mode for quite a long time there are Nigeria (GFCF ration to GDP amounted little less than 15% in 2016), Zimbabwe (12%), Madagascar(15%), Guatemala(13%), Pakistan (14%) and others.
GFCF of 1525% to GDP features stabilization mode, sufficient to sustain a moderate dynamics of economic development. This mode does not pose a serious risk of economic degradation, but yet it rather keeps moving by inertia than facili- tates the accelerated economic system modernization. The countries which so far are in this mode are Germany(20%), Great Britain(17%), Poland(18%), Italy (18%), France (23%), Mexico(22%), South Africa (19%)etc. Some of these countries experienced the accelerated growth in the modernization mode for many years and now, in fact, they are just retaining earlier achieved stage of wellbeing.
The stabilization mode appeared to be the highest level of development for some countries which they failed to exceed. By the way, GFCF ratio to GDP of the European Union is now amounting 20% while the worldwide average index reaches 23% (World Bank, 2018).
And, finally, GFCF ratio to GDP exceeding 25%indicates that the country is in the mode of modernization which lays the foundations for structural recovery and 神戸学院経済学論集 (第50巻第 3 号)
outstripping economic growth. None of the countries of economic system with strong agriculture, food and industrial sectors succeeded to increase well-being of their citizens without placing investment activity into this mode. “Asian Tigers”
are regarded as a classic example of countries which succeeded in achieving and maintaining a modernization mode so far China (42%), Malaysia (25%), Singapore(25%), South Korea(31%), Vietnam(25%), and also Turkey(30%).
Obviously, the GFCF level was not the only driver for rapid economic growth of these countries, but undoubtedly it played an extremely important role in this. As far as the inflow of investment brings jobs, manufacturing facilities, new technolo- gies and management practices into the country. This is the reason why countries are intensely engaged in the competition for the investments as much as for technologies, markets, talents and access to commodities.
It is important to outline that the mode of operation of the economy is not something given or predetermined ahead and cannot be deliberately changed. The countries choose by themselves their mode of development, hence an economic trajectory, and, in fact, they “program” future well-being and standards of living for the citizens through their economic policy. The issue is that in a short run and taking into account cycles of market trends, the effects of such a choice may be unclear. That is why international experience, historical context, study of the efficient policy and the missteps of the other countries are crucially important.
2. Gross Fixed Capital Formation in Ukraine
In the modern history of Ukraine, its economy underwent modernization mode by gross fixed capital formation only for 4 years(1992 and 20062008). The most of the time(in total 21 years : 1991, 19932005, 20092013, 20162017)Ukraine’s economy experienced stabilization mode. 20062008 were relatively positive years when the Ukrainian investment component was growing and GFCF of Ukraine was
increasing annually. This positive trend was lost in 2009 and ever since Ukraine has never succeeded to pass on from the stabilization to modernization mode(Fig.
1)
Since 2012, Ukraine has a clear downward trajectory by GFCF ratio to GDP, which caused the country’s transmission from the stabilization into consumption mode in 20142015. In 20162017 Ukraine is on the lowest edge of the stabilization mode. In terms of money, Ukraine experienced a sharp GFCF fall by 76.9%in the initial period of the transmission to market economy during 19911995. In 2017 the real GFCF was not much higher and amounted to 24 billion USD, which was only 14.3%higher than that in 1995.
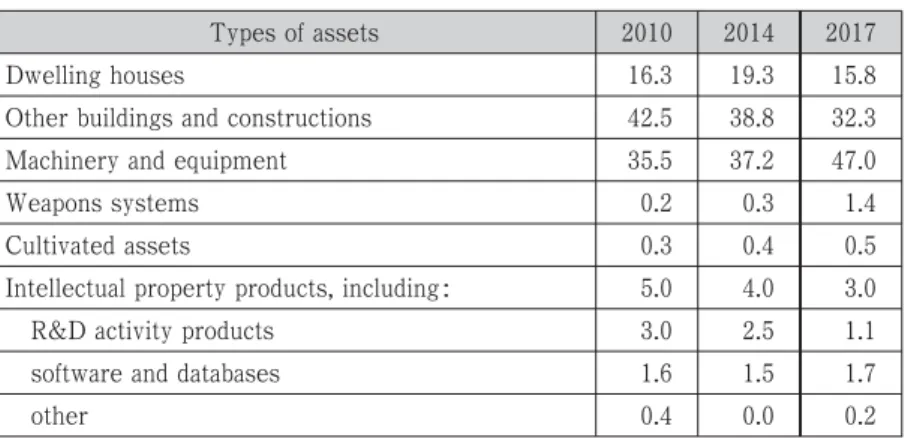
Along with that, attention must be paid to the structure of GFCF. According to the data provided by the State Statistics Service of Ukraine(SSSU, 2018), gross fixed capital formation in Ukraine amounted to 477.4 billion UAH in current prices (17.9 billion USD)in 2017 : 47.0%machinery and equipment ; 15.8%dwelling houses ; 32.2% other buildings and constructions. At the same time, the small 神戸学院経済学論集 (第50巻第 3 号)
30 28 26 24 22 20 18 16 14 12 10
1991 1992 1993 1994 1995 1996 1997 1998 1999 2000 2001 2002 2003 20052004 2006 2007 2008 2009 2010 2011 2012 2013 2014 2015 2016 2017
100 90 80 70 60 50 40 30 20 10 0
20 43
66 76 91 27
24 24 23
21
20 20 20 20
19 19
21 23
22
25 26
18 171819
17 14 14 27
1516 2024 18 17 2624 2325 21 4544 36 2831 2124 1920 21 1915 16 17
%ofGDP BillionUS$
Gross fixed capital formation(%of GDP) Gross fixed capital formation(constant 2010 US$)
Fig. 1. Dynamics of Ukraine’s GFCF ratio to GDP in 19912017 (World Bank, 2018)
share goes to intellectual property products3.0%, of which software and data- bases constitute only 1.7%, and R&D activity products1.1% (Table 1).
Threefold reduction of GFCF’s ratio of R&D activities from 3.0% in 2010 to 1.1%2017 is of a particular concern. Under such conditions the prospects of trans- mission to a modernization mode seem especially distant, since the gap between Ukraine and the developed countries by the level of technological development will be maintained if there is no appropriate investment into national R&D activities.
Obviously, active policy aimed at attracting global technologies into manufacturing processes through foreign investments is capable to slightly bridge this gap.
Although, it is important to keep in mind that no government / corporation will send out abroad its most progressive and advanced deliverables until it takes all the advantages of their essential potential in the home country. And at best they invest abroad previous generation technologies that require cheap labor and “flexible” tax legislation in order to maintain the competitiveness of the certain sectors.
As a result of too poor investment into R&D activities, Ukraine is still exploiting technological potential which it accumulated during the Soviet period. There are no
Table 1 GFCF structure by assets in Ukraine in 2010, 2014 and 2017,%
Types of assets 2010 2014 2017
Dwelling houses 16.3 19.3 15.8
Other buildings and constructions 42.5 38.8 32.3
Machinery and equipment 35.5 37.2 47.0
Weapons systems 0.2 0.3 1.4
Cultivated assets 0.3 0.4 0.5
Intellectual property products, including : 5.0 4.0 3.0
R&D activity products 3.0 2.5 1.1
software and databases 1.6 1.5 1.7
other 0.4 0.0 0.2
large-scale investments and investment projects in the enterprises of the highest technological innovation wave. Ukrainian economy struck between the third and the fourth waves. Manufacturing units of the fifth wave, which formed in Ukraine by 1990, are now almost completely destroyed. Meanwhile, 75%of current invest- ments are directed into manufacturing facilities of the third wave, 20%into those of the second wave, and only 4.5%into the manufacturing units of the fifth wave (Libanova, 2012). Given such tendencies, the increase of GFCF ratio to machinery
and equipment from 35.5% up to 47.0% during 20102017 does not seem so upbeat. So as we can see, in a dynamically changing world, the stabilization mode may indicate country’s stagnation and conservation of technological weakness.
3. Policies to Encourage Investments in Fixed Capital in Ukraine
To radically change the above situation, it is necessary to target at an annual economic growth rate of minimum 810% (Hawrylyshyn, 2009), substantial modernization of economic structure and change of “economic specialization” of Ukraine from commodities export to innovation and manufacturing. It is important now to focus on deliberate “warming up” of the economy using all the range of state intervention tools : through cost and “length” of loans, volumes and conditions of public procurement and investment, transport and energy tariffs, foreign trade rules, regulations, etc.
It is reasonable to systematize priority measures, tools and mechanisms of accel- erated economic growth in terms of “channels” of their influence on GDP(invest- ments, exports, consumption):
1)Increase of investments, first of all gross fixed capital accumulation, to set a modernization mode of the economy, among other things through :
introduction of effective tax, customs, tariff, regulatory and other investment incentives to attract large private investment to the real economy(including public 神戸学院経済学論集 (第50巻第 3 号)
procurement incentives for local manufacturers, tax breaks for small businesses, non-deterioration of tax guarantees, advantageous duties for national manufactur- ers, tax exemption on reinvested earnings, industrial parks with ready infrastruc- ture and tax incentives, lower energy tariffs and free connection to utilities for new manufacturing facilities, additional guarantees to investors in public-private part- nerships, etc.);
directing a monetary policy at increasing “financial depth” of the real economy (incl. through re-orienting monetary policies of the central bank to encourage
national economic growth, allocate public finances and international financial aid for loans to small businesses, new and knowledge-intense manufacturing ; introduction of state programs for interest rate compensation for small businesses and new manufacturing facilities, etc.);
ensuring a substantially greater role of a state as an investor that can temporar- ily substitute a private investor until the latter resumes its trust to the economy (through extensive infrastructure development and modernization ; public procure-
ment programs for equipment, machines and components mainly from local manu- facturers ; state construction programs ; participation in different public-private partnerships). Public spending on economic growth should be increased at the expense of funds received from optimization of current public spending, anti- smuggling measures, effective public property management, de-shadowing of the economy and de-offshorization, targeted currency emission into manufacturing, international financial aid, etc.
2) Stimulation of exports of Ukrainian manufacturers, among other things through elimination of regulatory export barriers ; timely VAT refund to exporters ; state insurance, guarantees and cheaper loans through export and credit agency ; renegotiation of new bilateral free trade agreements with countries with a good potential for Ukrainian export ; development of an effective network of trade
representative offices.
3)Increase of purchasing power, in particular through lower unemployment rate, higher real rather than nominal social standards in combination with lower tax burden and massive de-shadowing of the economy, as well as stimulation of manu- facturing in order to avoid “washing out” the resources from the economy due to excessive import.
4. Concluding Remarks
The share of Gross Fixed Capital Formation in GDP is one of the most demon- strative indicators of the prospects for economic growth of a country in a mid-term perspective. The gradation suggested in this work identifies three modes that national economies have depending on the share of Gross Fixed Capital Formation in GDP : consumption, stabilization, and modernization. Undoubtedly, this division is non-exhaustive and it can be broadened and specified in more detail in further research, however it serves as an effective methodological framework for primary analysis of reference conditions in countries for structural shifts in the economy and economic growth per se.
An in-depth analysis of the dynamics, size and structure of GFCF in Ukraine has evidenced a number of systematic problems which conserve its technological back- wardness and leave it a low rate of development. Their solution requires an active governmental policy with all the range of regulatory measures available.
Stimulating governmental influence should be focused on such key areas as invest- ments and exports, as well as purchasing power of households.
References
[1] Briukhovetska, N.(2012), “Ensuring capitalization of the economy by accumulating fixed capital”,Strategy and mechanisms for regulation of industrial development1, 3038.
神戸学院経済学論集 (第50巻第 3 号)
[2] Hawrylyshyn, B. (2009), “Towards More Effective Societies : Road Maps to the Future”, Thatcham : DolmanScott Books.
[3] Horiachuk, V.(2010), “The accumulation of fixed capital in Ukraine and state regu- lation of this process”,Theory and practice of public administration2, 5765.
[4] Libanova E.(2012), “Social problems of modernization of the Ukrainian economy”, Demography and Social Economy1, 522.
[5] Lach L. (2010), “Fixed capital and long run economic growth : evidence from Poland”,Systems Science36(4), 33-50.
[6] Mahdich, A. (2013), “Features of capital accumulation in transitive economies of Central and Eastern Europe”,European vector of economic development1, 117128.
[7] Nweke G. O., Odo S. I., Anoke C. I.(2017), “Effect of capital formation on economic growth in Nigeria”,Asian Journal of Economics, Business and Accounting5(1), 116.
[8] Scutaru C., Saman C., Stanica C.(2008), “Predictability and complexity in macro- economics. the case of gross fixed capital formation in the Romanian economy”, Romanian Journal of Economic Forecasting4, 196205.
[9] State Statistical Service of Ukraine(2018), “Gross fixed capital formation by kinds of non-financial assets”, Retrieved from : http://www.ukrstat.gov.ua.
[10] World Bank(2018), “Gross Fixed Capital Formation(%of GDP)”, Retrieved from : https://data.worldbank.org/indicator/NE.GDI.FTOT.ZS?view=map.
[11] Zymovets, V.(2013), “The accumulation of capital in the real sector and state finan- cial policy”,Journal of the Institute of Economics and Forecasting4, 3946.