Analysis of land use/cover changes and animal population dynamics in a wildlife sanctuary in Kenya
Charles N. MUNDIA and Yuji MURAYAMA Abstract
Land use/cover changes in wildlife conservation areas have serious implications for the ecological systems and distribution of wildlife species. Using Masai Mara as an example of an ecosystem rich in biodiversity but now under threat, we analyzed long-term land use/cover changes and wildlife population dynamics. Multi- temporal satellite images (1975, 1986, and 2007) together with physical and socio-economic data were employed in a post classification analysis with GIS to analyze outcomes of different land use practices and policies. The results show rapid land use/cover conversions and a drastic decline for a wide range of wildlife species. The changing habitat has led to loss of grazing and dispersal areas and could be responsible for the observed 60% wildlife decline in the 32-year study period. Integration of land use/cover monitoring data and wildlife resources data can allow for analysis of changes from past to present, and can be used to project trends into the future to provide knowledge about potential land use/cover change scenarios and ecological impacts.
Keywords: Masai Mara ecosystem, land use/cover, post classification analyses, GIS, wildlife habitat.
1. Introduction
Land use/cover changes occurring in areas surrounding protected animal parks may substantially influence the natural resources within these parks. As human population increases, biodiversity is facing widespread competition with humanity for space and resources and there is increasing conflict between the need for biodiversity conservation and economic development. The Masai Mara ecosystem comprising of Masai Mara National Reserve and the adjoining group ranches hold spectacular concentration of wildlife and is home to the iconic Masai pastoralists making it a popular international tourism destination.
Charles N. Mundia: Division of Spatial Information Science, Graduate School of Life and Environmental Sciences, University of Tsukuba. Tennodai 1-1-1, Ibaraki, 305-8572, Japan. Email:[email protected]
The Masai Mara ecosystem however, embodies many issues in biodiversity conservation. Despite being a vast area incorporating a major protected area, its many wildlife species require access to large, unprotected dispersal ranges inhabited, and increasingly transformed, by agro-pastoral human communities. Sustainable coexistence of the regions pastoral people with the wildlife populations is being threatened by the increasing human activities. There are many variables at play in Masai Mara. The ecosystem has different land zones with different land uses. The national reserve, owned and controlled by two local governments is exclusively for wildlife tourism and conservation. The adjacent group ranches are owned privately or communally and have multiple land uses. This ecosystem also lies on the border with Tanzania, where socio-economic, political and land tenure systems are different. Wildlife movements across the border show that the protected areas are not adequate for the protection and viability of wildlife species 1
in the ecosystem. What is happening in the adjoining group ranches therefore has a direct influence on the wildlife in the protected areas.
The objective of this study is to analyze the long-term land use/cover changes and wildlife population trends in Masai Mara ecosystem. We summarize the changes in land use/cover, wildlife, and livestock population and develop a conceptual model to explain the land use/cover change dynamics.
2. Study Area
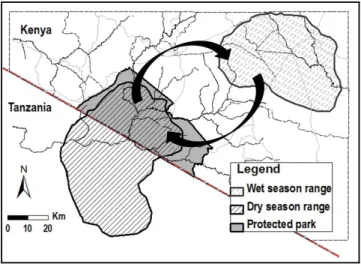
Wildlife movements in the study area are illustrated in Figure 1. The national reserve is unfenced and contiguous with the adjacent unprotected land and the Serengeti National Park in Tanzania to the south.
Figure 1: Wildlife movements in the study area
The surrounding unprotected areas are a mixture of private and communally owned land. Recently, subdivisions of group ranches into parcels of privately owned land have been widely promoted, resulting in significant land transformations including mechanized farming and tourism activities.
3. Data and Methods
This study integrates data from different sources, and uses different methods and approaches. To analyze wildlife and livestock population changes, we used animal counts from aerial census conducted by the Department of Resource Survey and Remote Sensing (DRSRS) between 1975 and 2007 using systematic reconnaissance flights fitted with GPS sets. To characterize land use/cover changes, we used satellite data as outlined in Table 1 below.
Table 1: Key characteristics of satellite data
Satellite Sensor Acquisition date Resolution Landsat MSS Landsat 2 1975/02/11 75/120 Landsat TM Landsat 4 1986/10/17 30/120 ALOS AVNIR-2 2007/07/24 10
Our methodology is summarized in Figure 2. Based on the results of the unsupervised classification, ground data and authors knowledge of the study area, clusters of pixels representing various land use/cover categories were selected as training sets and their spectral response patterns were generated. Based on spectral separability, the training areas were suitably modified and the final spectral response patterns were generated, and used to classify the images using a Gaussian maximum likelihood per pixel classifier.
The classification accuracies were then estimated following the procedure by Bishop et al (1975). Post classification analyses were performed to quantify and identify the changes that occurred over the study period. Further, using GIS techniques, qualitative interrelationships between various variables were analyzed and a conceptual model depicting land use dynamics was developed and key relationships were evaluated.
2
Figure 2: Methodology.
4. Results
Classified results of land use/cover for 1975, 1986 and 2007 are presented in Figure 3 and the changes in Table 2.
Figure 3 Land use/cover maps for Masai Mara ecosystem for 1975, 1986 and 2007 derived from satellite images.
Farmland, grassland, shrubland and forest area were the dominant land use/cover classes. Significant spatial
expansion in farmland and the rapid decrease in forest cover within and close to the Masai Mara National Reserve were observed in the 1986 and 2007 land use/cover maps.
Table 2: Observed land use/cover changes for Masai Mara.
Land use/cover 1975 2007 % change Area (ha) % Area (ha) % 1975-2007 Farmland 15,540 1.2 147,490 11.5 10.3 Grassland 243,940 18.9 191,070 14.9 - 4.0 Forest 138,430 10.8 123,600 9.6 -1.2 Shrubland 886,090 69.0 822,030 64.0 - 5.0 Total 1,284,000 100.0 1,284,000 100.0
Note: Total area corresponds to the area in Fig. 3
Analysis of long-term aerial census data show very rapid decline for most wildlife species. Population trends for the livestock and the three most abundant wildlife species in Masai Mara ecosystem are presented in Figure 4.
Figure 4: Population trends of wildlife and livestock in Masai Mara National Reserve and surrounding areas.
Source: Department of Resource Survey and Remote Sensing (DRSRS).
Analysis of wildlife dynamics indicates that the wildebeest population decreased by 74% while the expansion of 3
mechanized farming took place on the wet season rangelands, which were fenced off to exclude wildlife.
Livestock population trends over the same period show fluctuating patterns with an increase in recent years.
5. Conceptual model
Following our remote sensing based analysis and extensive fieldwork assessment in Masai Mara, we developed a conceptual model shown in Figure 5 that analyzes the dynamics of ecosystem change in terms of competition for land and competition for biomass.
Figure 5: Conceptual model depicting the land use/cover dynamics in Masai Mara ecosystem.
The total ecosystem area is in demand for subsistence, tourism, mechanized cultivation, and for grazing for both livestock and wildlife. These land demands are controlled by socio-economic factors but also compete for limited space. The transitions while driven by many factors have underlying human drivers. Foremost among these is land conversion to agriculture especially the expansion of mechanized farming which is controlled by economic factors. Wildlife and livestock compete for biomass and the size of livestock is linked to pastoralist’s decision and their
wealth. Around the conservation areas, a significant portion of pastoralist wealth derives from tourism activities. These factors together with the tourism management style and the environmental conservation policies have contributed to the current scenario.
6. Conclusions
Increasing land use/cover changes and the drastic decline in wildlife population have been observed in the Masai Mara ecosystem. Information about these changes is important for planning. For this study, we integrated data from different sources and used different approaches including satellite remote sensing, field surveys and wildlife population trend analysis. Post classification analysis and integration of various data using GIS approach was adopted to examine changes and wildlife population dynamics.
The results show rapid land use/cover conversions and a drastic decline for a wide range of wildlife species. It is urgent that all necessary measures are taken in order to strike a balance between wildlife conservation and economic development. It is also important to revise and strengthen the wildlife policy so that wildlife species in private group ranches outside the Masai Mara National Reserve are protected and habitats are conserved to ensure sustainable tourism and balanced economic development.
Acknowledgement
This work was funded by Japan Society for Promotion of Science (JSPS).
References
Bishop, Y., Fienberg, S., Holland, P. (1975) Discrete Multivariate Analysis-Theory and Practices (Cambridge, MA: MITR Press)
4