Improving Domestic Revenue Mobilization in Lao PDR
Sivay VILAIHAN1 Visiting Scholar
Policy Research Institute, Ministry of Finance, Japan
1The views expressed are those of the author and do not represent the views of the Ministry of Finance, Lao PDR and the Policy Research Institute, Ministry of Finance, Japan
ii TABLE OF CONTENTS
List of Charts ... iv
List of Figures ... iv
List of Tables ... iv
Abbreviations ... v
Abstract ... 1
1. Introduction ... 2
2. Literature Review and Case Studies ... 4
2.1 Concept of domestic revenue mobilization ... 4
2.2 Case studies of domestic revenue mobilization ... 6
2.3 Analytical tools and techniques for assessing domestic revenue mobilization ... 10
3. Lao Economy and Public Finance ... 12
3.1 Lao Economy ... 12
3.1.1 Real growth rate and GDP per capita ... 12
3.1.2 Population growth ... 14
3.2 Public finance ... 19
3.2.1 General budgetary operation ... 19
3.2.2 Budget revenue ... 21
3.2.3 Tax revenue ... 23
3.2.4 Comparison of Lao tax system with neighboring countries in the region ... 25
3.2.5 Budget revenue collection and taxpayers ... 28
3.2.6 Current situation of tax policy and administration ... 33
4. Assessment of Domestic Revenue Mobilization in Lao PDR ... 34
4.1 Assessment of tax revenue development from the previous reform measures ... 34
4.2 Public Finance Development Strategy ... 38
4.3 Tax policies ... 43
3.3.1 Review tax policies to contribute to amend existing and draft new legislatives ... 43
3.3.2 Broaden tax bases ... 45
4.4 Tax Administration ... 45
3.4.1 Revenue collection improvement ... 45
3.4.2 Modernization of tax administration system ... 49
3.4.3 Staff and institutional capacity development ... 51
iii 4.5 Donor support ... 53 5. Conclusion and Recommendations ... 54 References ... 60
iv LIST OF CHARTS
Chart 1. Organizational of Ministry of Finance of Laos………..30
LIST OF FIGURES Figure 1. Real Growth Rate and GDP per Capita……….14
Figure 2. Population Growth, 1985-2015………...………....15
Figure 2.1. Age Pyramid of the Population, 2005-2015………..16
Figure 2.2. Age Composition percent of the Population, 1995-2015………..17
Figure 2.3. Married Status percent of the Population, 1995-2015………...17
Figure 3. Budgetary operation percent to GDP for 2003-2018………20
Figure 4. Trend in domestic revenue and grant 2002-2018………..21
Figure 5. Trend in Budget Revenue as Percent of GDP from 2002-2018……….22
Figure 6. Tax revenue by items in percent of GDP from 2002-2018………24
Figure 6.1. Lao Tax Structure vs Regional Average………....25
Figure 6.1.1 Profit Tax or Corporate Income Tax (CIT), Rates and Productivity………..26
Figure 6.1.2 Personal Income Tax (PIT), Rates and Productivity………27
Figure 7. Budget revenue collection by Department in 2017 (Billions of LAK) ……….29
Figure 8. Tax Revenue Development by Items in Percent of GDP from 2002-2018………34
Figure 9. Timeline of Major Tax and Customs Reforms in Lao PDR (1995-2020) ……….35
Figure 10. Public Finance Management Reform Phases……….39
LIST OF TABLES Table 1. Enumerated Population and Intercensal Annual Growth Rate of Lao PDR………...16
Table 2. Domestic revenue collection by revenue departments from January-December 2017……….29
v ABBREVIATIONS
ADB - Asian Development Bank
AfDB - African Development Bank
BCEL - Banque Pour Le Commerce Exterieur Lao Public BEPS - Base Erosion and Profit Shifting
CIF - Cost Insurance and Freight
CIT - Corporate Income Tax
CRS - Computer Reservation System
CSIS - Center for Strategic and International Studies DRM - Domestic Resource Mobilization
ECDPM - European Centre for Development Policy Management
EU - European Union
FDI - Foreign Direct Investment
FMIS - Financial Management Information System GDP - Gross Domestic Product
GoL - Government of Laos
ICT - Information and Communication Technology IFC - International Finance Corporation
IMF - International Monetary Fund
IT - Information Technology
JICA - Japan International Cooperation Agency
LAK - Laotian Kip
Lao PDR - Lao People Democratic Republic LDC - Least Developed Country
vi LICs - Low-Income Countries
LTU - Large Taxpayer Unit
MTRS - Medium Term Revenue Strategy
NSEDP - National Socio-Economic Development Plan ODA - Official Development Assistance
OECD - Organization for Economic Cooperation and Development PERs - Public Expenditure Reviews
PFM - Public Finance Management PHC - Population and Housing Census
PIT - Personal Income Tax
POS - Point of Sale
SDGs - Sustainable Development Goals SOEs - State-Owned Enterprises
TA - Technical Assistance
TaxRIS - Tax Revenue Information System TIN - Tax Identification Number TSDP - Tax Strategic Development Plan
UNCTAD - United Nations Conference on Trade and Development UNECA - UN Economic Commission for Africa
USAID - United States Agency International Development USD - United States Dollar
VAT - Value Added Tax
WB - World Bank
1 ABSTRACT
How can a developing country like Lao PDR enhance domestic revenue collection to fund its vast development needs to support the National Socio-Economic Development Plan and to graduate from the Least Developed Country (LDC) status. Some of the key solutions of this question can be revealed by analyzing and assessing historical data and tax reform experiences in Lao PDR. Some recommendations stand out through Lao circumstances: (1) high management commitment and involvement of key stakeholders are vital importance to support tax reforms to achieve revenue collection goals; (2) continuously pursuing both existing tax policy and revenue administration tend to see much larger and constant gains in the medium and long run; and a successful strategy often starts with public finance management reform measures with immediate effect to build momentum. These can include: simplifying the tax revenue system; keeping in check exemptions, tax incentives and tax holidays; continuously modernizing the tax system; better managing compliance risks through taxpayer segmentation, beginning with strengthening the large taxpayer units (LTUs). In addition, a comprehensive reform strategy should include a medium-term revenue strategy, which can help to properly sequence reform measures and facilitate their implementation.
Keywords: domestic revenue mobilization, tax revenue, tax policy, tax administration, tax reform, and public finance management.
2 1.INTRODUCTION
The domestic revenue mobilization through taxation reforms is central to Lao PDR to finance social and economic development. Enhancing tax reform is essential to ensure the needs for improvement in the future of tax administration and ensure that tax revenue collection increases to GDP (at a level of 16-18 percent of GDP) as well as to support the macro-fiscal objectives of the Government and the National Socio-Economic Development Plan. Since, domestic revenue collection in Lao PDR was in downward trend compared to GDP in the recent years. Tax collection in such low levels, puts aspirations of enhancing tax revenue mobilization in Lao PDR, including not least putting obtainment of the Sustainable Development Goals (SDGs) at risk. The crucial need to mobilize additional domestic resources is heightened by the uncertain prospects for Official Development Assistance (ODA) and the currently rising trend of public debt in Lao PDR. Against this background, reinvigorating efforts to mobilize domestic revenues will be central to the government’s efforts to maintain macroeconomic stability, while making progress in addressing the country’s pressing development needs. Tax revenue mobilization, also, aiming at increasing tax collection with the effort to achieve the goals and objectives mentioned in the Public Finance Development Strategy as well as the Tax Strategic Development Plan is of critical importance for Lao PDR.
This paper uses historical fiscal data, public finance, tax policy and tax administration measures and reforms taken in Lao PDR from 2002-2018 and other countries’ experiences to analyze and assess how domestic revenue mobilization is influenced through those reform strategies and measures. Causality cannot reliably be inferred given the lack of additional data related to micro- evidence in Lao PDR during the study period. Therefore, further extension to deeper study and analysis by using different tools and techniques may be needed. The research focus on how to enhance tax revenue collection to finance the vast the national socio-economic development requirements by analyzing and assessing the strategies and measures have been taken by the Government of Lao PDR in those periods.
By analyzing and assessing what worked in Lao PDR, the author draws broad lessons what strategies other low-income countries or developing economies could consider. Precisely speaking, there is no one-size-fits-all approach, however, one can hope to find in the experiences broad and
3 potentially generalizable features that appear to have contributed to considerable revenue increases.
The goal of this paper is, therefore, to encourage policymaking to continue to consider substantial taxation reforms and support them in doing so, by sharing other country experiences in achieving large tax revenue increases. The high level-management commitment and involvement of key stakeholders, and comprehensive implementation of the strategies related to tax reform should be in place in order to achieve the goal and objectives of rising tax revenue to GDP in the future.
The rest of the paper is organized as follows. The paper looks at various literature reviews and case studies of enhancing domestic revenue mobilization. Then it looks into a general background of the Lao economy and public finance development. In addition, the paper assesses the key taxation and reforms measures under previous and existing reform strategy which led to large revenue gains, and what needs to be done to further improve domestic revenue mobilization. Consequent upon assessing tax revenue development and existing reform strategy and measures, the paper concludes by highlighting some key lessons learned for this scoping exercise and then provides some recommendations by deepening ongoing reform measures, and drawing lessons learned from case studies.
4 2.LITERATURE REVIEW AND CASE STUDIES
2.1 Concept of domestic revenue mobilization
Domestic resource mobilization (DRM) refers to the generation of government revenue from domestic resources, from tax or non-tax resources (royalties, licenses, levies or other income).2 DRM creates additional space to sustain budgetary expenditures, fosters ownership and reduces reliance on external aids. When assessing DRM, both the volume of revenue (e.g. tax to GDP ratio) and the content and fairness of tax policies (e.g. to avoid distortions and inequity) must be considered).
The ability to collect taxes is a key concern of economic policymakers in several countries.3 Many studies have shown that while some countries exhibit marked increases in their tax-to-GDP ratios, others indicate no increase in their ratios over extended periods. Greater domestic revenue mobilization is critical for many countries, and especially in developing countries, enhancing the mobilization of tax resources is integral for governments to create fiscal space to fund public investment and deliver public services. Enhancing tax revenue collection is therefore at the top of agendas of policymaking in many countries. In recent years, many governments and multilateral institutions have shown wider and renewed aspirations for enhancing tax revenue capacity, originating in the recognition that tax revenue capacity is at the core of state building and development. The importance of building tax revenue capacity was called on by many international organizations to monitor revenue mobilization efforts.
Financing for development on issues in domestic public resource mobilization and international development cooperation were core issues which were discussed in the Addis Ababa Action Agenda of the Third International Conference on Financing for Development (see Note of Trade and Development Board on Intergovernmental Group of Experts on Financing for Development in the first session by the UNCTAD Secretariat, 2017). Center for Strategic and International Studies (CSIS) (2016) also discusses domestic resource mobilization (DRM) and public finance management (PFM) by exploring several facets of domestic resource mobilization and examining the interaction between DRM and PFM. The results show that DRM is commonly defined as the mix of financial resources available to a government to finance its operations, including direct and
2 European Commission, “Domestic Resource Mobilization”: ec.europa.eu/euopeaid/financing- development/domestic-resource-mobilization_en. accessed November 14, 2019.
3Akitoby et la. (2018)” Tax Revenue Mobilization Episodes in Emerging Markets and Low-Income Countries:
Lessons from a New Dataset” Working Paper, International Monetary Fund.
5 indirect taxes, other revenue, and borrowing from local capital markets. This series of policy platforms is primarily concerned with the tax or domestic revenue side of DRM and these two subsequent platforms explore to how good PFM impacts DRM and the political side of DRM by examining tax system reform and the role of donors. Donors have long provided assistances for tax reform, however, since the adaptation of the Millennium Development Goals in the 2000s, donor and recipient countries have increasingly placed local resources at the central of efforts to tackling development challenges. This conversation has obtained vital importance in last five years as international communities adopted the more ambitious Sustainable Development Goals in 2015, which aim to get rid of extreme poverty by 2030.
The European Centre for Development Policy Management (ECDPM) (2011) discusses fiscal challenges and development opportunities about key questions on domestic resource mobilization.
Although the question of domestic resource mobilization (DRM) has never been of the development agenda, not least in developing countries, it is increasingly the emphasis on renewed favor from developing and developed economies alike. This is especially so since the Monterrey Consensus (2002) and Doha Declaration on Financing for Development (2008), which highlight the requirement to foster sustainable and efficient mechanisms to generate public domestic resources in developing countries, through tax policy in particular. As further illustration, the Organization for Economic Cooperation and Development (OECD), the African Development Bank (AfDB) and UN Economic Commission for Africa (UNECA) chose to select the 2010 edition of the African Economic Outlook on ‘Public Resource Mobilization and Aid.’ While African governments have been committing to good governance and improving tax performance in national budgets, two recent European Commission Communications, on EU Development Policy and Budget Support respectively, both prominently mention the need to assist to improve domestic revenue mobilization in developing countries.
According to the Learning Product on Tax Revenue Mobilization: Lessons from World Bank Group Support for Tax Reform, World Bank (2017), domestic revenue mobilization through tax reforms is important to ensuring sustainable financing of development. Many international initiatives are under processes that focus attention on constraints to growth, especially in low- income countries, where domestic taxes and foreign private and market-related borrowing do not expand enough to pay for declining flows of official development assistance. This learning note
6 reviews World Bank Group support to tax policy and administration reform over period 2005-2015 by drawing mainly on three sources such as a systematic review of Implementation Completion and Results Reports Reviews of World Bank operations and EvNotes for IFC Advisory Services, related Project Performance Assessment Reports, and relevant countries case studies from various Independent Evaluation Group evaluations. The evaluative findings cover two dimensions of effectiveness in case of tax reforms and the quality of monitoring and evaluation are vitally important for domestic revenue mobilization.
Domestic revenues can lead to improved development only if they are translated into productive and beneficial public expenditure. As a result, either revenues are taken as given or spending is considered without addressing the tax policy and administrative measures needed to yield the required resources. Considering tax and expenditure policy issues jointly greatly enhances the likelihood of achieving revenue sufficiency for sustained economic and social development. The two goals are linked and should be addressed in tandem. Therefore, both revenue and expenditure reforms should be embedded in broader public financial management reforms. When this is done, domestic revenue mobilization rightly becomes a development tool for generating revenues to support sustained and inclusive economic development.4
2.2 Case studies of domestic revenue mobilization
Akitoby et la (2018 and 2019) studied Tax Revenue Mobilization Episodes in Emerging Markets and Low-Income Counties by taking lessons from a new dataset that provides a comprehensive and analysis of efforts to increase tax revenues in Low-Income Economies and Emerging Markets between 2000-2015; and the case studies in Tax Revenue Mobilization in Low-Income Countries by analyzing and using information from IMF country reports (including staff reports and technical assistance (TA) reports) as well as conducting interviews with mission chiefs, country desk economists, and TA experts who engaged with the authorities on tax reforms of seven episodes of large tax revenue mobilization in Burkina Faso, The Gambia, Maldives, Mauritania, Rwanda, Senegal, and Uganda. These studies conclude that tax revenue mobilization during the period which revenue administration and tax policy reforms played a vital role in rising the tax-to-GDP ratios of those countries and case study countries can strengthen their capacity to collect tax revenue
4Junquera-Varela, Raul Felix, Marijn Verhoeven, Gangadhar P. Shukla, Bernard Haven, Rajul Awasthi, and Blanca Moeno-Dodson. 2017. Strengthening Domestic Resource Mobilization: Moving from Theory to Practice in Low-and Middle-Income Countries. Directions in Development. Washington, DC: World Bank.
7 by pursuing reform strategies. It is essential to note that, while these countries enhanced tax collection through tax policy and revenue administration reforms, this does not imply that there remains no scope to further raise tax collection.
Akitoby et., la (2018 and 2019) show that tax policy and revenue administration reform featured prominently and covered a broad spectrum of legal, technical, and administrative measures as follows:
Tax policy reforms
Reviewing tax exemptions
Reviewing and removing tax exemptions, including tax holidays, and tax incentives to assess tax expenditures and building capacity for developing estimates of tax expenditure will help to improve tax policy, revenue performance, and transparency of the tax system and better inform decision making. Improvement in revenue performance can be gained from both reducing tax policy gaps, in areas of tax legislations that may result in revenue losses as from tax incentives, or from strengthening tax administration with improvements in taxpayer compliance. In several cases, tax reforms both reduced tax expenditures and tax rates, resulting in increased revenue yield. Tax expenditure reduction has been implemented in a variety of ways, including reducing or limiting tax holidays, reducing exemptions, and most specifically reducing investment incentives that benefit only some industries while the rest of the economy bears the full tax burden.
Removing or curbing exemptions would enhance the tax base and increase tax revenues, while reducing the tax system’s complexity. Several countries lose a sizable revenue through poorly- designed exemptions such as costly tax holidays and other tax incentives to attract investment.
From case studies, some low-income countries removed or reduced tax exemptions, for instance, Uganda reduced many exemptions for VAT in which of many goods were removed from zero- rating), in the case of Mauritania, the exemption on corporate income tax (CIT) were removed to enhance revenue by 1.3 percentage points of GDP. Rwanda revised its investment code to eliminate some exemptions and removed incentives granting VAT exemptions on imports for investment certificate holders. It should, however, be noted that even though removal of tax exemptions can be a done quickly with support from core stakeholders, it is easy to reverse the reform as well.
Simplify tax system and reform indirect taxes
8 A simplified tax system can be essential in fostering taxpayer compliance and a simpler tax system and legislation could improve tax administration in case studies from Burkina Faso and Senegal.
Reform indirect taxes on VAT and general goods and services taxes. The VAT, though it would require thorough preparation, has proved to be an efficient and strong revenue booster: countries that introduce a VAT tend to raise more revenue than those without one (Keen and Lockwood, 2010). The Gambia replaced a general sales tax with a VAT in 2013 to broaden the tax base and lift indirect tax revenues by 1-1.5 percent of GDP. Mauritania implemented VAT reforms (e.g., covering the mining sector, broadening the tax base, increasing VAT registries) and improved VAT C-efficiency from 37 percent in 2009 to 72 percent in 2012. Maldives introduced the tourism sector goods and services taxes and the general goods and services taxes in 2011 to achieve a sizable increase in indirect taxes.
Tax administrative reforms:
1) Enhancing management, governance, and human resources in cases of The Gambia, Maldives, Rwanda, Senegal, and Uganda by headquarters design and monitoring-function efforts were set up or refined, which improved capacity to design and monitor delivery of administrative programs, and helped to support tax collection, including by hiring more qualified staff and investing in strengthening the technical skills of staff of revenue agencies.
2) In establishing or strengthening the segmentation of taxpayers by properly managing tax compliance risk, the segmentation of taxpayers—taking into account different characteristics and compliance risks—is critical. Taxpayers segmentation improves the organization and operations of tax administration, beginning with the establishment and/or strengthening of the Large Taxpayer Office in case of Burkina Faso, Senegal, and Uganda, and implementing appropriate compliance programs for segmentation. As a result, filing and payment compliance was facilitated across segments.
3) Enhancing compliance risk management by identifying, assessing and mitigating compliance risks is important to support the functioning of the tax administration.
Comprehensive reforms by targeting all segments and covering all domains. Senegal, Rwanda, and Uganda, for example, established fundamental elements of a compliance management system, while the Maldives launched an audit program to enhance tax compliance.
9 4) Introducing more modern business procedures leveraging IT—Successful revenue mobilization hinges on managing information and leveraging the power of the data to improve compliance and fight tax fraud. Country case studies have taken advantage of IT systems to advance their revenue mobilization reforms. Uganda, for example, redesigned business processes and automated them using e-tax. Also, the Maldives installed core IT systems, and e-filing/e-payment was implemented and used by large businesses for sector goods and service tax, withholding tax, green tax, and remittance tax returns. Rwanda automated tax and customs administration, which facilitated an improvement in coordination between the tax and customs offices. In addition, Rwanda introduced electronic filing and implemented electronic registration which help to improve the registration process. In this context, IMF (2018a) also discusses the role of new technologies (that is, digitalization) to empower policymakers with quicker access to more reliable information and to enhance the tax base. It is important to stress, however, that IT alone is not enough. IT improvements will need to go hand in hand with advances in other administrative procedures to realize the full benefits (IMF 2015b).
5) Reform indirect taxes on excises for specific goods (e.g., cigarettes, alcoholic beverages, and motor fuels)—This could be an effective measure because such taxes can raise revenue rather quickly without fundamental changes to tax systems.5 Excises on these specific goods could work as corrective tools to alter individual behavior in a way that is socially desirable. For instance, Burkina Faso increased the excise tax for alcoholic beverages, as did Mauritania on tobacco.
Most country cases also deal with the challenge by reforming customs administration.
Improving compliance and strengthening the customs clearance process can help to boost tax revenue. For instance, Burkina Faso used the Automated System for Customs Data to connect five additional border posts to improve customs clearance procedures and limit fraud. Customs reforms were also implemented in other cases such as, The Gambia and Rwanda.
United States Agency International Development (USAID) (2018) conducts case studies of domestic revenue mobilization through tax policy and tax administration reforms for five different developing countries, including Afghanistan, Bosnia and Herzegovina, Nepal, the Philippines, and
5While selective excise and broad-base consumption taxes are efficient sources, it is important to ensure that countries have access to strong safety nets that adequately protect vulnerable from associated price increase. However, discussing this issue is beyond the scope of this paper.
10 Rwanda by using each profiled countries’ data and information during period 2001-2016. These five countries differ in essential ways, however, with respect to their resource mobilization experiences, they also have much in common. These case studies indicate the potential for rising revenue-to-GDP under the right circumstances, highlight core themes of how this was achieved in these developing countries and provide many salient lessons with implications for international support or aid for domestic revenue mobilization. Results of case studies from each of the profiled countries show considerable progress in terms of increasing government revenues. For example, Rwanda saw its revenue-to-GDP ratio rise from a few percentage points of GDP to almost 20 percent of GDP over the last two decades. In Nepal, budget revenues also increased quite rapidly, from 12 percent of GDP in 2007 to about 22 percent in 2016. Bosnia and Herzegovina, where essentially no revenues were being collected at the end of the civil war in 1995, today mobilizes close to 35 percent of GDP in public funds yearly. In Afghanistan, government revenues were less than one percent of GDP under the Taliban and today are around 12 percent. Even the Philippines, where there have been several challenges from domestic rent-seeking and continuing policy and administration weaknesses, revenues have begun to climb and a wide “sin tax” reform is viewed as a model of how tax revenue policy can simultaneously support revenue mobilization and social goals. Beside revenue mobilization, there some cases have led to improvements in the business environment and reduced corruption and reduced in the number of tax compliance costs.
2.3 Analytical tools and techniques for assessing domestic revenue mobilization
Le, Tuan Minh, Leif Jensen, G.P. Shukla, and Nataliya Biletska (2016) present five types of the following analytical tools and techniques to evaluate the revenue performance that are helpful for assessing major tax regimes in developing countries:
1) Profile analysis: revenue data are presented as amounts in local currency and as a share of GDP. This is the first and most used statistic in measuring revenue performance;
2) Trend analysis: revenue data are presented as levels, growth rate, and shares of GDP over a period of time and it indicates performance overtime;
3) Composition analysis: data are presented as a share of total revenue to illustrate the contribution of each type of tax revenue to total revenues. Tax expenditures—if readily available or conceivable to be estimated under the coverage of the Public Expenditure Reviews (PER)—would also be included here;
11 4) Tax revenue deviation analysis: it measures the deviation between actual and targeted revenue collections, and serves as an important entry point for drilled-down performance assessments of revenue agencies;
5) Efficiency and incidence analysis: the assessment covers to what extent taxation can distort investment, consumption and savings and looks into the redistribution impact under the various tax sources.
12 3.LAO ECONOMY AND PUBLIC FINANCE
3.1 Lao Economy
3.1.1 Real growth rate and GDP per capita
The environment of Lao economy has been improving since starting the economic reform process in 1986 under the New Economic Mechanism. The economy of Lao PDR has shifted, from a centralized and planned economy, toward an open, liberalized market-oriented system. Opened and developed policies toward global market have been put in place to promote and attract Foreign Direct Investment. These changes have made favorable conditions for further economic development for Lao PDR.
The Lao economic growth continued to remain strong. GDP growth rate sharply increased from 6.2 percent in 2003 to the highest recorded rate of around 9.2 percent in 2007. The marked increase in growth is driven by foreign investment inflows in the hydro-power and mining contributions and growing in exports from mining products. The expected sustained growth is contributed from agriculture, manufacturing and service sectors since rising foreign direct investment (FDI) in the agriculture, manufacturing, and the increasing trend in the tourism sector. As a consequence, the fiscal condition was also in a good position due to robust economic growth and the government revenue collection has increased as result from the broadened tax base in the new Tax Law and to the increased receipts from large investment projects and tourism (Figure 1).
In 2008, the growth rate, after the highest growth rate record in the previous year, has sharply decreased due to the impact of the global financial crisis in 2008 to 2009 on the Lao economy, however, the impact was not as large as initially expected. The economic growth remained at about 8 percent until 2013, driven by continued growth in hydro-power and mining sectors in parallel with the growth in the service, agriculture, and tourism sectors. As a result of the favorable growth, the government collection of revenue was enabled exceeding the targets approved by the National Assembly for continual years from 2006 to 2010. The expenditure side has also slightly increased over years to support the growing need for development and provision of public services and the growing demand on the main events hosted by Lao PDR. The operation of large projects in 2010, such as the Nam Theun 2 Hydro-power Project, also supported the economic performance and contributed to further development of the hydro-power potential until 2013.
13 The during 2013 to 2018, the GDP growth rate has been on a downward trend from 8 percent in 2013 to around 6.3 percent in 2018 mainly impacted by external and internal factors. A decline in commodity prices results in a fall in investment in the mining sector as a main element of the external factors. The impact of internal factors was due to the government of Lao PDR revising policies with relation to the mining sector, a temporary cessation granting new concessions on mining licenses, undertaking an assessment on previous and current implementation projects; and a cessation in granting a quota for logging and exporting timber and strict control on public investment projects. The government still faced a high budget deficit during those years since the government revenue has decreased resulting from the decrease in ODA. The real GDP growth per capita considerably increased from USD 405 in 2003 to USD 2.585 in 2018 in line with the continued economic growth since 2003.
GDP growth slowed down to 6.3 percent in 2018 from 6.8 percent in 2017, as both agricultural and industrial production declined mainly due to natural disasters. Heavy rainfalls from tropical storms resulted in flooding across the country, followed by the tragic collapse of Xe-Pian Xe-Namnoy dam. Notwithstanding these disruptions, inflation remained below 3 percent. Credit growth declined due to the economic slowdown, the legacy of non-performing loans, and fiscal tightening.
In 2019, the growth is estimated to slightly increase to 6.4 percent from 6.3 percent in 2018, supported by some new hydro-power projects and strong FDI from China in agriculture, manufacturing assembly and services, including the Kunming-Vientiane Railway Construction under the Belt and Road Initiative which started in early 2017.
14 Figure 1. Real Growth Rate and GDP per Capita
Source: Fiscal Policy and Law Department, Ministry of Finance of Lao PDR, and International Monetary Fund, World Economic Outlook Database, April 2019.
3.1.2 Population growth
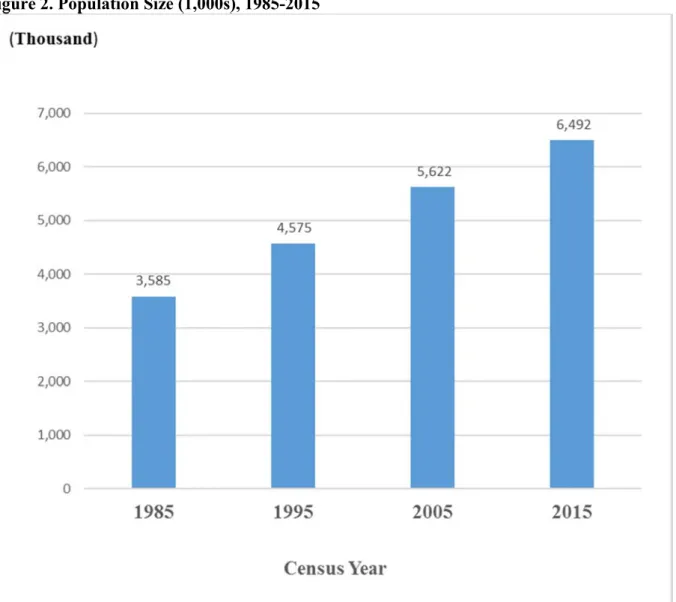
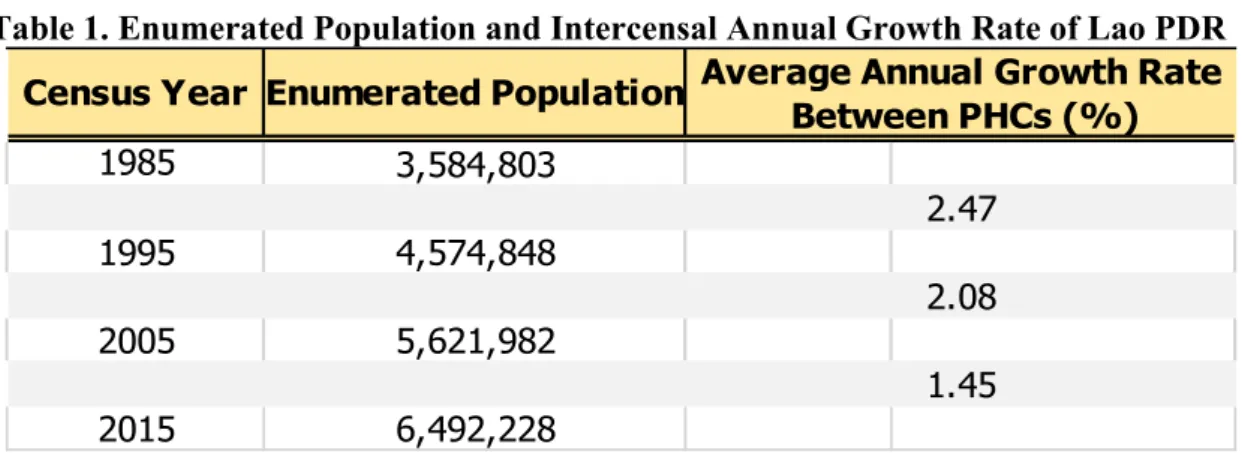
According to the 2015 Population and Housing Census (PHC), the total population of Lao PDR amounted to 6,492,228 as of March 1, 2015. As indicated in Figure 2 the population has nearly doubled from 3,584,8035 in 1985, when the first census was conducted. About one million people have been added to the country’s population every decade. At its current population, the country remains one of the smallest in Southeast Asia—slightly bigger than Singapore, but less than half of neighboring Cambodia.
Although the population has grown during the last three decades, the results of PHC population censuses show the rate of increase has been on a downward trend.6 During 1985-1995, the average population growth rate was 2.47 percent annually. In the following decades, the annual growth rate fell to 2.08 percent (1995-2005) and 1.45 percent (2005-2015), as shown in Table 1.
6Based on the assumption that the coverage of the census enumeration remained the same.
15 The declining growth rate could well be the result of falling birth rates. However, migration cannot be discounted as a major factor in this demographic dynamic, especially during the last one or two decades. It is widely believed that many Lao people move to neighboring countries for economic reasons, with Thailand a popular destination on account of similarities in language and culture.
Figure 2. Population Size (1,000s), 1985-2015
Source: Report Census and Survey, Lao Statistics Bureau, 2015
16 Table 1. Enumerated Population and Intercensal Annual Growth Rate of Lao PDR
Source: Report Census and Survey, Lao Statistics Bureau, 2015 Demographic and Social Characteristics.
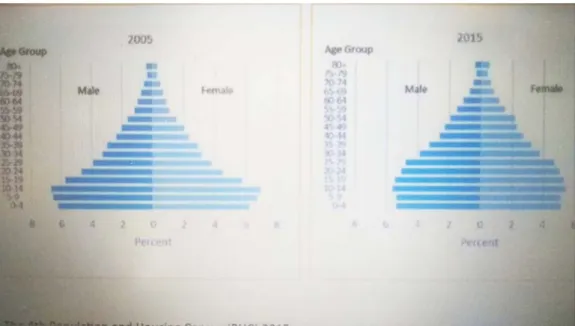
The sex ratio in Lao PDR was 101. This indicates there were 101 males for every 100 females.
The nation’s population is defined as being relatively young, with 32 percent of the population aged 0-14 years. The working age population of 15-64 years accounted for 64 percent, with 4 percent of the total population aged 65 years and above (Figure 2.2).
In 2015, the total dependency ratio was 57 persons, down from 77 in 2005, for every 100 persons of working age.
About 29 percent of the population age 15 and above had never married and 63 percent were currently married, while 3 percent were divorced/separated, 4 percent widowed and 1 percent in consensual union (Figure 2.3).
Figure 2.1. Age Pyramid of the Population, 2005-2015 1985
1995 2005 2015
2.08 1.45 3,584,803
4,574,848 5,621,982 6,492,228
Enumerated Population Average Annual Growth Rate Between PHCs (%) Census Year
2.47
17 Source: Report Census and Survey, Lao Statistics Bureau, 2015
Figure 2.2. Age Composition percent of the Population, 1995-2015
Source: Report Census and Survey, Lao Statistics Bureau, 2015 Figure 2.3. Married Status percent of the Population, 1995-2015
18 Source: Report Census and Survey, Lao Statistics Bureau, 2015
Economic Activity
Out of the total population aged 10 and above (figure 2.2), 68 percent were ‘usually employed,’
1.4 percent were reported to be ‘unemployed’ and 29 percent were outside the labor force. The unemployment rate was 2.1 percent, of which the rate (3.7 percent) was highest in urban areas and just 1.4 percent in rural areas with roads and 1 percent in rural areas without roads. The proportion of employed population aged 10 and over by main activity indicated that 10 percent worked for the Government, 0.9 percent for State Cooperatives and 7.5 percent for the private sector.
Job creation and employability
Since during the 1980s, 1990s, 2000s, and up to recently, the population growth has increased the working-age population, as well as improving and expanding of the formal sectors like industries, manufacturing and services. Before Lao PDR changing to a market economy, more than two-thirds of population relied on subsistence farms or agriculture due to industry, manufacturing and service sectors not being well-developed. After the Government of Laos (GoL) promotion policy for investment to support economic growth, especially from the agricultural sectors to expand to industry, manufacturing and service sectors. The working-age population in all these sectors has
19 increased year by year. This may result in more working-age population being employed, as well as their income being increased in parallel with economic growth.
3.2 Public finance
3.2.1 General budgetary operation
The state budget operation aimed to support the implementation of the National Socio-Economic Development Plan (NSEDP) and to boost stable economic growth and social development. To translate orientations, goals and policies introduced in each year, GoL issued decrees, detailed sectoral regulations and organized meetings to disseminate those legislations to sectors at national and sub-national levels to ensure effective and unified implementation for goal attainment.
In general, the total revenue performance was increased almost double from 12.6 percent of GDP in 2003 to 22.4 percent of GDP in 2012 in response to strong economic growth. Nevertheless, after 2012 the total revenue trend went down dramatically to 15.5 percent of GDP in 2018, due to decrease in grants and tax revenue-to-GDP ratio. Although the actual revenue increased, it was slower than actual economic growth. While the revenue mainly relies on goods import and domestic consumption, the slowdown of economic growth has directly posed an impact on revenue base. Thus, the economic growth rate was at 6.3 percent of GDP in 2018 mostly on account of tax exemption for large construction projects according to the Law on Investment Promotion. As a result, revenue from this section is not yet collectible (Figure 3).
The total expenditure-to-GDP increased sharply from 17.8 percent of GDP in 2003 to 26.1 percent of GDP in 2015, due to the capital expenditure trend compared to GDP which jumped from 7.8 percent in 2013 to 9.8 percent, and 10.8 percent in 2014 and 2015, respectively. However, the expenditure-to-GDP decreased from 2016 to 2018, reduced from 21.5 percent to 19.9 percent respectively, due to decrease in revenue-to-GDP. To manage the budget deficit at the rate approved by the National Assembly, GoL, thus, introduced fiscal consolidation, including an anti- extravagance measures and state budget expenditure savings leading to moderate reduction in expenditure-to-GDP ratio.
The fiscal deficit-to-GDP between 2003 and 2018 fluctuated. It dropped from 5.8 percent in 2003 to 1.8 percent in 2018. It then rose to 5.9 percent in 2015 and went down to 4.4 percent in 2018.
20 Figure 3. Budgetary operation percent to GDP for 2003-2018
Source: Fiscal Policy and Law Department, Ministry of Finance of Lao PDR, and International Monetary Fund, World Economic Outlook Database, April 2019.
21 Lao PDR has faced fiscal risks due to the huge general gross debt over the past years. Since 2003, government gross debt to GDP amounted to round 90 percent and started to sharply decline to 49 percent of GDP in 2011, and then began slightly increased to 63 percent of GDP in 2018, of which external debt stock amounted to more than half of that.
3.2.2 Budget revenue
The budget revenue includes domestic revenue and grants (Figure 4). In the past 15 years between 2001 to 2015, budget revenue management had steadily improved, and revenue collection targets, on average, were exceeded (102.3 percent of the planned targets). On average, government revenues amounted to around 21.5 percent of GDP, of which domestic revenue and external grants represented an average of around 17 percent and around 4.5 percent of GDP, respectively.
Domestic revenue has increased continuously from LAK 2,022 billion in 2001, equivalent to around 14.5 percent of GDP in 2001 to LAK 19,080 billion, equivalent to around 19.8 percent of GDP in 2015. Budget revenue management has improved gradually and targets approved by the National Assembly in the period of 2006-2010 were exceeded.
In 2016, total budget revenue amounted to LAK 21,141 billion, decreased by around 8.4 percent compared to the previous year due to the decrease of grants. Total budget revenue performed at 95.5 percent of the revised budget plan. The domestic revenue reached LAK 19,392 billion, increased by around 2 percent compared to the previous year, and performed at 97.9 percent of the revised budget plan, which was equivalent to around 17.8 percent of GDP. Grants amounted to LAK 1,749 billion, decreased by 62.1 percent compared to the previous year, and performed at 76.6 percent of the revised budget plan, and was equivalent to 1.4 percent of GDP.
In 2018, The total revenue gradually increased, after declining in 2016, to LAK 23,609 billion, almost the same amount as of 2015. However, grants amounted to LAK 1,514 billion, decreased by 13.4 percent, and 31.1 percent compared to 2016, 2017 respectively.
Figure 4. Trend in domestic revenue and grants in LAK Million, 2002-2018
22 Source: Fiscal Policy and Law Department, Ministry of Finance of Lao PDR
Figure 5. Trend in Budget Revenue as Percent of GDP from 2002-2018
Source: Fiscal Policy and Law Department, Ministry of Finance of Lao PDR
23 Domestic revenues include tax revenue and non-tax revenue. Tax revenues were the main source of the budget revenues accounted average at 12 percent of GDP since 2002 to 2018. Tax revenue- to-GDP overall showed an increasing pace from 2002 to 2013. It increased from 11.1 percent of GDP in 2002 to 14.1 percent in 2013. After a steady increase up to 2013, tax revenue gradually declined to 11.2 percent of GDP in 2018, and increased only 0.1 percent compared to 2002. Non- tax revenues mainly include administration charges, dividends, overflight rights, and on-lending interests. The non-tax revenues accounted average was only 2 percent of GDP between 2002 to 2018 (Figure 5).
3.2.3 Tax revenue
The tax revenue is collected from direct and indirect tax in Lao PDR. It is mainly from value-added tax (VAT), excise tax, profit tax, income tax, other fees, import duties, royalties, and other tax revenue, of which the main composition tax revenue was collected from VAT, excise tax, profit tax, and income tax (Figure 6) as the following:
VAT is an indirect tax collected on the goods consumption and services in Lao PDR at the rate of 10%. VAT replaced business turnover tax in 2010. VAT was the largest source of the tax revenue and accounted for 25.9 percent of tax revenue in 2010. VAT performance has increased year by year. In 2018,VAT reached LAK 5,201billion andaccounted to 30.4 percentof total tax revenue and 3.4 percent ofGDP. Of which, VAT from imported goods and services collected by customs sector was LAK 2,066 billion and equal to 39.7 percent of total VAT in 2018. The domestic VAT collected by the tax sector was LAK 3,135 billion, equal to 60.3 percent of total VAT in 2018.
Excise tax is an indirect tax levied on certain luxurious goods and services in different rates between 3 percent and 90 percent. It is the second source of tax revenue after VAT covering 28.1 percent of tax revenues in 2018. It has increased year by year. In 2002, it amounted to LAK 278 billion, which increased to LAK 1,749 billion in 2010, and constantly increased to LAK 4,799 billion in 2018, which increased by 12.8 percent from 2017 and was equal to 3.1 percent of GDP.
While the main source of excise tax in 2018 levied on imported goods and services amounted to LAK 2,968 billion which increased by 18.1 percent compared to last year or 61.8 percent of total excise taxes, collecting from domestic goods and services collection was LAK 1,831 billion, which increased by 6.5 percent or was equal to 38.2 percent of total excise taxes and was equal to 3.1 percent of GDP.
Profit tax (corporate income tax) is a direct tax collected from the profits of domestic and foreign companies. It is the third largest source of tax revenue after the VAT and excise tax. In
24 2002, profit tax was reported at LAK 283billion, was equal to 1.6 percent of GDP, and increased to 1.9 percent of GDP in 2015. The performance of profit tax in 2017 performed below the plan due to decrease in profit tax from the mining sector as larger taxpayers faced impacts of a price decline in the global market on their business operation and profit. Thus, they could not fulfil their tax obligations. In 2018 profit tax accounted to LAK 2,073 billion, equal to 1.4 percent of GDP, lower than of that in 2002. The profit tax revenue, compared to tax revenue, showed a fluctuated trend. It decreased from 14.4 percent in 2002 to 11.2 percent in 2003 and increased to 21.5 percent in 2009, and decreased to 10.7 percent in 2016, and then slightly increased to 12.1 percent in 2018.
The main reason for the increased period was a rise in profit tax from the mining and hydropower sectors.
Income tax is a direct tax collected from income, profits, and capital gains by individuals and businesses operating in Lao PDR. Income tax was the fourth largest revenue source after profit tax.
Income tax performed at around 0.7 percent of GDP during 2002 to 2012, and then increased to about 1 percent of GDP in the period of 2013 to 2018, and accounted to LAK 1,619 billion in 2018, equal to 9.5 percent of total tax revenue, and decreased by 2.3 percent compared to 2017 performance.
Figure 6. Tax revenue by items in percent of GDP from 2002-2018
25 Source: Fiscal Policy and Law Department, Ministry of Finance of Lao PDR
3.2.4 Comparison of Lao tax system with neighboring countries in the region
Comparison of the level and structure of Laos’ tax system with those of other countries in the region may indicate areas for reform, stated the IMF Technical Assistant Report for Lao PDR (2017). Since tax systems respond to national priorities and preferences, conformity with neighboring countries (China, Indonesia, Malaysia, Philippines, Thailand, and Vietnam) is not necessary for all taxes. However, due to the fact that countries within a region often share many economic and social characteristics, comparison of their tax structures can show areas of under or over exploitation of revenue potential. With comparison to other countries in the same region, Laos raises roughly similar overall levels of tax revenue, but it relies less heavily on direct taxes than on indirect taxes. Both CIT or profit tax and the personal income tax (PIT) underperform the regional average, while both VAT and excise overperform. Overall, indirect taxes tend to be easier to collect than direct taxes. Therefore, relying more on these instruments conserve administrative resources.
However, indirect taxes also tend to be more regressive than direct taxes, meaning that they tend to account for a larger share of lower-income taxpayers’ income. Developing the PIT and CIT as well as recurrent property taxes could therefore make Lao tax system more equitable, or progressive (Figure 6.1)
26 Figure 6.1. Lao Tax Structure vs Regional Average
Source: IMF, Technical Assistant Report for Lao PDR, 2017
The standard profit tax rate is 24 percent in Lao PDR, placing it in the middle of the range for the region (Figure 6.1.1). However, Lao PDR raises profit tax revenue less and has the lowest productivity compared to other countries in the region in terms of the ratio of revenue as a share of GDP to the profit tax rate. This suggests that profit tax in Lao PDR has a narrower than average base due to a small business sector and/or generous tax incentive. Though competition for foreign investment argues against any rise in the rate, there may be scope to improve productivity by broadening the base. Profit tax incentives, especially tax holidays should be reviewed for cost effectiveness and where possible reduced.
27 Figure 6.1.1 Profit Tax or Corporate Income Tax (CIT), Rates and Productivity
Source: IMF, Technical Assistant Report for Lao PDR, 2017
The personal income tax in Lao PDR yields just over one percent of GDP, placing it in the lower end of the range for region (Figure 6.1.2). Lao PDR has a dual income tax structure like many countries which combines a progressive tax on labor income and a low, flat tax on capital income.
Personal income tax on labor income, which tends to be far less mobile than capital income, is a prime source of progressivity in most countries’ tax systems. Lao PDR has a relatively low top rate (24 percent) and a very low threshold of only 6 percent of per capita GDP compared to other countries in the region. Raising both of these parameters toward the regional averages of 32 percent and 78 percent, respectively, would make the personal income tax more progressive and encourage formal labor market participation by low-income workers. Levying a low, flat tax on capital income eases administration and discourages capital flight. However, as different rates are imposed, some of which are very low, revenue could be augmented by unifying them at 10 percent.
28 Figure 6.1.2 Personal Income Tax (PIT), Rates and Productivity
Source: IMF, Technical Assistant Report for Lao PDR, 2017 3.2.5 Budget revenue collection and taxpayers
There are four departments (Chart 1) in charge of domestic revenue collection under the Ministry of Finance such as the Tax Department, Custom Department, State Asset Management Department, and the State-Owned Enterprises (SOEs) Management and Development, and Insurance Department. The revenue in percentage was collected by the Tax Department and accounted to LAK 10,183 billion, 49.5 percent of total domestic revenue and 7.2 percent of GDP. Custom duties, collected by the Custom Department, was LAK 6,293 billion, and accounted for 30.6 percent of total domestic revenue and 4.5 percent of GDP. State Asset Management collected revenue from state assets and was LAK 2,2297 billion, accounting for 10.9 percent of total domestic revenue and 1.6 percent of GDP. The SOEs Management and Development, and Insurance Department
29 collected LAK 1,803 billion, and accounted for 8.6 percent of total domestic revenue and 1.3 percent of GDP. Others accounted to LAK 89 billion (Figure 7 and Table 2).
The Tax Department supervises 17 provinces’ taxation, the Vientiane Capital, and 139 districts’
taxation throughout Lao PDR to process tax administration. In 2019, there are 2,492 tax officials to supervise, manage, and collect tax for the whole country, of with 130 in the Tax Department at the central level, and 2,362 at the local level (provincial and district taxation). The number of tax officials at the district level is almost double in comparison with those at the provincial level.
There are 103,774 taxpayers in Laos in 2019, with 8,303 taxpayers using bookkeeping properly, which is equal to 8 percent of total taxpayers, with large number of taxpayers paying lump-sum tax (62,275), which is almost 60 percent of total number of taxpayers. Only 6,674 taxpayers (around 6.5 percent of the total tax bases) are registered to the VAT system.
The Tax Department (headquarters) is in charge of around 408 taxpayers, which is equal to more than 60 percent of total tax revenue collection, and also, around 39 percent of total tax revenue collection is collected at the local level (Provinces and Districts).
30 Figure 7. Budget revenue collection by Department in 2017 (Billions of LAK)
Source: Fiscal Policy and Law Department, Ministry of Finance of Lao PDR
Table 2. Domestic revenue collection by revenue departments from January-December 2017
31 (Billions of LAK)
Source: Fiscal Policy and Law Department, Ministry of Finance of Lao PDR
Customs Tax State SOEs Other Total % to
asset Plan
Tax Revenue 6,261,954 9,265,981 1,390,503 0 0 16,918,437 96.1%
1. Profit Tax 30,771 1,948,890 0 0 0 1,979,660 98.9%
2. Income Tax 0 1,602,583 0 0 0 1,602,583 123.7%
3. Land Tax 0 113,149 0 0 0 113,149 78.0%
4. Business Licences 0 0 0 0 0 0
5. Minimum Tax 0 0 0 0 0 0 #DIV/0!
6. Turnover Tax 0 0 0 0 0 0 #DIV/0!
7. VAT 1,898,929 3,035,372 0 0 0 4,934,302 86.6%
8. Excise Taxes 2,513,761 1,720,202 0 0 0 4,233,963 95.0%
9. Import Duties 970,574 0 0 0 0 970,574 71.4%
10. Export Duties 28,989 0 0 0 0 28,989 64.4%
11. Registration Fees 0 0 74,463 0 0 74,463 106.4%
12. Other Fees 818,931 845,785 0 0 0 1,664,715 161.2%
13. Natural Resources Taxes 0 0 609,709 0 0 609,709 94.5%
14. Timber Royalties 0 0 335,451 0 0 335,451
15. Hydro-Power Royalties 0 0 370,880 0 0 370,880 117.0%
Nontax Revenues 31,305 916,917 847,152 1,776,816 88,853 3,661,043 101.3%
1. Leasing Fees 0 0 66,483 3,482 0 69,965 107.7%
2. Concessions 0 0 61,248 0 0 61,248 66.1%
3. Fines 31,305 35,728 16,167 101 0 83,302 124.6%
4. Administration Fees 0 881,189 0 262 0 881,451 55.2%
5. Dividends 0 0 0 934,088 0 934,088 211.3%
6. Interest 0 0 0 838,883 0 838,883 111.1%
7. Overflight Rights 0 0 656,950 0 0 656,950 112.6%
8. Forest Preservation and SME Funds 0 0 4,282 0 0 4,282 63.0%
9. Other (Microwave fee for State asset) 0 0 42,022 0 88,853 130,875
Total Tax and NonTax Revenues 6,293,259 10,182,898 2,237,654 1,776,816 88,853 20,579,480 97.0%
Asset Sale 0 0 59,459 954 0 60,413 52.7%
Capital Return 0 0 0 26,065 0 26,065 20.4%
Total Revenue with Asset sale 6,293,259 10,182,898 2,297,113 1,803,834 88,853 20,665,958 96.3%
Lao PDR: Government revenue January-Dec 2017 (EST)
32 Chart 1 Organization of the Ministry of Finance of Laos
Source: Ministry of Finance of Lao PDR
33 3.2.6 Current situation of tax policy and administration
After the Public Finance Development Strategy 2025 and Vision 2030 In 2017 was approved in July, 2017 by the Prime Minister, the Tax Strategic Development Plan 2018-2020 was approved by the Minister of Finance. The Tax Strategic Development Plan defined detailed tasks of tax administration in contributing to the aforementioned Public Finance Development Strategy to support its implementation to achieve Vision 2030, the Social-Economic Development Strategy 2025 and the 8th National Socio-Economic Development Plan (2016-2020).
To overarching goal of Vision 2030 and the Public Finance Development Strategy 2025 is to rectify the foundation for Public Finance Management, to ensure macro-economic sustainability, to explore the revenue potential to support the implementation of a National Socio-Economic Development Plan and to create favorable conditions for Lao PDR to get rid of the status of the Least Developed Country by 2020.
The Strategic Development Plan clearly spells out the direction and focus for the tasks, based on observations of lessons learnt in the past 5 years, of tax administration in the next three years in order to modernize tax administration and contribute to implement the Public Finance Development Strategy. This plan also identifies approaches to ensure the need for changes in the future of tax administration and ensure that the tax revenue collection will be increased at the level of 16-18 percent of GDP, as well as to support the macro-fiscal objectives of the Government.
The Tax Strategic Development Plan plays important role to formulate robust and required foundations in support of modernizing tax administration. The main mission aims to improve timely taxpayer services, fairly collect revenue and comply with laws to support budgetary revenue streams for national building and development and economic growth. It is expected that this Tax Strategic Development Plan will support the above-mentioned missions.
Tax Strategic Development Plan focuses on four development programs. The first program is to strengthen legal frameworks, the second is to improve revenue collection, the third is to modernize tax administration, and the fourth is to build staff and institutional capacity. In this plan, there are targeted tasks and prioritized subprograms, being implemented in the next few years. These development programs will be beneficial to various functions of tax administration.
34 4. ASSESSMENT OF DOMESTIC REVENUE MOBILIZATION IN LAO PDR
4.1 Assessment of tax revenue development from the previous reform measures
Lao PDR made good progress at economic reform through implementing its “New Economic Mechanism” in the first half of the 1990s. The average growth rate was 7-8 percent. However, from 1997 the reform momentum waned. Ambitious investment plans, especially irrigation projects to achieve rice self-sufficiency, were pushed through despite domestic resource constraints and the Asian crisis in 1998-1999 with inflation at its highest record of 130%.
The serious concerns were solved by tightening macroeconomic policy to quickly bring down inflation and stabilize the exchange rate and strengthen tax administration. Since then inflation fell sharply from 130% in mid-1999 to 9 percent in early 2001. Revenue grew by more and more as the targeted increase stemmed mainly from better reporting of timber royalties, and strong efforts to improve tax administration, specifically through developing more effective procedures for the large taxpayer unit, which was supported by IMF technical assistance. The 7th Lao Revolutionary Party Congress took place in 2001, and stressed the importance of economic development as the means for poverty reduction, and recognized the problems arising from attempting this through inflationary financing. With respect to high political commitment to the pace of policy implementation, the leadership continues to favor a carefully phased and market-based approach, to avoid major disruptions that could undermine the consensus for reform. On the fiscal side, keeping the overall deficit to an average of around 5 percent of GDP during 2001-2003, and protecting medium-term sustainability by relying mainly on external concessional financing, and avoiding domestic bank financing were enacted. In fiscal reform, fully implementing administration reforms, developing the system of LTUs, strengthening customs department, reducing tariff exemptions, and rationalizing the excise duty system, continuing to improve tax administration, better management of non-tax revenue sources, focusing on large taxpayers in preparation for the introduction of a VAT in 2003 (however, VAT law was approved in 2006 and come to enforce in 2010). From those reforms, revenue performance then gradually increased.
Tax revenue has almost been rising trend in Lao PDR from 9.1 percent of GDP in 2003 to reach 14.1 percent of GDP in 2013. Performance of tax revenue then slightly decreased to 13.9 percent, and 11.2% of GDP in 2015 and 2018, respectively. The declining growth was caused by the slowdown in global and regional economies, falling worldwide prices of mining products and oil,
35 which caused some mining companies to temporarily stop their gold production operations and reduce their production exports. The price of agricultural products, such coffee, rubber, also did not recover, hence, resulting in reduced tax collection. Furthermore, the slow economic growth in recent years and exemption and/or tax holidays under the Law on Investment Promotion has affected budget base. Consequently, tax revenue-to-GDP has been slightly decreased (Figure 8).
The 2006 revised Budget Law envisages the centralization of tax, customs and treasury administration and reform of inter-government fiscal relations.7 Some changes in revenue assignment were affected in 2007. As a result, tax revenue has increased by 1.4 percent of GDP from 10 percent of GDP in 2006 to 11.4 percent of GDP in 2007.
VAT replaced turnover tax and was enforced in 2010, leading to VAT increases of 0.5 percent of GDP compared to the previous year and became the largest source of tax revenue accounting for 25.9 percent of tax revenue in 2010. VAT steadily increased year by year to 4.5 percent of GDP in 2015 (resulting from policy reforms by revising VAT law in 2014), and increased to 1 percent of GDP compared to 2010, due to higher effective VAT on petroleum (by eliminating VAT exemption on oil imported), luxury goods, and vehicles, stricter enforcement of customs rules, and other efforts to strengthen tax administration and enhance compliance. Weak mining revenue to offset the gains from overall administrative efforts resulted in an expansionary revenue stance. Profit tax, which was the third largest revenue source, declined by 0.8 percent of GDP in 2010 compared to 2009 mainly due to the effect of global recession, and then slightly decreased year by year to around 1.4 percent of GPD in 2018, due to the economic slowdown and may be impacted from reducing general profit tax rate from 35 percent to 24 percent in 2015.
Lao PDR has revised VAT Law in 2014 and revised tax law in 2015 to rebuild fiscal buffers. A key reform objective of tax policy and administration was to boost the tax-to-GDP ratio to build space for priority spending and investment. Non-commodity revenue could be raised by broadening the tax base, including exemptions, and strengthening tax administration by taking some important measures to improve the valuation of imported vehicles, to calculate import taxes, eliminating
7 Taxes accruing fully to central government will now include import duties, turnover and excise taxes on imported goods, and mining taxes. Taxes accruing fully to local authorities will be limited to land and personal income tax. the turnover and excise taxes on domestic goods and the profit tax will be shared according to criteria mentioned in regulations.