I
The Role of New Technology in Advancing Ocean Biogeochemical Research
i
Tommy D. Dickey
University of California. Santa Barbara, California USA
Introduction
The rapid increase in atmospheric carbon dioxide (CO2) levels has stimulated a growing interest in understanding biogeochemical processes in the ocean and their interactions with the atmosphere. Interest- ingly, surface CO2 is also reported to be rising at the Joint Global Ocean Flux Study (JGOFS) ocean time series sites off Hawaii and Bermuda. Potential effects of rising CO~ levels include increases in global atmos- pheric and oceanic temperatures, melting of ice caps, sea-level rise and shifts in regional weather patterns, that lead to droughts and floods. One important ques- tion concerns our ability to discern natural versus anthropogenic contributions to this rise. Another ques- tion concerns the role the ocean plays in the cycling and variability of CO2. These and other unanswered questions stimulated the development and execution of JGOFS, a multidisciplinary and international pro- gram carried out between 1987 and 2001 by more than 20 nations. JGOFS was designed to study oceanic bio- geochemical cycles and their interaction with a chang- ing climate.
On millennial time scales, the ocean dictates the atmospheric concentration of CO2. There is an inverse gradient in Dissolved Inorganic Carbon (DIC) in the ocean, such that higher concentrations of DIC are found at greater depths. In contrast, the upper portion of the water column is in overall equilibrium with the atmosphere to first order. This gradient is maintained b y two carbon "pumps." The "solubility p u m p "
depends on the fact that cold water holds more CO2 than warm water; for example, the solubility of cold, deep water is about twice as great as that of near-sur- face equatorial water. As a consequence, the net effect of sinking surface waters through thermohaline circu- lation is to enrich deeper waters in carbon.
The second carbon pump is known as the "biolog- ical pump", and is the primary focus of this review of new technologies and observations (see Ducklow et al., this issue). The biological pump's process begins with phytoplankton living in the upper or euphotic layer of
the ocean. Phytoplankton take up CO2 and nutrients to form organic matter. Although much of this organic matter is metabolized and recycled in the surface waters, a significant portion (roughly 10% to 20% but varying greatly over space and time) sinks into the deep ocean before it is remineralized into an inorganic form via the metabolism of microorganisms. Currents and upwelling return CO2 to the surface of the ocean, but the overall effect of the biological pump is to trans- port carbon into the deep ocean.
The solubility and biological pumps have signifi- cant effects on atmospheric CO2 levels. The biological p u m p includes pathways of carbon export to the deep- er layers through Dissolved Organic Carbon (DOC) molecules (see Hansell and Carlson, this issue) and Particulate Organic Carbon (POC) matter (see Berelson, this issue). The determination of primary production in the upper ocean is a vital step in quantifying the for- mation of POC, which is then available for transport via the biological pump. The following paragraphs introduce some of the key concepts regarding primary production in relation to the biological pump, with a focus on its quantification using autonomous measure- ments from moorings and other platforms.
The biological pump is of interest to researchers studying bio-optics and upper-ocean physics as well as biogeochemistry. Primary productivity and phyto- plankton biomass depend on photosynthetic processes, which implicitly involve the availability of light (meas- ured as Photosynthetically Available Radiation or [PAR]) and nutrients such as nitrate, silicate, phos- phate, and iron. The spectral quality and intensity of light varies with depth and is important for specific phytoplankton species with special pigmentation or photoadaptive characteristics. Light exposure for indi- vidual organisms is affected by variation in physical conditions including mixed layer depth, turbulence and currents, as well as the incident solar radiation, all of which vary in time and space. An important feed- back concerns the modulation of the spectral light field
Oceanography • VoL ] 4 • No. 4/2001
I08
at various depths as phytoplankton concentrations and communities wax and wane. Fundamental measure- ments and models have been used to estimate primary production (e.g., Behrenfeld and Falkowski, 1997).
Such models often use measurements of chlorophyll a concentrations and PAR.
Primary production has been estimated for a vari- ety of geographical regions using remote sensing via instruments mounted on satellites. Primary produc- tion, P(z), as a function of depth, z, has also been esti- mated with relatively simple models using chlorophyll a, Chl(z), and PAR(z) data. In some cases, best esti- mates or measurements of the chlorophyll a specific light absorption coefficient for phytoplankton, a*(z), and the quantum yield for carbon fixation, ¢b(z), have been utilized as in the following empirical formulation:
P(z) = a*(z) ~(z) Chl(z) PAR(z) (1) One of the deficiencies of this method is that nei- ther a* nor • is constant in space or time because of changes in community structure and varying light and nutrient stresses.
This review focuses on some of the technological and observational advances achieved primarily during the JGOFS era that are improving our understanding of biogeochemical processes, pools and fluxes in the ocean. It is not comprehensive, but rather highlights a few examples (more references are available at http://www.opl.ucsb.edu/). The focus is on in situ observations, with a few references to complementary remote sensing data (see Yoder et al., this issue).
The Sampling Problem
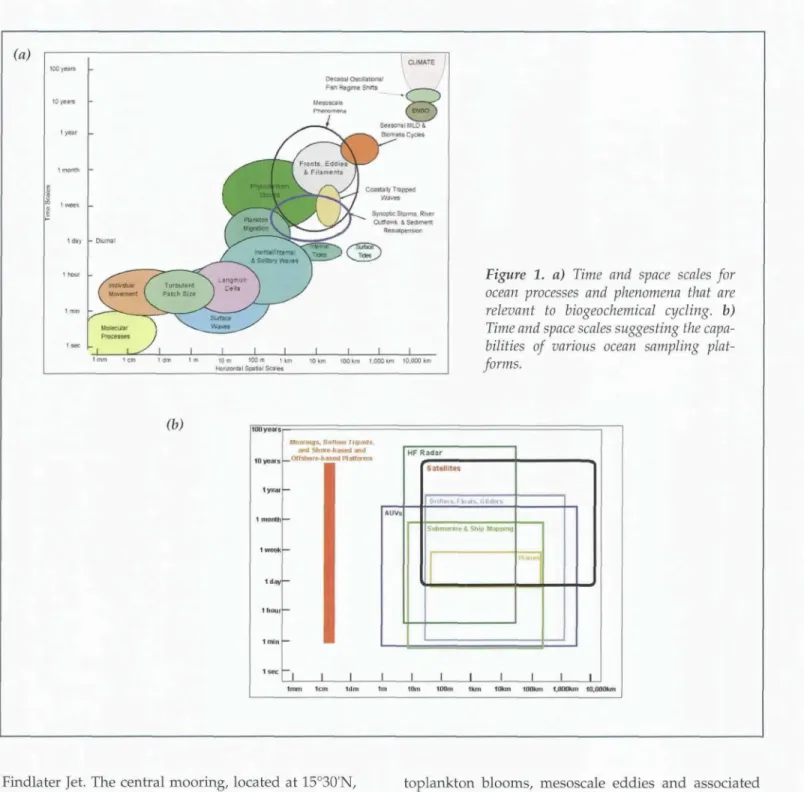
Oceanographers must obtain their data from an uncontrolled and often harsh environment. The limits of detection, precision and accuracy of ocean measure- ments should not be overlooked. It is critically impor- tant to obtain large volumes of data because of the vastness and complexity of the ocean and the impor- tance of a large range of time and space scales (Figure la) for answering many basic questions. The oceans are naturally dynamic, with large-amplitude periodic and episodic variability that confounds attempts to quanti- fy long-term trends and changes. Recent studies sug- gest that a few powerful episodic events can often be of far greater importance than small-amplitude, slower variations. JGOFS has characterized, quantified and improved our understanding of ocean processes that affect variability in carbon inventories and carbon flux- es. But insufficient data and undersampling still limit our ability to make further advances in understanding and modeling the biogeochemistry of the ocean. We must find ways to increase massively the variety and quantity of biogeochemical data.
Studies of ocean biogeochemistry necessarily rely heavily on interdisciplinary data sets because of the interdependence of physical, chemical, biological and geological processes. Ideally, the relevant data should
be collected simultaneously and span broad time and space scales to observe processes of interest (Figure la).
For global climate problems, this means sampling vari- ability that extends over 10 orders of magnitude in space, and even longer in time. Present capabilities for obtaining the necessary atmospheric and physical oceanographic data are relatively well advanced in contrast to those for biogeochemical data. This is not surprising, considering the greater complexity and non-conservative nature of the chemistry and biology of the ocean. Nonetheless, remarkable advances in bio- geochemical data collection are being made. New plat- forms are making it possible to measure certain biogeo- chemical, bio-optical, chemical and geological parameters on the same time and space scales as phys- ical ones (Figure lb). Figure 2 shows some examples of data collection platforms, such as moorings, towed vehicles (e.g. SeaSoar), drifters, floats, gliders, and Autonomous Underwater Vehicles (AUVs) now in operation.
Emer.clincl Observational Methods and Resulf v
One of the central goals of JGOFS has been to meas- ure and understand time-varying fluxes of carbon and associated biogenic elements. Regional studies are nec- essary to sample processes and to develop models for strategic oceanic biomes. All regions experience certain small- and mesoscale processes, especially over short time periods. But the effects of natural phenomena such as monsoons, equatorial longwaves, spring blooms, hurricanes and typhoons, deep convection, E1 Nifio-Southern Oscillation, climatic oscillations and the like vary greatly from one region to another. This sec- tion presents examples of applications of new tech- nologies in various regions studied by JGOFS, and pro- vides some highlight results.
JGOFS In The Arabian Sea
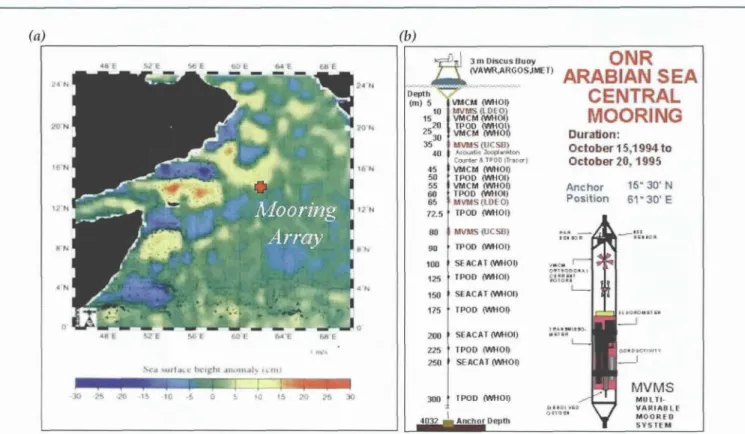
The U.S. JGOFS process studies were conducted in the Arabian Sea between 1994 and 1996 (Deep-Sea Research II, vols. 45110-11], 46[3-4, 8-9], 47[7-8]). Before JGOFS, we did not know whether the Arabian Sea absorbs or releases CO2 into the atmosphere on balance, and upper-ocean physical and biogeochemical respons- es to monsoonal forcing were undocumented. Arabian Sea field studies employed 1) underway shipboard sampling with Acoustic Doppler Current Profilers (ADCPs) and other instruments, 2) towed instrument systems such as SeaSoar, 3) multiple moorings, and 4) satellite observations for sea-surface temperature and altimetry. Data from satellite-mounted altimeters (Figure 3a), moorings, and towed instrument systems showed important mesoscale processes.
One of the novel aspects of the U.S. JGOFS Arabian Sea study was the deployment of five moorings with meteorological and physical instruments covering a square roughly 55 km on a side (Dickey et al., 1998a).
They were located near the axis of the atmospheric Oceanography • Vo{. 14 • No. 4/2001
I 0 9
(a)
O0 yc-ars
tO years
I year
1 m o t h
1 weg4¢
1 day
1 toux
1 mm
+:,
CLIMATE j10e~:~ai
O~u~lla~nn~Fm,'~ Reolme Stt~'~:e
1,11 10 m 100 m t km 10 km fOD km 1,000 ~ 10,1~ kJn Horizontal ~ z * f Sct ~e~
Figure 1. a) Time and space scales for ocean processes and phenomena that are relevant to biogeochemical cycling, b) Time and space scales suggesting the capa- bilities of various ocean sampling plat- forms.
(b)
~ Sk e o o r i ~ s , B a t t e n ~l~pad~,
~ d .~hme.b~ed and
~.afs O~fsho re-i~ a~.lt Pl m'f mTns
l y e , w
1,a !
I I I I I
1ram l c m 1din I m AUV~
N F R a d a r
~S ate41ff:el
r)Jpf~;~ ~lu,fl~ CHi{J~es
~Jtlmarme& Ship Ma41;.n~
I I I t I i I
11~11 lOOm 1kin 1 O k r a l ~ z ~ n I,IX]GIOll IO, O~lOkm
Findlater Jet. The central mooring, located at 15°30'N, 61°30'E, carried Multi-Variable Moored Systems (MVMS) at four depths in the upper 80 m of the ocean.
Each MVMS (Figure 3b) included a vector-measuring current meter, a thermistor for temperature, a beam transmissometer to measure particle variability as related to primary productivity and particulate organ- ic carbon, a strobe fluorometer to infer chlorophyll a concentrations, a scalar irradiance sensor for PAR, an upwelling radiance sensor (683 nm) for natural fluo- rescence, and a pulsed dissolved oxygen sensor.
An important attribute of the MVMS is that it con- currently measures bio-optical, chemical and physical parameters at sampling intervals of a few minutes for periods of up to 6 months. It thus expands the tempo- ral sampling to capture processes such as internal grav- ity waves, diel cycling, episodic wind events and phy-
toplankton blooms, mesoscale eddies and associated primary production, and seasonal mixed layer and bloom evolutions. Samples were taken every few min- utes with the central mooring's bio-optical, chemical, and physical instruments over an entire annual cycle (October 1994 through October 1995). The array of moorings was designed to quantify the spatial variabil- ity associated with the passage of mesoscale and other spatially varying features.
The physical mooring data show that the mixed layer deepens and shoals twice a year (Dickey et al., 1998a). The Northeast (NE) monsoon is characterized by steady northeasterly winds of moderate intensity (6 m/sec), surface cooling and convection, whereas the Southwest (SW) monsoon features strong, persistent southwesterly winds with greater intensity (up to 15 m/sec). The NE monsoon features deeper mixed layers
Oceanography • Vol. 14 • No. 4/2002
110
Figure 2. Ocean-observing plat- forms that can be used to obtain data describing physical and biogeochemical processes in the upper ocean. Many of these plat- forms have been used during the U.S. JGOFS time-series pro- grams and mooring deploy- ments near Bermuda and Hawaii.
(a) (b)
24 N
I I1~=1
, l ... ~- ]~
. •. ~ ] n| DISCUS Buoy
ONR
... ~ " ~ " " ~ ° ' ~ " ) ~ ... A R A B I A N S E A
°'=" "-~"
( . I ) 5 V~ICM ( V ~ O I )C E N T R A L
/~IV MS (LDEO 1510 V M C M L'Ylnl ~)1t
F P o o :)5 3g ! MWJI5 (UCS~)
CoJ~t~" & TI~QO ITr~r~o~
45 V M C M (WHOI) 50 I P O D ( ~ t t O I ) 55 V M C M tWHOI) 6O TPO0 (WHO'I) 6~ ~ MVI~S (LDE O}
72.5 IPOD W~t101) 80 M V I ~ (UC $I]) go TPOO ei~R4OI) 1190 .~X: AC AT (',tdHO I) 125 TPOD (k~-101) 150 SEACAT (Y~IOI) 175 TPOD (WHOI) 200 SEACAT (WHOI) 22'5 TPOD (Wt.IOI)
SE ACAT (WHO~
31110 tPOO (WHOI}
4932 ~m= At.thOr D e p ~
M O O R I N G
D u r a t i o n :
O c t o b e r 1 5 , 1 9 9 4 to O c t o b e r 20, 1 9 9 5 A n c h o r 15 ° 30' N Position 61" 30' E
ciR~r~l eOlORa
, n g ~ i N l ~ n Y _ _ f
MVMS
rAli°~ I;~ ~'~ m MIILTI- VARIABLE
~l~o wl y MQOREID
S Y S T E M
Figure 3. a) Map of the region studied during the U.S. JGOFS Arabian Sea process study. Sea-surface height anomaly data show considerable mesoscale variability in the region. The location of the mooring array used to collect physical, bio- optical and biogeochemical data is indicated by the red cross (after Dickey et al., 1998a). b) Diagrams of the central moor- ing deployed at 15°30'N, 61°30'E and a Multi-Variable Moored System (MVMS).
Oceanography • Vol. 14 • No. 4/2001
1 1 1
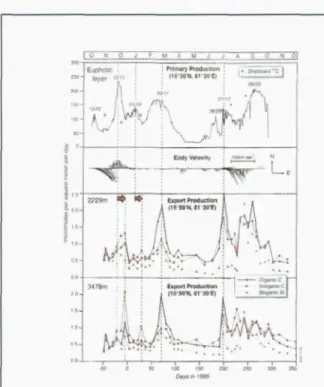
(110 m depth) than the SW monsoon (80 m depth) because of convective forcing. The MVMS data show that chlorophyll concentrations and primary produc- tion are correlated with the seasonal physical cycle associated with the NE and SW monsoons (Figure 4). A half-yearly cycle in chlorophyll a concentrations is an important feature with seasonal blooms that occur late in each monsoon season and into the respective inter- monsoon periods. The data show that depth-integrated chlorophyll a generally tracks the 1% light level.
One of the more interesting results of the Arabian Sea study was the discovery that mesoscale eddies play such an important role in the evolution of chloro- phyll a concentrations at the central mooring site (Figure 4). A sediment-trap mooring with serial sam- plers (see Berelson, this issue) at depths of 0.8, 2.2 and 3.5 km was located approximately 50 krn north of the central mooring site by Sus Honjo (WHOI). The com- bined MVMS measurements of derived primary pro- ductivity and sediment trap samples indicate that the timing and amplitudes of phytoplankton blooms asso- ciated with seasonal stratification and eddies were strongly correlated (Honjo and Weller, 1997). This cor- relation suggests relatively rapid (days to weeks) export of organic carbon to the deep ocean.
Complementary estimates of the shallow export flux of POC at 100 m were obtained in the Arabian Sea using the recently developed Thorium-234 method. The Thorium-234 data indicated that the single greatest fea- ture of the annual cycle was a basin-wide POC export peak that occurred during the late SW monsoon (Buesseler et al., 1998).
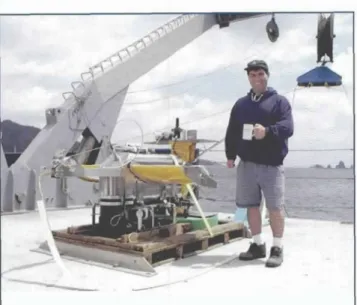
Spatial data were derived from underway ship transects with SeaSoar (Figure 5), ADCP transects and satellite sea-surface temperature and altimetry sensors.
SeaSoar, a towed undulating platform, was used by both British and U.S. oceanographers (Lee et al., 2000) in the Arabian Sea. In both cases, suites of physical, bio-optical, chemical and acoustical sensors were inter- faced to SeaSoar platforms. The bio-optical and chemi- cal sensors were similar to those deployed on the MVMS packages. In addition, acoustic backscatter data obtained from the ADCPs were utilized to estimate zooplankton biomass and their diel migrations. Multi- frequency acoustic sensors developed by Van Holliday were deployed aboard the SeaSoars to determine zoo- plankton distributions by size classes.
Spatial and temporal data obtained from these platforms indicate that the region is especially rich in mesoscale features whose origins are probably linked to westward-propagating Rossby waves and coastal filaments and jets that reach far offshore eastward from the Oman coast. Lee et al. (2000) carried out an objec- tive analysis using SeaSoar chlorophyll transect data during the fall intermonsoon of 1995. This analysis emphasizes the power of virtually continuous transect data for resolving patchiness; it also warns of the errors (e.g., aliasing) likely to result from reliance on standard ship-based sampling on coarse grids (>100 km).
I 0 N 0 ~ t~ ~ M J ~ ~
t t .... o , . . f~,
° " : I . . . I-I
~n ' ~ I ('l~,-m'M, II1:1~1~) • o e,,a~,,:-~l I
Figure 4. Time-series data from moored sensors in the Arabian Sea. Top panel: primary production obtained from Multi-Variable Moored System (MVMS) data and a model. Upper middle panel: currents at 35 m, indicating passages of eddies. Lower middle panel:
export production at 2229 m obtained from a sedi- ment-trap mooring, and Bottom panel: export pro- duction at 3478 m from the same sediment-trap moor- ing. (Figure after Honjo and Weller, 1997)
Previous papers describing high-frequency bio-optical data sets have made the same point in the temporal domain (e.g. Dicke~ 1991).
Innovations of Two North Atlantic Experiments
The international JGOFS North Atlantic Bloom Experiment (NABE) was carried out in 1989 with a cen- tral objective of studying the spring phytoplankton bloom and its associated biogeochemical effects in the North Atlantic, one of the largest transient signals on earth (Deep-Sea Research II, 4011-2], 1993). NABE obser- vations were carried out at seven primary locations between about 18°N and 72°N, roughly along 20°W. A second experiment, The Marine Light in the Mixed Layer (MLML) study, was motivated by the desire to improve the understanding of upper ocean bio-optical variability and bioluminescence as affected by physical forcing at high latitudes (Dickey et al., 1994). MLML was conducted primarily at a site south of Iceland at 59°N, 21°W. Although MLML was not part of NABE, the field studies had several objectives in common and overlapped in time in the spring of 1989. One of the methodological innovations of the NABE and MLML studies was the use of diverse sampling platforms, including ships, aircraft equipped with Light Detection
Oceanography • VoL 14 • No. 4/2001
112
Figure 5. Photograph of a SeaSoar used during JGOFS studies in the Arabian Sea (courtesy of Burr Jones).
and Ranging (LIDAR), drifting sediment traps, a satel- lite with an altimeter and a multidisciplinary mooring similar to one described above. The collective data sets and models were used to characterize and analyze the temporal and spatial complexities of the spring bloom.
NABE data show that mesoscale eddies and mixed layer variability are important for phytoplankton blooms and ecosystem dynamics (see McGillicuddy, this issue; Dickey et al., 1994). Refinement of tech- niques for measuring CO2 at sea, and seasonal and spa- tial changes in the partial pressure of CO2 during NABE made it possible to demonstrate links between variability in CO2 levels and the dynamics of the spring bloom in the North Atlantic (see Feely et al., this issue).
Similar advances in seagoing instrumentation were made in the measurement of DOC (see Hansell and Carlson, this issue). In addition, microbial activities were found to be important during the blooms.
Moorings at 34°N and 47°N (Sus Honjo) were used to deploy deep sediment traps that captured variability in particle fluxes at various depths.
The MLML field program, carried out from April to June, 1989, and from May to September, 1991, uti- lized MVMS packages on moorings to obtain high-res- olution data over time at eight depths (Dickey et al., 1994). Although the high-latitude location with its high winds and large waves presented a major technologi- cal challenge for moored observations, excellent bio- optical and physical time-series data were obtained.
The abrupt onset of spring stratification with shoaling of the mixed layer was dramatic (from 550 m to 50 m within 5 days), illustrating the importance of high tem- poral resolution sampling with moorings. The moored instruments also captured the onset of a phytoplank- ton bloom, apparently associated with modest near- surface stratification, prior to the major springtime shoaling of the mixed layer and the seasonal spring bloom. An increase in near-surface temperature of
0.2°C accompanied the phytoplankton increase, a change suggested by model studies but previously unobserved because of sampling limitations.
In the MLML field program, the mooring observa- tions were complemented by shipboard profiles and ship tow-yo sections, LIDAR measurements from P-3 aircraft and satellite sea-surface temperature data (Dickey et al., 1994). These data provided context for the mooring data as well as information on horizontal features and scales of variability. For example, the LIDAR data showed that there were patches of high concentrations of chlorophyll a with horizontal scales on the order of 30 km. The NABE and MLML programs represent an early attempt to develop observational strategies for fully three-dimensional, interdisciplinary time-series programs, one of the themes of this review.
The Equatorial Pacific
The JGOFS equatorial Pacific process study took place in 1992, and related studies preceded and fol- lowed the main field program (Deep-Sea Research II, 1995: 42[2-3], 1996: 43[4-6], 1997: 4419-10]). Field exper- iments were conducted in the central and eastern Pacific from 95°W to 170°W between 10°N and 10°S.
The equatorial Pacific is affected by a great variety of physical and climatological processes, including E1 Nifio-Southern Oscillation (ENSO) cycles. It also plays an important role in the global carbon cycle. Estimates suggest that the region supplies roughly one gigaton of carbon (as CO2) to the atmosphere each year, primarily due to the upwelling of carbon-rich deep water along the equator. The equatorial Pacific is also a High Nutrient-Low Chlorophyll (HNLC) region; its produc- tivity and carbon fluxes are small relative to the supply of nutrients.
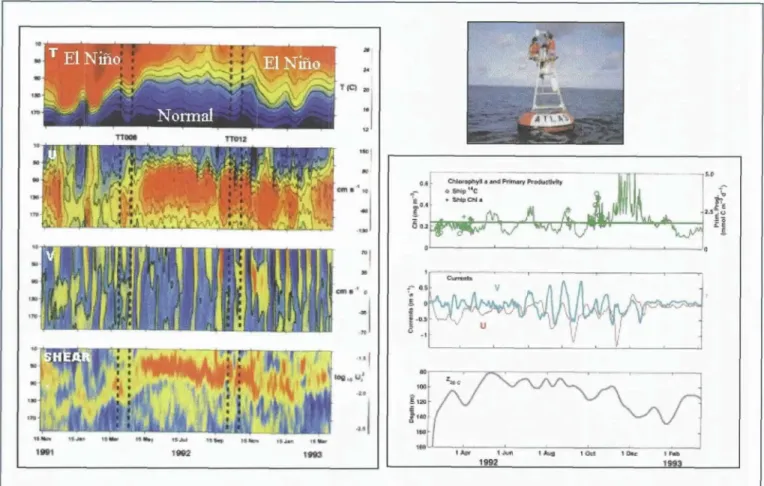
The physical dynamics of the equatorial Pacific have become increasingly well understood over the past two decades, largely due to measurements made by the Tropical Atmosphere Ocean (TAO) mooring array. However, understanding of biological and opti- cal variability has been limited because few dedicated ship-based experiments could be performed in such a remote region. In particular, typically only a few bio- logical observations of chlorophyll and primary pro- ductivity were made each year prior to JGOFS; hence, these were our only basis for annual estimates of chlorophyll and primary production for the expansive Pacific equatorial waveguide. With this motivation, MVMS packages were installed on the TAO physical mooring at 0 °, 140°W for an 18-month period during 1992 and 1993 (Foley et al., 1997). The timing of our sampling period was most opportune as the observa- tions spanned both E1 Nifio and "normal" phases of the ENSO cycle. During the E1 Nifio phase, the mixed layer, the thermocline and a very weak Equatorial Undercurrent (EUC) were deep, at times in excess of 150 m. Kelvin waves with a roughly 60-day period propagated eastward past the site, accompanied by depressions of the thermocline. Time-series measure-
Oceanography * VoL 14 * No. 4/2001
113
ments of key physical and bio-optical parameters obtained from instruments deployed on the mooring (0 °, 140°W) are shown in Figure 6. Light levels were high, but nutrients, including iron, were only elevated in deep waters. As a result, chlorophyll a concentrations in the upper layer were low (less than 0.2 mg m-3).
As "normal" conditions returned to the region, Kelvin waves ceased. The thermocline and a strong EUC shoaled, allowing transport of nutrients into the euphotic zone. Westward propagating Tropical Instability Waves (TIW) with periods of roughly 20 days also contributed to large vertical upwelling cycles. TIWs are easily seen in the meridional current records, and appear to be manifest in the time-series data with chlorophyll a values double and at times triple those observed during the E1 Nifio period (Figure 6). Importantl)6 strong, though highly complex, cou- pling is evident between the physical processes (El Nifio, Kelvin waves and TIWs) and the phytoplankton biomass and primary productivity (here roughly pro- portional to chlorophyll a) of the equatorial Pacific.
Passages of TIWs may be envisioned as natural iron enrichment experiments.
Newly developed bio-optical drifters released at the equatorial mooring site provided spatial data as they drifted poleward, enabling estimates of net phyto- plankton growth rates. Ship measurements benefited from improved measurement systems for pCO2 as well as from u n d e r w a y shipboard ADCP data sets.
Estimates of export flux of POC were based on the thorium-234 method described earlier. Results of the thorium-234 study indicate considerable spatial and temporal variability in export of organic carbon, which was highest at the equator. They also show that a relatively low percentage of total production (<5-10%) is exported via sinking particles. The combination of the instrumented TAO mooring array with JGOFS shipboard sampling and sediment traps provided a relatively comprehensive, though coarse, three- dimensional biogeochemical time-series data set for the region.
i l :
Tict
"1
i i . i ~ 1 4 t t
-I
: @I 171111+IIIIII .:'
' +
.F."m_~.+;-IK;,..---i-; i; ri r~, L:r~-r~ -,.t
~,~~++~~_.:J+~+ i l ' r I "
+ " . . . .+ ~ + , +i. , .,..I
, i i i i i , , , 11..1,~. , + i . +,+ i + ~ i $ ~ , , i I ~ , u l m~,, + l . a , , . , i i l , ~
~}~--> : ~ ~ : :+ .-+< .-+.,~,+,~
f | + m ' 4 c ^ I I i l l i ; -~
• o , i " ~ = ' , t , ..ML¼ I p ,
. . . : d
| . ~ .
+ -
"1 . . . . v , V , , "
':h . , , j
1 1 ! ~ 1 1
Figure 6. Data collected during the U.S. JGOFS Equatorial Pacific Process Study from a mooring at 0 °, 140°W (Foley et al., 1997). Left, top to bottom: Time versus depth contour plots of temperature, zonal currents, meridional currents and current shear. Black vertical dashed lines indicate periods of concurrent shipboard sampling at the site. Right, top to bottom: ATLAS mooring, chlorophyll a and derived primary productivity at 10 m, zonal (red) and meridional (blue) currents at 10 m, and depth of the 20°C isotherm, which deepens during El Niffo periods.
Oceanography • Vol. 14 • No. 4/2001 ...
114
The Southern Ocean
The Southern Ocean is generally thought to be one of the most important and sensitive oceanic regions in regard to the carbon budget and climate in general.
The Southern Ocean was targeted for study by the JGOFS program because it is likely an ocean of global- ly significant carbon fluxes, yet it remains a region about which the factors regulating carbon fluxes are less well known (data sparse) than is the case for more readily accessible oceans. Major questions concerning the biogeochemistry of the Southern Ocean remain unanswered: 1) Does the Southern Ocean act as a net source or sink for atmospheric CO2, 2) What is (are) the limiting factor(s) for primary productivity (note that the Southern Ocean is a high nutrientqow chlorophyll (HNLC) region), and 3) How does biological variabili- ty affect the upper ocean's heat budget?
The JGOFS Southern Ocean field studies used many of the sampling platforms and instruments described above; thus only a couple of new sampling methodologies are noted here. The long-awaited Sea Viewing Wide Field-of-View (SeaWiFS) ocean-color instrument, launched in August 1997, provided large- scale information on surface pigments for JGOFS Southern Ocean cruises (see Yoder et al., this issue).
Recognizing the importance of capturing migrating frontal features and mesoscale variability, Mark Abbott and his colleagues (2000) deployed an array of 12 moorings, spaced 30 km apart, and equipped with physical and bio-optical sensors in the Antarctic Polar Frontal Zone (APFZ) from November 1997 to March 1998. These moorings differed from others described above in that they were subsurface, relatively light- weight, carried fewer sensors and were relatively easy to deploy and recover under adverse conditions. The mooring array captured a strong spring bloom begin- ning in December 1997.
The mooring data, together with data sets collect- ed aboard ships, suggest that light levels limit phyto- plankton populations initially because of deep mixing.
Then silicate concentrations or zooplankton grazing become limiting factors, followed finally by iron limi- tation. The spring bloom at the polar front in 1997-98 lasted only a few weeks, which supports the argument for the fast sampling rates possible with autonomous moored instruments. The mooring array proved important in a region where both temporal and spatial scales are small.
Bermuda Testbed Mooring and HALE-ALOHA Mooring Programs
The JGOFS Bermuda Atlantic Time-series Study (BATS) and the Hawaii Ocean Time-series (HOT) study, both launched in 1988, have been used to observe, quantify and model temporal changes in the biogeochemical and ecological properties of the sub- tropical oligotrophic gyres of the North Atlantic and the North Pacific (see Karl et al., this issue; Deep Sea Research II, 1996: 43[2-3]; 2001: 48[8-9]). Both of these
programs have relied primarily on shipboard sampling at two- to four-week or longer intervals. But this mode of observation cannot capture important phenomena with time scales from minutes to a month. For this rea- son, investigators established high-frequency, long- term, autonomous moored sampling programs at both sites. The first was the Bermuda Testbed Mooring (BTM); Tommy Dickey and Dan Frye (WHOI), shown in Figure 7, launched in 1994 at the BATS site (Dickey et al., 1998b; Dickey et al., 2001). A similar mooring, HALE-ALOHA, was established in 1996 at the HOT site (Letelier et al., 2000) by David Karl (University of Hawaii) and colleagues.
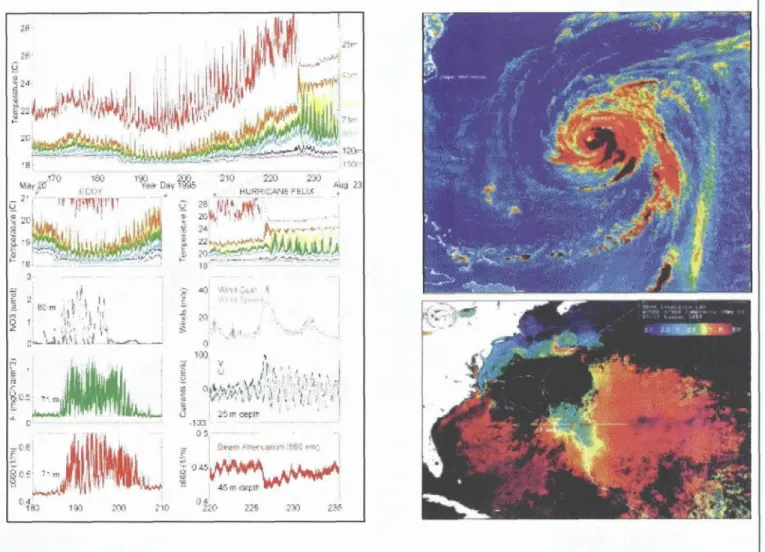
These two mooring efforts have clearly demon- strated the importance of events and processes that cannot be captured or resolved by bi-weekly or less fre- quent shipboard sampling. These events and processes include mesoscale eddies, storms, hurricanes, dust deposition events, rapid shoaling of the mixed layer and transient phytoplankton blooms, inertial oscilla- tions, diel and shorter-term variability in phytoplank- ton and bio-optical properties, and internal gravity waves. Data from both the BTM and the HALE- ALOHA mooring have documented passages of mesoscale features with high nutrient and phytoplank- ton concentrations. The BTM time-series data shown in Figure 8 highlight both the passage of a major eddy and its effects on nutrients and phytoplankton biomass in July 1995 and the upper-ocean response to Hurricane Felix, which passed over the BTM in August 1995.
The original aim of the BTM program was to create an opportunity for long-term testing of multidiscipli- nary autonomous sensors and systems. The BATS site was chosen because of the regular BATS shipboard sampling program and the long-term sediment trap data collected nearby by Werner Deuser and Maureen Conte (WHOI) since 1978. The BTM is used to collect meteorological, physical and bio-optical data every few minutes, including temperature, conductivity, currents, PAR and chlorophyll fluorescence. A complementary project, Ocean-Systems for Chemical, Optical and Physical Experiments (O-SCOPE), has used the BTM to test several proto-type chemical and optical sensors.
Among the systems being tested, as part of the BTM program are newly developed moored bio-optical sensors that include several spectral absorption and attenuation meters (9 to 100 wavelengths over the visi- ble spectrum) for measuring inherent optical proper- ties. Also being tested are spectral irradiance and radi- ance radiometers (Figure 9a) for measuring apparent optical properties at several wavelengths matched to those sampled by the SeaWiFS ocean color instrument.
Derived data resulting from the BTM program include chlorophyll a concentrations, spectral radiance and irradiance ratios, spectral diffuse attenuation coef- ficients and spectral water-leaving radiance. The latter data have been used for validation and algoritt'u'n development for the SeaWiFS instrument. The BTM data are virtually continuous and provide a large num- Oceonogrophy • VoL 14 • No. 4/2001
115
U C S B O P Z
Bermuda Testbed MooNlg
A R ~ and RF
~la lo'a I ~ ~ I~AOIO~IETER
IHL ~nln~ jI~F_ ' , ~ ' UC~O H Elf ~: ( ~f an d ~ h ~ Letup,
~ _ winds,humidi/v~ P, ndr ps~s$~rc~ilmc~
14m 19m 2&m
$5m 46m S2m SSm
76m 84m
ZII2rn 211m
UC SB MOBS IJCSUBIOPS WIIOl TS-SID C14 UCSB MOA$
UCSB MIIMS MIT WATER SAMPLER MIT WATER SAMPLER
UCSB M L I M S
MBFIFII NITRATE A N A L Y Z E R
M B A R I NITRATE A N A L Y Z E R IJESB AI)CP
d•i•
GII$f. 111111|ItN;1t,05 Olll~l IIElilb~l']c IIELflI~$EI
Figure 7. Upper left: Bermuda Testbed Mooring (BTM) surface buoy during deployment. Lower left: Osmoanalyzer for measuring nitrate, developed by Hans Jannasch and colleagues. Right: Schematic diagram/or a BTM deployment.
ber of match-ups. The radiometric data are especially important because satellite-based measurements of ocean color are limited to the uppermost ocean layer (roughly one optical depth), and viewing is limited by cloud coven In addition, data have been collected by other new optical systems tested at the BTM; these sys- tems include a spectral volume scattering function instrument and a spectral fluorometer (6 excitation and 16 emission wavelengths).
One of the major limitations for moored optical systems has been biofouling. Recently copper shutter systems and tubing for p u m p e d systems have been engineered and tested. Results indicate that the dura- tion of deployments can be extended to at least six months (as opposed to three to four months) in olig- otrophic waters.
Several new chemical systems and sensors have been deployed on the BTM (Dickey et al., 1998b;
Dickey et al., 2001). An in situ autonomous sampling colorimetric system, Osmoanalyzer (Figure 7; Hans Jannisch, MBARI), has collected time-series data on nitrate and nitrite concentrations with a 10- or 15- minute sampling interval. The Osmoanalyzer utilizes
osmotic pumps that propel both sample and reagent fluids through a minia~re flow-injection manifold. Our understanding of the biogeochemistry of eddies, partic- ularly nitrate injection and subsequent phytoplankton growth, has been improved by data from the Osmoanalyzer as well as the bio-optical and physical data collected with instntments on the BTM (Figure 8).
Four different groups have tested autonomous pCO2 sampling systems at the BTM (Tokar and Dickey, 2000; Varney, 2000). One of these (called CARIOCA;
Liliane Merlirat, University of Paris), which involves a separate buoy tethered to the BTM, has shown variabil- ity in pCO2 on diel and synoptic time scales. A system for measuring the difference between atmospheric and surface-water pCO2 levels (Gernot Friederich) was test- ed during a BTM deployment in the summer and fall of 2000. Resulting time-series data suggest that the usual summertime supersaturation of surface-water CO2 was interrupted during most of July when pCO2 values returned to near atmospheric levels. During autumn, temperature and pCO2 decreased in concert. Dissolved oxygen sensors have also been tested.
Investigators have deployed a new Moored In situ
Oceanography • VoL 14 • No. 4/2001
116
~, " . .'
: lq
... ".'. "~i ,,:
; a : I i ! . . . . : , ~ -
: :" "
'~',I!~'!I'P
... .. :" :~:'ii~~~'i
............. - : : . . . ' I ~ ' - - " : . . . " : . . , T Y Y " ~
-~, , ,~ ::
,~, . .
r , : . . .
gc,.e: " ' " I '
~')i~ -. .
0:
t , i | , j ,~ ' j
v . ~ ~ ! , , d i ~ : ~ t ~ : , : - r~
J ".>'~ m oL-i:lt, ' ' i
. I . J ' : 3 . . . . .
0 , 5 . . .
' 0 e ~ . , : . . , ~ , . ~ , r J . :~.~:~ ,.~,:
0