Print edition : ISSN 2188-3602 Received : Jan. 26, 2014 Accepted : Mar. 4, 2014 Published online : Mar. 31, 2014
Glycative Stress Research 2014; 1 (1): 14-24 (c) Society for Glycation Stress Research
Yoshikazu Yonei, MD, PhD Anti-Aging Medical Research Center, Graduate School of Life and
Original Artcle
Masayuki Yagi, Akihiko Shimoide, Umenoi Hamada, Junko Naito, Masamitsu Ichihashi, Yoshikazu Yonei
Anti-Aging Research Center/Glycation Stress Research Center, Graduate School of Life and Medical Sciences, Doshisha University
KEY WORDS: Glycation stress, vinegar beverage, advanced glycation end products (AGEs), Nε -(carboxymethyl) lysine (CML), tape stripping technique
Abstract
Objective: We evaluated the inhibitory effect of the long-term consumption of a vinegar beverage containing indigestible dextrin and a mixed herbal extract (the test diet) on the production of advanced glycation end products (AGEs) in a placebo-controlled, randomized, double-blind, parallel-group comparison study design.
Methods: A total of 109 post-menopausal women previously diagnosed with an increased blood glucose or hemoglobin A1c (HbA1c) level, with an abdominal circumference of 90 cm or more, were subjected to an oral rice ingestion test followed by measurement of fl uorescence intensity of skin AGEs. Among them, 23 women (mean age 57.4 ± 3.9) with high levels of 60-minute postprandial blood glucose and skin AGE deposition were enrolled and assigned to either the test group (n = 11) or the control group (n =11). The subjects in the test group took 240 mL of the test diet (corresponding to 840 mg/day of acetic acid, 5 g /day of indigestible dextrin, and 100 mg/day of mixed herbal extract) daily divided into two equal doses taken before breakfast and dinner for a period of 8 consecutive weeks. Blood biochemistry parameters and glycation stress markers were measured before and at 8 and 12 weeks after the start of the test diet. The study was approved by an ethical review committee.
Results: A significant decrease in serum aspartate transaminase (AST/GOT) level in the test group compared to control was observed after 8 weeks of diet intake (p < 0.05). With regard to glycation stress markers, no signifi cant differences were observed between groups in the blood concentrations of fasting glucose, HbA1c, insulin, 3-deoxyglucosone (3DG), Nε-(carboxymethyl) lysine (CML) or pentosidine. No significant intergroup difference was observed in the fluorescence intensity of skin AGE as measured with an AGE Reader. In the subclass analysis of the subjects with high postprandial blood glucose (>150 mg/dL at 60 minutes), CML content of the skin stratum corneum as determined by the tape stripping method was signifi cantly decreased in the test group compared to control after 8 weeks of diet intake (p < 0.05). No serious adverse event was observed during the study period.
Conclusion: The results of the present study suggest that the intake of the test diet causes a reduction in CML content in the skin stratum corneum, a marker of glycation stress, in people with relatively high glycation stress. Combined with the demonstrated safety of the test diet, this observation indicates a potential for the use of the test diet as a functional food.
Evaluation of the anti-glycation effect and the safety of a vinegar beverage containing indigestible dextrin and a mixed herbal extract
--- A placebo-controlled, double-blind study ---
Introduction
Glycation stress is a series of reactions triggered when reducing sugars, organic acids or aldehydes react with protein- derived amino acids to produce post-translational modifi cation products, such as carbonyl compounds, succinyl compounds, racemic compounds, or advanced glycation end products (AGEs). Subsequent accumulation of such compounds causes stress to cells and tissues and leads to the functional decline of proteins which can bind to receptors for AGEs, inducing or aggravating infl ammation via cytokine production
1-3). Glycation stress is considered a major risk factor for accelerated aging.
Although diabetes, including the prediabetic state, is a major predisposing factor for glycation stress, glycation can also occur in the absence of diabetes. This type of glycation is
referred to as normoglycemic glycation or non-hyperglycemic glycation and is caused most commonly by postprandial hyperglycemia or, less commonly, by hypertriglyceridemia, uremic toxin, excessive alcohol intake or excessive fructose intake. Smoking and a lack of sleep are also known to promote AGE production
4). These factors should be eliminated to reduce glycation stress.
Recent studies have identified and evaluated various substances that inhibit the production of AGEs, promote the degradation of AGEs or antagonize receptors for AGEs.
Previously, we have evaluated the in vitro inhibitory effect of
roman chamomile (Anthemis nobilis), doku-dami (Houttuynia
cordata), hawthorn (Crataegus laevigata (C. oxyacantha)),
grape leaf (Vitis vinifera), and a mixture of these herbs
5),
Chrysanthemum morifolium
6,7), Sasa senanensis
8), and extracts
AG herb mix
TM, a functional food ingredient developed and marketed by ARKRAY Inc. (Kyoto, Japan), is a mixture of powdered hot water extracts of herbs belonging to different taxonomic groups, including Houttuynia cordata, Crataegus laevigata (C.oxyacantha), Anthemis nobilis, and Vitis vinifera.
This herbal extract and its formulated product have been shown to inhibit AGE production in vitro, both in a diabetes model in rats and in randomized controlled trials (RCTs) in humans
10-13). The herbal extract is considered safe as it is composed of raw materials that have long been consumed as food ingredients, and because it is produced with the same extraction method as used for herb tea. Anthemis nobilis has been shown to cause an allergic reaction in people with multiple allergies, and Houttuynia cordata, used as a folk medicine, has been reported to cause photosensitivity and hyponatremia when consumed in large amounts for long periods of time. However, the daily intake of the mixed herbal extract contained in the test diet used in this study was only 100 mg, thus it was not likely to cause any problems. Moreover, the safety of the mixed herbal extract has been demonstrated in various studies, including a rec-assay (lethal sensitivity test), a reverse mutation test, an acute oral toxicity study using male and female rats, and an overdose test in humans (3,000 mg/day, corresponding to 5 times the regular dose, for 4 weeks).
Fibersol-2H was developed and marketed by Matsutani Chemical Industry (Hyogo, Itami, Japan). The compound affects the control of hyperglycemia after a meal and is used as of various types of healthy tea
9)on AGE production. We have
also performed a clinical evaluation of a herbal mixture
10), Chrysanthemum morifolium
7), and a food product containing lingonberry (Vaccinium vitis-idaea) and cherry blossom (Prunus lannesiana) as main ingredients
11). The objective of the present study was to evaluate the inhibitory effect on AGE production and the safety of a vinegar beverage containing indigestible dextrin and a mixed herbal extract administered for 8 consecutive weeks in a placebo-controlled, randomized, double-blind design.
Methods
Subjects
Eligible subjects were selected according to the following criteria. A total of 109 post-menopausal women aged between 50-65 years, previously diagnosed with increased blood glucose or hemoglobin A1c (HbA1c) levels and an abdominal circumference of 90 cm or more, were recruited.
After explanation of the study, written informed consent to study participation was obtained from all women. An oral rice ingestion test and skin AGE deposition analysis were performed as screening tests on all potential subjects. In the oral rice ingestion test, subjects were instructed to eat 200 g of rice (294 kcal, 67.8 g carbohydrate and 4.2 g protein) with 2.5 g of rice seasoning condiment (11 kcal, 1.0 g carbohydrate and 0.6 g protein). Blood glucose levels were measured at 0, 30, 60, and 120 minutes after consumption according to the unified procedure proposed by the Japanese Association for the Study of Glycemic Index. A total of 23 women (mean age 57.4 ± 3.9 years) shown to have high levels of 60-minute blood glucose and skin AGE deposition were included in the full analysis set (FAS) of the study. Except for one subject who was withdrawn during the study period, no subject met any of the exclusion criteria, and all of the remaining 22 subjects completed the study and complied with the protocol (per protocol set; PPS).
The subject was withdrawn because she experienced acid reflux when taking the test diet, which was determined to be unrelated to study diet intake. Subjects taking drugs or supplements that may affect the blood glucose level, smokers or those with a short sleep duration (< 5 hours) were excluded. Those meeting the last two criteria were excluded because these lifestyle factors are known to increase AGE deposition in the skin
4). Study design
The study was conducted in a two-group (control and test group), placebo-controlled, randomized, double-blind study design. Subjects were given either a placebo (control group) or a vinegar beverage containing indigestible dextrin and a mixed herbal extract as the test diet (test group) for 8 consecutive weeks.
A clinical evaluation consisting of an interview, a physical examination, a blood/urine tests, and a skin function test was performed at 0, 8, and 12 weeks.
Subjects were instructed to take 120 ml of the control or test diet twice daily, i.e., before breakfast and dinner. The daily intake amounted to 840 mg of acetic acid, 5 g of indigestible dextrin and 100mg of mixed herbal extract. Both the placebo and the test diet were given for 8 weeks, with a follow-up period of 4 weeks. Initially, the placebo/test diet intake period was set at 12 weeks. However, later it was shortened to 8 weeks after foreign matter contamination was detected in the manufacturing process of the test diet. Subjects were instructed to take the test diet
even if they were not having a meal. The mean intake rate was 97.1 % (88.3 % ) in the control group, 98.3 % (97.3 % ) in the test group, and 97.7 % (92.8 % ) in the entire population, with values in parenthesis representing mean rates up to week 8.
The study was conducted between September 2012 and December 2012 at TES Holdings Co., Ltd. (Bunkyo-ku, Tokyo, Japan). After the subjects were given sufficient explanation regarding purpose and details of the study and participants' rights, they provided written informed consent. They were also told that early withdrawal from the study would not be a detriment.
Test diet
The compositions of placebo and test diet are shown in Table 1.
Acetic acid Citric acid Indigestible dextrin Mixed herbal extract1) Tien-cha extract2) α-G-rutin Sucralose
Acesulfame potassium Salt
Condensed tomato juice
0.004 0.003
0.35 0.1 2.1 0.042
0.01 0.0125
0.008 0.006 0.04 0.05 Other ingredients
Ingredient (%) Placebo diet Test diet
flavoring
water flavoring
water
Table 1. Composition of placebo and test diet.
1) Mixed herbal extract contains Anthemis nobilis, Houttuynia cordata, Crataegus laevigata, and Vitis vinifera of leaf.
2) Tien-cha extract contains Rubus suavissimus.
a functional food for specified health use. Indigestible dextrin in the test diet has been associated with diarrhea and other gastrointestinal symptoms when consumed in large amounts at a time. Given that the maximum non-effect level for diarrhea in women is ≥1.0 g/kg, the daily intake of indigestible dextrin was set at 5 g in this study.
An inhibitory action on AGE production of tien-cha extract, containing Rubus suavissimus extract, was confirmed in vitro
9). Rutin, Citric acid, sucralose, and potassium acesulfame are food additives, and their content was within accepted limits.
Acetic acid, salt, and concentrated tomatoes have a long history as ingredients in various foods and were added to the test diet at concentrations smaller than found in commercially available food items. These facts assured a sufficient level of safety of the test diet. A list of safety studies of the active ingredients present in the test diet is shown in Table 2 .
To ensure product quality, the manufacturing process of the vinegar beverage containing indigestible dextrin and mixed herbal extract is strictly controlled from the reception of raw materials to the packaging of the end product. Among other acceptance criteria, the end product has to contain less than 10
3/mL viable cells and no detectable coliform bacteria to pass quality control.
Test procedure Subjective symptoms
Subjective symptoms were divided into physical and mental symptoms and evaluated on a 5-point scale using the Anti-Aging QOL Common Questionnaire (AAQol), as described previously
7, 10, 11, 14, 15).
Anthropometry and physical examination
Body height, body weight, blood pressure, and body composition as measured by bioelectrical impedance analysis with a body composition analyzer (BC-118D Tanita Corp., Tokyo, Japan) as described previously
14, 15), were determined.
Vascular function test
Blood concentrations of endothelin, vascular endothelial growth factor (VEGF), and nitric oxide (NO) were measured as parameters for evaluating arteriosclerosis. Fingertip acceleration pulse wave was also measured with a plethysmometer (SDP-100, Fukuda Denshi, Tokyo, Japan) to estimate vascular age
16-18). Briefly, the second derivative of plethysmogram aging index (SDPTGAI) was calculated from parameters b/a, c/a, d/a, and e/a, and vascular age was calculated using the following formulas:
Men: Vascular age = 43.50 × SDPTGAI + 65.90 Women: Vascular age = 41.67 × SDPTGAI + 61.75 Glycation stress markers
Insulin resistance was evaluated by fasting plasma glucose (FPG), insulin, and HbA1c levels. For analysis of AGEs and glycation intermediates, serum concentrations of 3-deoxyglucosone (3DG), Nε-(carboxymethyl) lysine (CML), and pentosidine were measured as described previously
7, 10, 11).
Skin AGE deposition was measured in the medial aspect of the right upper arm (at 10 cm from the olecranon toward the shoulder) with an AGE Reader (DiagnOptic, Netherland) as described previously
4, 19). CML content in the skin stratum corneum (in the medial aspect of the right upper arm) was
Results Study details
Name of ingredient
Indigestible dextrin (as Fibersol-2H)
Negative
No sign of toxicity at 10 g/kg NOAEL: >5.0 g/kg
Maximum non-effect level for diarrhea Men: 0.8 g/kg, Women: >1.0 g/kg Negative
Negative
LD
50: > 2,000 mg/kg
LD
50: >5,000 mg/kg
LD
50: > 42,000 mg/kg
No subacute oral toxicity was observed.
NOAEL: 600 mg/kg/day Negative
No mutation was detected.
No adverse event was observed.
Reverse mutation test
A single-dose oral toxicity study in rats (male and female) A repeated-dose oral toxicity study in rats
A study to find the maximum non-effect level in humans at solid content of 0.4, 0.5, 0.6, 0.8 and 1.0 g/kg Rec-assay (lethal sensitivity test)
Reverse mutation test
An acute oral toxicity study in rats (male and female)
An acute oral toxicity study in mice (male and female)
An acute oral toxicity study in mice (male and female) A 28-day subacute oral toxicity study
50, 200 and 1,000 mg/kg/day
A 28-day repeated-dose oral toxicity study in rats (male and female) Reverse mutation test
Micronucleus test
3,000 mg/day (5 times the regular dose) for 4 weeks An overdose study (in humans)
Mixed herbal extract (as AG herb mix)
Tien-cha extract
(Tien-cha Extract M Powder)
Rutin
(as glucosyl rutin)
Table 2. List of safety studies.
Abbreviations: NOAEL, no observable adverse effect level; LD50, 50% lethal dose
measured as described previously
20). Briefly, an adhesive film was firmly applied to the skin to collect a sample of the stratum corneum (tape stripping technique). Three samples were collected from the same site and CML content was measured.
Samples are typically collected from the left cheek (center portion between the bottom of the ear lobe and the lip end) or from the medial aspect of the right upper arm (at 10 cm from the olecranon toward the shoulder).
Oxidation stress markers
Concentrations of 8-hydroxydeoxyguanosine (8-OHdG) and isoprostane in urine samples collected during the night were measured as markers for oxidation stress
21-25). These parameters were measured by Mitsubishi Chemical Medience Corporation (Minato-ku, Tokyo, Japan). In addition, concentrations of 8-OHdG, isoprostane, and creatinine in the first urine collected in the early morning were measured to calculate creatinine- adjusted concentrations of 8-OHdG (8-OHdG/CRE) and isoprostane (isoprostane/CRE).
Immune stress markers
Serum and plasma concentrations of high-sensitivity C-reactive protein (hsCRP) and interleukin-6 (IL-6), both inflammatory markers, were measured as immune stress markers.
Skin function test
The properties and function of the skin were evaluated by measuring color difference, moisture content, and melanin/
erythema content, as well as by the identification of wrinkles and spots based on imaging analysis. These tests were performed in a room with constant temperature and humidity (25°C, 50 % ) after a 20-minute conditioning period.
For the imaging analysis of facial skin, the VISIA Evolution System (Canfield Imaging Systems, Fairfield, NJ, USA)
26)was used to examine pores, spots (visualized as light spots), melanin (brown spots), hemoglobin (red spots), wrinkles, color unevenness (texture), porphyrin, and latent spots (UV spots). This test was performed on the left cheek of each subject.
Skin elasticity was evaluated using a cutometer (MPA580;
Courage & Khazaka, Kern, Germany)
29-31). The skin surface was drawn by negative pressure into the aperture of the probe, and the length of the skin drawn into the aperture was measured by the prism. This test was performed on the left cheek (center portion between the bottom of the ear lobe and the lip end) in the supine position or on the medial aspect of the right upper arm (at 10 cm from the olecranon toward the shoulder) in a sitting position. Results were expressed as skin elasticity index R2 or R7, respectively.
Skin moisture content was measured in the left cheek with a moisture meter (Corneometer, CM825; Courage &
Khazaka)
32). For skin color analysis, a spectrophotometer (CM-2600d, Konica Minolta Sensing, Osaka, Japan) was used to measure L * , a * , b * , melanin index (melanin content), hemoglobin content (Hb index), and blood oxygen saturation (Hb SO
2index) of the left cheek as described previously
28). Safety test
For safety evaluation, the following parameters were measured for the test diet and placebo before (0 weeks) and
at 8 and 12 weeks after intake: total cholesterol (TC), LDL cholesterol (LDL-C), HDL cholesterol (HDL-C), triglyceride (TG), atherogenic index (AI), total bilirubin (TB), aspartate aminotransferase (AST/GOT), alanine aminotransferase (ALT/GPT), lactate dehydrogenase (LDH), gamma-glutamyl transpeptidase (γ-GTP), creatine phosphokinase (CPK), uric acid (UA), urea nitrogen (BUN), creatinine (CRE), sodium (Na), potassium (K), chloride (Cl), calcium (Ca), total protein (TP), albumin (ALB), albumin/globulin ratio (A/G), and iron (Fe). Urine samples collected during the night were also analyzed for concentrations of sodium (Na), potassium (K), and calcium (Ca) to detect possible excessive electrolyte intake.
Analysis of glycation stress markers, i.e., 3DG and CML, was performed by SRL Inc. (Shinjuku-ku, Tokyo, Japan).
Analysis of endothelin, a marker for vascular endothelial function, and CML content in the skin stratum corneum was performed at the Life & Medical Science Investigation Center of A-kit Corporation (Kyotanabe, Kyoto, Japan). The remaining blood/urine parameters were measured by Mitsubishi Chemical Medience Corporation.
Ethical considerations
This study was conducted at a third-party institution in compliance with the ethical principles based on the Declaration of Helsinki, the Private Information Protection Law, and the Ministerial Ordinance on Good Clinical Practice (GCP) for Drugs (Ministry of Health, Labor and Welfare, Ordinance No.
28 of March 27, 1997). The study protocol was reviewed for ethical aspects and appropriateness of the study and approved by the human research ethics committee of the institutional review board at Tokyo Synergy Clinic (Chuo-ku, Tokyo, Japan). The study was conducted according to the approved protocol.
The principal investigator and sub investigators, in cooperation with a contract research organization, explained the details of the study to and obtained written consent from each subject based on her free will before initiating the study.
Statistical analysis
All results were expressed as mean ± standard deviation.
Dunnett’s test was used to compare data obtained before and at 8 and 12 weeks after diet intake, while unpaired Mann- Whitney U-test was used for comparisons between two groups.
In addition, a subclass analysis was performed in the group of subjects with a 60-minute postprandial blood glucose level of 150 mg/dL or more (7 subjects from the control group and 10 from the test group), as determined by screening examination.
All analyses were performed using IBM SPSS Statistics 20 software (IBM Japan, Tokyo, Japan), with a two-sided significance level of 5 % . Safety evaluation was based on blood parameter assessment and the occurrence of individual adverse events.
Results
Subjective and objective symptoms
No significant changes or differences were observed in the
scores for physical and mental symptoms, as assessed by the
AAQol questionnaire, within or between the control and test
arms over the study period (data not shown).
Physical examination
No significant changes or differences were observed in body height, body weight, body composition, basal metabolic rate, blood pressure or pulse rate within or between the control and test arms over the study period ( Table 3 ).
Blood chemistry
The results of blood chemistry are summarized in Table 4 . The AST (GOT) level in the test arm was significantly decreased compared to control at week 8, but returned to baseline level after discontinuation of the test diet. No significant intergroup difference was observed in any other parameter.
Vascular function test
No significant intergroup difference was observed in estimated vascular age as determined by fingertip acceleration pulse wave analysis or by serum concentrations of endothelin, VEGF, and NO
X( Table 5 ).
Glycation stress parameters
Glycation stress parameters are summarized in Table 6.
No significant intergroup difference was observed in FPG or HbA1c levels during the study period. A significantly increased
insulin level in the test group compared to control was observed at week 12, but was within the range of physiological variation.
No significant intergroup differences were observed in the serum concentrations of 3DG, CML, or pentosidine or in the CML content in the skin stratum corneum during the study period. The fluorescence intensity of skin AGEs was similar between the two groups at week 8, but significantly higher in the test group compared to the control group at week 12, i.e., after discontinuation of the test diet.
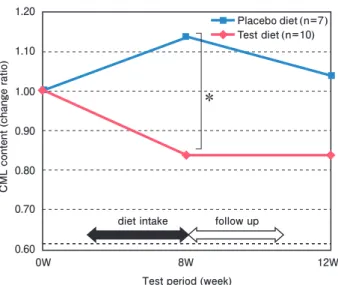
A subclass analysis was performed in 10 subjects from the test group and 7 from the control group with a 60-minute postprandial blood glucose level of 150 mg/dL or more. CML content in the skin stratum corneum in the test group was significantly decreased compared to control at week 8 (p <0.05) and remained at a low level even after discontinuation of the test diet, although no significant difference was observed at 12 weeks ( Fig. 1 ).
Oxidation stress parameters
In the test group, a significant increase in urine 8-OHdG concentration was observed at weeks 8 and 12 as compared to before diet intake (p = 0.009 and p = 0.009, respectively) ( Table 7 ). Meanwhile, no significant difference was found in this parameter between the test and control group. No significant changes or differences were observed in urine isoprostane concentrations within or between groups.
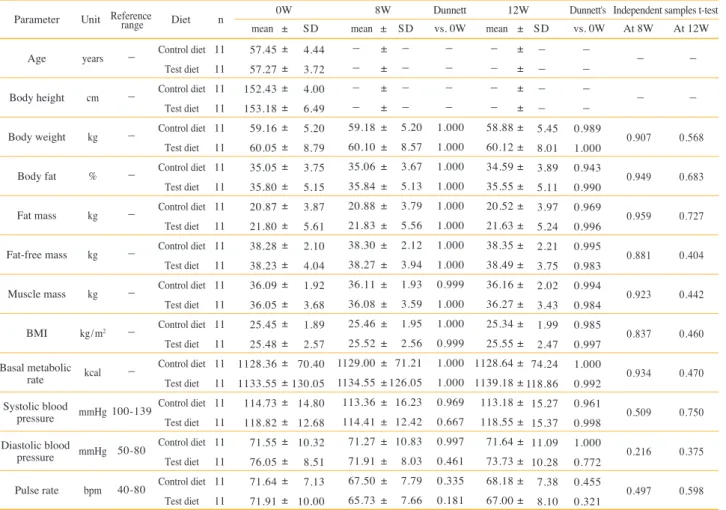
Parameter Age Body height Body weight Body fat Fat mass Fat-free mass Muscle mass
BMI
Pulse rate years
cm kg
% kg kg kg kg/m
2kcal mmHg mmHg bpm
ー ー
0.907 0.949 0.959 0.881 0.923 0.837 0.934 0.509 0.216 0.497
ー ー
0.568 0.683 0.727 0.404 0.442 0.460 0.470 0.750 0.375 0.598
Control dietTest diet Control diet
Test diet Control diet
Test diet Control diet
Test diet Control diet
Test diet Control diet
Test diet Control diet
Test diet Control diet
Test diet Control diet
Test diet Control diet
Test diet Control diet
Test diet Control diet
Test diet
11 11 11 11 11 11 11 11 11 11 11 11 11 11 11 11 11 11 11 11 11 11 11 11
±
±
±
±
±
±
±
±
±
±
±
±
±
±
±
±
±
±
±
±
±
±
±
±
±
±
±
±
±
±
±
±
±
±
±
±
±
±
±
±
±
±
±
±
±
±
±
±
±
±
±
±
±
±
±
±
±
±
±
±
±
±
±
±
±
±
±
±
±
±
±
± 57.45
57.27 152.43 153.18 59.16 60.05 35.05 35.80 20.87 21.80 38.28 38.23 36.09 36.05 25.45 25.48 1128.36 1133.55 114.73 118.82 71.55 76.05 71.64 71.91
4.44 3.72 4.00 6.49 5.20 8.79 3.75 5.15 3.87 5.61 2.10 4.04 1.92 3.68 1.89 2.57 70.40 130.05 14.80 12.68 10.32 8.51 7.13 10.00
ー ー ー ー
59.18 60.10 35.06 35.84 20.88 21.83 38.30 38.27 36.11 36.08 25.46 25.52 1129.00 1134.55 113.36 114.41 71.27 71.91 67.50 65.73
ー ー ー ー
5.20 8.57 3.67 5.13 3.79 5.56 2.12 3.94 1.93 3.59 1.95 2.56 71.21 126.05 16.23 12.42 10.83 8.03 7.79 7.66
ー ー ー ー
1.000 1.000 1.000 1.000 1.000 1.000 1.000 1.000 0.999 1.000 1.000 0.999 1.000 1.000 0.969 0.667 0.997 0.461 0.335 0.181
ー ー ー ー
58.88 60.12 34.59 35.55 20.52 21.63 38.35 38.49 36.16 36.27 25.34 25.55 1128.64 1139.18 113.18 118.55 71.64 73.73 68.18 67.00
ー ー ー ー
5.45 8.01 3.89 5.11 3.97 5.24 2.21 3.75 2.02 3.43 1.99 2.47 74.24 118.86 15.27 15.37 11.09 10.28 7.38 8.10
ー ー ー ー
0.989 1.000 0.943 0.990 0.969 0.996 0.995 0.983 0.994 0.984 0.985 0.997 1.000 0.992 0.961 0.998 1.000 0.772 0.455 0.321
ーー ー ー ー ー ー ー ー
100-139
50-80 40-80
Unit Diet 0W
mean ± SD
8W Dunnett
mean ± SD vs. 0W
12W Dunnett's Independent samples t-test mean ± SD vs. 0W At 8W At 12W Reference n
range
Table 3. Anthropometry and physical examination.
Abbreviations: BMI; body mass index
Systolic blood
pressure Basal metabolic
rate
Diastolic blood
pressure
Parameter
Total protein Albumin
A /G AST(GOT) ALT(GPT) LD(LDH)
γ-GT Total bilirubin
CPK Creatinine Urea nitrogen
Uric acid Total cholesterol HDL cholesterol LDL cholesterol TG (triglyceride)
Sodium Potassium
Chloride Calcium Serum iron
g/dL g/dL
IU/L/37℃
IU/L/37℃
IU/L/37℃
IU/L/37℃
mg/dL IU/L/37℃
mg/dL mg/dL mg/dL mg/dL mg/dL mg/dL mg/dL mgEq/L mgEq/L mgEq/L mg/dL μg/dL
6.7 - 8.3 3.8 - 5.3 1.1 - 2.0 10 - 40 5 - 45 120 - 240
≤30 0.2 - 1.2 40 - 150 0.47 - 0.79 8.0 - 20.0 2.5 - 7.0 120 - 219 40 - 95 65 - 139 30 - 149 137 - 147 3.5 - 5.0 98 - 108 8.4 - 10.4 40 - 180
< 4
0.407 0.419 0.726 0.029 0.333 0.729 0.537 0.723 0.891 0.288 0.660 0.271 0.910 0.146 0.931 0.145 0.116 0.716 0.180 0.854 0.812 0.167
0.549 0.650 0.821 0.117 0.830 0.767 0.634 0.451 0.153 0.597 0.734 0.735 0.731 0.555 0.880 0.172 0.697 0.307 0.897 1.000 0.119 0.584 Control diet
Test diet Control diet
Test diet Control diet
Test diet Control diet
Test diet Control diet
Test diet Control diet
Test diet Control diet
Test diet Control diet
Test diet Control diet
Test diet Control diet
Test diet Control diet
Test diet Control diet
Test diet Control diet
Test diet Control diet
Test diet Control diet
Test diet Control diet
Test diet Control diet
Test diet Control diet
Test diet Control diet
Test diet Control diet
Test diet Control diet
Test diet Control diet
Test diet 11 11 11 11 11 11 11 11 11 11 11 11 11 11 11 11 11 11 11 11 11 11 11 11 11 11 11 11 11 11 11 11 11 11 11 11 11 11 11 11 11 11 11 11
7.35 7.34 4.36 4.37 1.49 1.49 19.91 24.36 16.82 21.73 204.55 216.36 26.82 40.55 0.75 0.80 109.64 84.27 0.67 0.64 12.84 12.34 5.12 4.74 234.36 238.09 63.91 62.36 148.09 154.45 102.82 102.00 142.00 142.18 4.30 4.32 104.64 104.91 9.77 9.83 98.09 94.00 2.82 2.89
0.33 0.37 0.14 0.15 0.18 0.15 2.95 6.09 4.77 7.51 53.95 19.73 17.55 34.52 0.25 0.29 53.84 32.42 0.09 0.07 3.34 2.18 1.50 1.25 29.69 31.48 14.58 10.59 26.63 29.54 52.17 24.08 1.26 1.33 0.24 0.27 1.57 1.45 0.30 0.25 34.67 27.04 0.97 0.65
0.32 0.39 0.17 0.22 0.18 0.21 4.83 4.39 5.11 5.58 37.52 18.32 9.05 19.57 0.19 0.28 65.40 26.60 0.09 0.07 3.44 2.22 1.21 1.03 38.58 30.84 20.07 11.09 36.81 29.17 37.62 39.88 1.21 1.57 0.27 0.39 1.04 2.13 0.30 0.27 35.80 21.80 0.91 0.81
0.292 0.525 0.355 0.698 0.770 0.811 0.604 0.307 0.999 0.678 0.871 0.380 0.782 0.561 0.879 0.773 0.953 1.000 0.479 0.876 0.826 0.938 0.855 0.998 0.950 0.829 0.459 0.645 0.998 0.989 0.525 0.984 0.016 0.619 0.722 0.562 0.079 1.000 0.946 0.991 0.988 0.961 0.633 0.957
7.54 7.60 4.43 4.47 1.45 1.45 21.27 23.45 17.64 22.00 198.45 206.82 21.73 38.55 0.76 0.88 94.18 94.36 0.66 0.64 13.34 12.57 4.95 4.49 235.45 243.09 68.45 65.27 148.00 155.91 88.64 111.00 141.18 141.64 4.40 4.29 103.55 103.91 9.76 9.82 94.64 105.73 2.59 2.78
0.44 0.38 0.23 0.18 0.17 0.16 2.10 7.03 4.70 8.67 34.25 21.59 9.63 32.98 0.16 0.43 23.19 36.21 0.08 0.07 3.26 2.58 1.64 1.10 34.37 38.51 15.73 10.47 34.92 34.48 40.40 51.40 1.17 1.03 0.24 0.24 1.29 1.51 0.33 0.27 28.39 29.13 0.87 0.79
0.413 0.202 0.639 0.346 0.844 0.764 0.564 0.913 0.893 0.995 0.922 0.438 0.548 0.982 0.992 0.799 0.699 0.687 0.971 0.984 0.915 0.960 0.951 0.833 0.996 0.917 0.756 0.752 1.000 0.991 0.670 0.821 0.215 0.530 0.551 0.968 0.109 0.303 0.997 0.995 0.957 0.483 0.787 0.919 7.57
7.50 4.46 4.43 1.45 1.45 21.18 20.80 16.91 19.30 196.55 205.70 23.64 28.40 0.79 0.89 115.18 84.60 0.63 0.62 13.57 12.64 4.83 4.76 238.27 245.70 71.73 66.10 147.36 156.10 84.55 104.60 140.55 141.70 4.37 4.44 103.45 104.90 9.81 9.84 99.91 96.70 2.50 2.81
±
±
±
±
±
±
±
±
±
±
±
±
±
±
±
±
±
±
±
±
±
±
±
±
±
±
±
±
±
±
±
±
±
±
±
±
±
±
±
±
±
±
±
±
±
±
±
±
±
±
±
±
±
±
±
±
±
±
±
±
±
±
±
±
±
±
±
±
±
±
±
±
±
±
±
±
±
±
±
±
±
±
±
±
±
±
±
±
±
±
±
±
±
±
±
±
±
±
±
±
±
±
±
±
±
±
±
±
±
±
±
±
±
±
±
±
±
±
±
±
±
±
±
±
±
±
±
±
±
±
±
±
Unit Diet 0W
mean ± SD
8W Dunnett's mean ± SD vs. 0W
12W Dunnett's Independent samples t-test mean ± SD vs. 0W At 8W At 12W Reference n
range
Table 4. Serum parameters.
Abbreviations: AST/GOT, aspartate aminotransferase; ALT/GPT, alanine aminotransferase; LD/LDH, lactate dehydrogenase; y-GT, gamma-glutamyl transpeptidase; CPK, creatine phosphokinase
(atherogenic index)AI
Parameter
SDPTGAI b/a c/a d/a e/a b-a c-a d-a e-a a-a PTGAI
Years
−
−
−
−
− ms ms ms ms ms
− pg/mL pg/mL μmol/L
0.530 0.519 0.392 0.481 0.257 0.749 0.655 0.731 0.431 0.542 0.403 0.308 0.357 0.109 0.917
0.110 0.156 0.262 0.943 0.032 0.874 0.625 0.067 0.539 0.696 0.924 0.052
− 0.091 0.622 Control diet
Test diet Control diet
Test diet Control diet
Test diet Control diet
Test diet Control diet
Test diet Control diet
Test diet Control diet
Test diet Control diet
Test diet Control diet
Test diet Control diet
Test diet Control diet
Test diet Control diet
Test diet Control diet
Test diet Control diet
Test diet Control diet
Test diet 11 11 11 11 11 11 11 11 11 11 11 11 11 11 11 11 11 11 11 11 11 11 11 11 11 11 11 11 11 11
60.50 65.27 -0.01 0.11 -0.48 -0.42 -0.20 -0.21 -0.37 -0.42 0.11 0.10 95.45 93.64 173.27 164.91 222.55 226.73 304.36 311.09 914.36 896.18 1.14 1.24 1.25 1.27 19.68 27.11 32.29 26.65
11.33 8.13 0.27 0.23 0.07 0.12 0.11 0.05 0.11 0.11 0.04 0.06 19.06 9.71 18.38 14.60 14.89 21.60 21.03 28.29 99.64 94.47 0.12 0.21 0.23 0.38 6.25 13.12 24.71 13.29
58.32 60.77 -0.07 -0.01 -0.51 -0.49 -0.15 -0.18 -0.38 -0.38 0.09 0.08 86.73 87.09 168.00 161.45 225.09 222.36 303.64 304.73 918.55 926.18 1.20 1.22 1.39 1.27 27.48 63.53 48.41 42.70
8.58 12.01 0.20 0.30 0.08 0.13 0.08 0.08 0.11 0.11 0.03 0.06 12.34 12.44 11.70 14.67 15.06 6.12 16.90 9.60 87.08 86.91 0.12 0.20 0.29 0.38 12.47 59.29 26.44 19.37
0.831 0.414 0.812 0.420 0.647 0.272 0.333 0.600 0.984 0.539 0.634 0.566 0.322 0.356 0.647 0.824 0.878 0.736 0.993 0.668 0.991 0.676 0.449 0.956 0.251 0.985 0.179 0.089 0.229 0.039
62.95 61.68 0.04 0.02 -0.45 -0.44 -0.17 -0.17 -0.40 -0.36 0.08 0.07 88.18 88.73 163.27 167.09 224.18 222.91 303.09 306.00 928.18 906.00 1.25 1.22
−
− 29.42 58.94 31.14 22.05
10.12 6.23 0.24 0.17 0.10 0.07 0.09 0.09 0.11 0.10 0.04 0.03 14.01 13.92 15.98 17.24 12.02 14.73 15.83 16.10 72.64 99.70 0.16 0.16
−
− 12.69 38.02 22.28 12.00
0.793 0.559 0.849 0.594 0.647 0.878 0.669 0.490 0.699 0.295 0.261 0.397 0.444 0.544 0.244 0.924 0.947 0.789 0.980 0.769 0.905 0.957 0.109 0.979
−
− 0.080 0.135 0.991 0.699
±
±
±
±
±
±
±
±
±
±
±
±
±
±
±
±
±
±
±
±
±
±
±
±
±
±
±
±
±
±
±
±
±
±
±
±
±
±
±
±
±
±
±
±
±
±
±
±
±
±
±
±
±
±
±
±
±
±
±
±
±
±
±
±
±
±
±
±
±
±
±
±
±
±
±
±
±
±
±
±
±
±
±
±
±
±
±
± Endothelin
NO
Unit Diet 0W
mean ± SD
8W Dunnett's
mean ± SD vs. 0W
12W Dunnett's Independent samples t-test mean ± SD vs. 0W At 8W At 12W n
Table 5. Vascular endothelial function parameters.
Abbreviations: SDPTGAI, second derivative of plethysmogram aging index; PTGAI, plethysmogram aging index; NO, nitric oxide Estimated
vascular age
Fingertip acceleration pulse wave
VEGF (vascular endothelial growth factor)
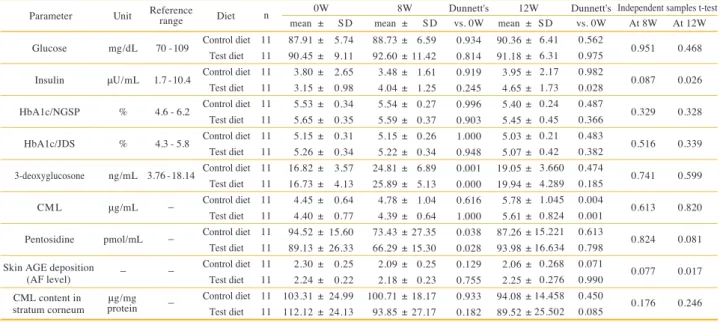
Parameter Glucose
Insulin HbA1c/NGSP
HbA1c/JDS 3-deoxyglucosone
CML Pentosidine
mg/dL μU/mL
%
% ng/mL μg/mL pmol/mL
−
70 - 109 1.7 - 10.4 4.6 - 6.2 4.3 - 5.8 3.76 - 18.14
−
−
−
−
0.951 0.087 0.329 0.516 0.741 0.613 0.824 0.077 0.176
0.468 0.026 0.328 0.339 0.599 0.820 0.081 0.017 0.246 Unit Reference
range Diet 0W
mean ± SD 8W Dunnett's
mean ± SD vs. 0W 12W Dunnett's Independent samples t-test
mean ± SD vs. 0W At 8W At 12W
n
Table 6. Glycation stress-related parameters.
Abbreviations: HbA1c/NGSP, hemoglobin A1c/National Glycohemoglobin Standardization Program; HbA1c/JDS, hemoglobin A1c/ Japan Diabetes Society; CML, carboxymethyl lysine; AGE, advanced glycation end products; AF, autofluorescence
Skin AGE deposition (AF level) CML content in
stratum corneum μg/mg protein
Control diet Test diet Control diet
Test diet Control diet
Test diet Control diet
Test diet Control diet
Test diet Control diet
Test diet Control diet
Test diet Control diet
Test diet Control diet
Test diet 11 11 11 11 11 11 11 11 11 11 11 11 11 11 11 11 11 11
±
±
±
±
±
±
±
±
±
±
±
±
±
±
±
±
±
±
±
±
±
±
±
±
±
±
±
±
±
±
±
±
±
±
±
±
±
±
±
±
±
±
±
±
±
±
±
±
±
±
±
±
±
± 87.91
90.45 3.80 3.15 5.53 5.65 5.15 5.26 16.82 16.73 4.45 4.40 94.52 89.13 2.30 2.24 103.31 112.12
5.74 9.11 2.65 0.98 0.34 0.35 0.31 0.34 3.57 4.13 0.64 0.77 15.60 26.33 0.25 0.22 24.99 24.13
88.73 92.60 3.48 4.04 5.54 5.59 5.15 5.22 24.81 25.89 4.78 4.39 73.43 66.29 2.09 2.18 100.71 93.85
6.59 11.42 1.61 1.25 0.27 0.37 0.26 0.34 6.89 5.13 1.04 0.64 27.35 15.30 0.25 0.23 18.17 27.17
0.934 0.814 0.919 0.245 0.996 0.903 1.000 0.948 0.001 0.000 0.616 1.000 0.038 0.028 0.129 0.755 0.933 0.182
90.36 91.18 3.95 4.65 5.40 5.45 5.03 5.07 19.05 19.94 5.78 5.61 87.26 93.98 2.06 2.25 94.08 89.52
6.41 6.31 2.17 1.73 0.24 0.45 0.21 0.42 3.660 4.289 1.045 0.824 15.221 16.634 0.268 0.276 14.458 25.502
0.562 0.975 0.982 0.028 0.487 0.366 0.483 0.382 0.474 0.185 0.004 0.001 0.613 0.798 0.071 0.990 0.450 0.085
Inflammation-related parameters
No significant changes or differences were observed in hsCRP or IL-6 levels within or between groups over the study period ( Table 8 ).
Urine electrolytes
Concentrations of sodium, potassium, and calcium present in urine samples collected during the night are summarized in Table 9 . No significant changes or differences were observed in urine electrolyte concentrations within or between groups over the study period.
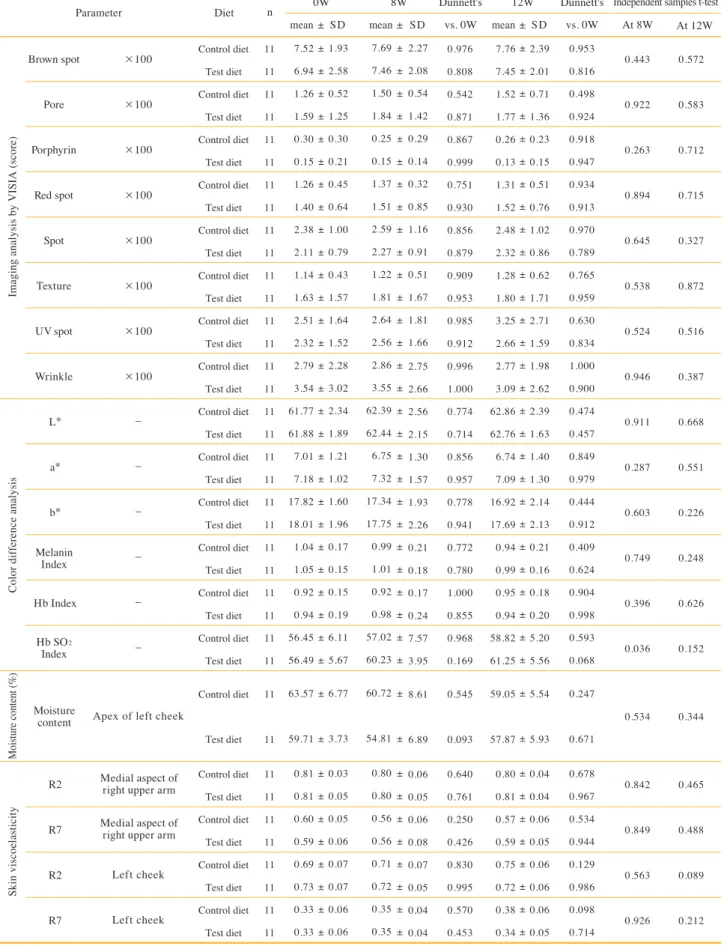
Skin function test
No significant changes or differences were observed in the results of the imaging analysis with the VISIA Evolution system, moisture content analysis, or skin elasticity test within or between groups over the study period ( Table 10 ).
In the color difference test, the Hb SO
2index (blood oxygen saturation) in the test group (measured in the left cheek) was significantly higher than that in the control group at week 8, and it remained at a similar level until week 12, i.e., after discontinuation of the test diet, although no significant intergroup difference was observed. No significant intergroup difference was observed in other parameters.
Fig.1. Change in carboxymethyl lysine (CML) content in the stratum corneum.
Subclass analysis of the subjects with high postprandial blood glucose (>150 mg/dL at 60 minutes).
CML content in the stratum corneum was measured by the tape stripping method. The change ratio was calculated as follows:
* p < 0.05, Mann-Whitney test.
Test period (week) 1.20
1.10 1.00 0.90 0.80 0.70
0.60
0W 8W
diet intake follow up
12W
CML content (change ratio)
Placebo diet (n=7) Test diet (n=10)
*
Parameter
8OHdG pg/mg・Cr pg/mg・Cr Urine
isoprostane
Control diet Test diet Control diet
Test diet 11 11 11 11
±
±
±
±
±
±
±
±
±
±
±
± 7.21
6.98 267.09 308.36
2.06 2.38 102.38 111.31
9.52 10.03 291.55 346.73
2.23 2.06 97.15 93.29
0.063 0.009 0.754 0.508
10.21 10.05 287.36 323.09
2.95 2.58 69.30 55.08
0.014 0.009 0.822 0.898
0.504 0.634
0.956 0.898
Unit Diet 0W
mean ± SD
8W Dunnett's mean ± SD vs. 0W
12W Dunnett's Independent samples t-test mean ± SD vs. 0W At 8W At 12W n
Table 7. Oxidation stress-related parameters.
Abbreviations: 8OHdG, 8-hydroxydeoxyguanosine
Parameter High-sensitivity
CRP mg/dL
pg/mL Interleukin-6
Control diet Test diet Control diet
Test diet 11 11 11 11
±
±
±
±
±
±
±
±
±
±
±
± 0.06
0.08 0.93 0.99
0.05 0.07 0.62 0.47
0.05 0.07 0.84 0.88
0.02 0.07 0.51 0.39
0.522 0.856 0.712 0.550
−
−
−
−
−
−
−
−
−
−
−
−
0.530 0.529
−
−
Unit Diet 0W
mean ± SD
8W Dunnett's mean ± SD vs. 0W
12W Dunnett's Independent samples t-test mean ± SD vs. 0W At 8W At 12W n
Table 8. Inflammation-related parameters
Abbreviations: CRP, C-reactive protein
Parameter Urine sodium Urine potassium
Urine calcium mEq/L mEq/L mg/dL
Control diet Test diet Control diet
Test diet Control diet
Test diet 11 11 11 11 11 11
±
±
±
±
±
±
±
±
±
±
±
±
±
±
±
±
±
± 94.45
77.91 20.20 17.85 7.65 12.55
45.96 42.80 12.26 15.50 3.93 9.51
93.18 103.55 27.75 25.45 12.18 16.53
51.38 41.20 21.92 14.36 7.61 13.86
0.998 0.328 0.532 0.439 0.123 0.589
97.73 110.36 27.67 28.65 8.79 14.38
56.44 52.09 19.39 17.94 4.67 7.51
0.984 0.183 0.538 0.213 0.851 0.888
0.168 0.992 0.894
0.168 0.992 0.894
Unit Diet 0W
mean ± SD
8W Dunnett's mean ± SD vs. 0W
12W Dunnett's Independent samples t-test mean ± SD vs. 0W At 8W At 12W n
Table 9. Results of urine electrolyte analysis.
Parameter Brown spot
Pore Porphyrin
Red spot Spot Texture UV spot Wrinkle
L*
a*
b*
Hb Index
R2 R7 R2 R7
×100
×100
×100
×100
×100
×100
×100
×100
−
−
−
−
−
−
Apex of left cheek
Left cheek Left cheek
Imaging analysis by VISIA (score)Color difference analysisSkin viscoelasticityMoisture content (%)
Control diet Test diet Control diet
Test diet Control diet
Test diet Control diet
Test diet Control diet
Test diet Control diet
Test diet Control diet
Test diet Control diet
Test diet Control diet
Test diet Control diet
Test diet Control diet
Test diet Control diet
Test diet Control diet
Test diet Control diet
Test diet Control diet
Test diet
Control diet Test diet Control diet
Test diet Control diet
Test diet Control diet
Test diet 11 11 11 11 11 11 11 11 11 11 11 11 11 11 11 11 11 11 11 11 11 11 11 11 11 11 11 11 11
11
11 11 11 11 11 11 11 11
±
±
±
±
±
±
±
±
±
±
±
±
±
±
±
±
±
±
±
±
±
±
±
±
±
±
±
±
±
±
±
±
±
±
±
±
±
±
±
±
±
±
±
±
±
±
±
±
±
±
±
±
±
±
±
±
±
±
±
±
±
±
±
±
±
±
±
±
±
±
±
±
±
±
±
±
±
±
±
±
±
±
±
±
±
±
±
±
±
±
±
±
±
±
±
±
±
±
±
±
±
±
±
±
±
±
±
±
±
±
±
±
±
± 7.52
6.94 1.26 1.59 0.30 0.15 1.26 1.40 2.38 2.11 1.14 1.63 2.51 2.32 2.79 3.54 61.77 61.88 7.01 7.18 17.82 18.01 1.04 1.05 0.92 0.94 56.45 56.49 63.57
59.71
0.81 0.81 0.60 0.59 0.69 0.73 0.33 0.33
1.93 2.58 0.52 1.25 0.30 0.21 0.45 0.64 1.00 0.79 0.43 1.57 1.64 1.52 2.28 3.02 2.34 1.89 1.21 1.02 1.60 1.96 0.17 0.15 0.15 0.19 6.11 5.67 6.77
3.73
0.03 0.05 0.05 0.06 0.07 0.07 0.06 0.06
7.69 7.46 1.50 1.84 0.25 0.15 1.37 1.51 2.59 2.27 1.22 1.81 2.64 2.56 2.86 3.55 62.39 62.44 6.75 7.32 17.34 17.75 0.99 1.01 0.92 0.98 57.02 60.23 60.72
54.81
0.80 0.80 0.56 0.56 0.71 0.72 0.35 0.35
2.27 2.08 0.54 1.42 0.29 0.14 0.32 0.85 1.16 0.91 0.51 1.67 1.81 1.66 2.75 2.66 2.56 2.15 1.30 1.57 1.93 2.26 0.21 0.18 0.17 0.24 7.57 3.95 8.61
6.89
0.06 0.05 0.06 0.08 0.07 0.05 0.04 0.04
0.976 0.808 0.542 0.871 0.867 0.999 0.751 0.930 0.856 0.879 0.909 0.953 0.985 0.912 0.996 1.000 0.774 0.714 0.856 0.957 0.778 0.941 0.772 0.780 1.000 0.855 0.968 0.169 0.545
0.093
0.640 0.761 0.250 0.426 0.830 0.995 0.570 0.453
7.76 7.45 1.52 1.77 0.26 0.13 1.31 1.52 2.48 2.32 1.28 1.80 3.25 2.66 2.77 3.09 62.86 62.76 6.74 7.09 16.92 17.69 0.94 0.99 0.95 0.94 58.82 61.25 59.05
57.87
0.80 0.81 0.57 0.59 0.75 0.72 0.38 0.34
2.39 2.01 0.71 1.36 0.23 0.15 0.51 0.76 1.02 0.86 0.62 1.71 2.71 1.59 1.98 2.62 2.39 1.63 1.40 1.30 2.14 2.13 0.21 0.16 0.18 0.20 5.20 5.56 5.54
5.93
0.04 0.04 0.06 0.05 0.06 0.06 0.06 0.05
0.953 0.816 0.498 0.924 0.918 0.947 0.934 0.913 0.970 0.789 0.765 0.959 0.630 0.834 1.000 0.900 0.474 0.457 0.849 0.979 0.444 0.912 0.409 0.624 0.904 0.998 0.593 0.068 0.247
0.671
0.678 0.967 0.534 0.944 0.129 0.986 0.098 0.714
0.443 0.922 0.263 0.894 0.645 0.538 0.524 0.946 0.911 0.287 0.603 0.749 0.396 0.036
0.534
0.842 0.849 0.563 0.926
0.572 0.583 0.712 0.715 0.327 0.872 0.516 0.387 0.668 0.551 0.226 0.248 0.626 0.152
0.344
0.465 0.488 0.089 0.212
Diet 0W
mean ± SD
8W Dunnett's mean ± SD vs. 0W
12W Dunnett's Independent samples t-test mean ± SD vs. 0W At 8W At 12W n
Table 10. Skin function test.
Abbreviations: 8OHdG, 8-hydroxydeoxyguanosine Melanin
Index
Hb SO2
Index
Moisture content
Medial aspect of right upper arm Medial aspect of
right upper arm