Puppets Fight as Puppet Masters Wish :
The Influence of Shareholder Overlap on Interfirm Rivalry
Junichi Y
AMANOIAbstract
If two competing firms receive influence from the same large shareholders, how do they compete? From the view- point of competitive dynamics and agency theory, I investigate the impact of overlapping shareholders of two compet- ing firms on their competitive behavior. The overlapping shareholders of two competing firms will attempt to reduce the intensity of their competitive activity because they can increase economic surpluses from the competing firms by intentionally creating the stability of rivalry. Accordingly, competitive actions between two competing firms will be- come less intensive as their overlapping shareholders acquire more power over the firms. By using data on pairs of leaders and challengers in 13 Japanese industries in which they have engaged in lasting headtohead competition, I found support for the hypotheses.
Key Words
interfirm rivalry ; agency theory ; overlapping share- holder ; action frequency ; action magnitude.
Contents 1. Introduction
2. Theory and Hypotheses 3. Research Methods 4. Results
5. Discussion and Conclusions, and References
1. Introduction
A firm engages in rivalries with its competing firms to improve or build its market position. However, a firmʼs decisions on interfirm rivalry might depend on the interests of entities providing that firm with re- sources, which are called stakeholders. In order to increase their returns, stakeholders wield influence on firm behavior (Frooman, 1999). Among stakeholders, large shareholders are generally recognized as one of the most influential ones because financial resources are vital for corporate operations (Donaldson &
Preston, 1995). Shareholdersʼ incentives to influence firmsʼcompetitive behavior have been widely investi- gated in management and economics (e.g., Connelly, Tihanyi, Certo, & Hitt, 2010 ; Fershtman & Judd,
Acknowledgement : I appreciate insightful comments on prior drafts by David Souder.
1987). Nonetheless, the existing literature remains silent about the impact of shareholders having two competing firmsʼ equity (defined as ) on their interfirm rivalry.
In this paper, I investigate the influence of overlapping shareholders on interfirm rivalry from an
(AMC) and . The AMC perspective prevails in the
competitive dynamics literature, arguing that the nature and likelihood of a firmʼs competitive actions and responses are based on its awareness, motivation, and capability for attacking its rivals (Chen, 1996 ; Chen et al., 2007). Agency theory aims to investigate contracts governing relationships between principals and agents (Fama & Jensen, 1983 ; Jensen, 1986 ; Jensen & Meckling, 1976). By integrating insights from these perspectives, I will present the theoretical reasoning regarding what the overlapping shareholders of two competing firms encourage them to pursue in their interfirm rivalries.
The central thesis of this study is that the overlapping shareholders of two competing firms attempt to pacify their competitive activity. This is because the mild interfirm rivalry of competing firms eventually produces more economic surpluses. Since large shareholders can gain returns from a firmʼs surplus as in- come or capital gains, they are incentivized to achieve that condition. From the AMC perspective and agency theory, the overlapping shareholders of two competing firms can manipulate the firmsʼ competi- tive activity by influencing their awareness, motivation, and capability for competitive activity. If the overlapping shareholders have more power over these competing firms, which is based on their equity ownership levels, the firmsʼ competitive activity will become less intensive. This is because such overlap- ping shareholders wielding larger influence over competing firms can obtain more opportunities to signifi- cantly verify and monitor managerial plans and decisions on the firmsʼ competitive activity through multi- ple means, such as boards of directors, executive compensations, and direct negotiations (Dalton, Hitt, Certo, & Dalton, 2007 ; Shleifer & Vishny, 1997).
I investigated the hypothesized relationships using data from interfirm rivalries of pairs of a leader and a challenger (i.e., the firm with the secondlargest share) in 13 almostduopolistic industries in Japan from 1997 to 2006. This context is particularly suitable for this study because overlapping shareholders can surely obtain the maximum returns by manipulating competing firmsʼ competitive activity in headto
head competition ; therefore, overlapping shareholders will be more motivated to manipulate competing firms. As a result, the phenomenon concerned can be more easily observed. The empirical analysis in this study found support for the hypothesized relationships. By using rich and unique data, I empirically ex- pand the theoretical horizons of competitive dynamics and agency theory.
2. Theory and Hypotheses
The AMC Perspective and the Roles of Shareholders in Competitive Dynamics
The AMC perspective theorizes firmsʼ awareness, motivation, and capability for competitive activity as the drivers of interfirm competitive interactions (Chen, 1996). Awareness is based on an organizational communication perspective. The AMC perspective assumes that a firmʼs decisions on competitive activity are based on information seeking and processing (Smith et al., 1991). The level of awareness reflects the degree to which a firm recognizes the consequences of competitive actions initiated by itself and its rivals (Chen, 1996). When a firm takes note of its rivalʼs competitive actions, it can respond to these actions. Like- wise, motivation for competitive activity is based on expectancyvalence theory (Vroom, 1964). When a
firm perceives this subjective reward value and the probability of earning the reward by initiating a cer- tain competitive action, the firm engages in it (Chen & Miller, 1994 ; Yu & Cannella, 2007). Finally, capabil- ity for competitive activity conceptually arises from a resourcebased view of the firm (Amit & Schoe- maker, 1993 ; Barney, 1989, 1991 ; Penrose, 1959). A firmʼs ability to initiate competitive actions depends on its resources and capabilities (Chen, 1996) ; if the firmʼs resources and capabilities exceed those of its ri- val in terms of quality and quantity, it initiates more competitive actions, because the rival cannot initiate effective or quick competitive responses to cancel out these actions (Young, Smith, & Grimm, 2000).
The intensity of competitive activity is partially determined by its frequency and magnitude (Smith et al., 2001 ; Rindova, Becerra, & Contardo, 2004). The frequency of competitive actions is defined as the number of competitive actions initiated by the focal firm within a certain period of time (Smith, Grimm, Gannon, & Chen, 1991). The magnitude of competitive actions represents the resources committed to com- petitive actions (Rindova et al., 2004). Some studies classify competitive actions into two types based on re- source commitment : strategic actions and tactical actions (e.g., Smith et al., 1991 ; Chen, Smith, & Grimm, 1992 ; Miller & Chen, 1994). actions “involve significant commitments of specific, distinctive re- sources and are difficult to implement and reverse” (Smith et al., 1991 : 63), whereas actions “in- volve fewer and more general resources than strategic actions, are easier to implement, and are often more reversible” (Smith et al., 1991 : 63).
A firmʼs performance derived from a competitive action largely depends on the likelihood and charac- teristics of its rivalʼs competitive responses. If the rival initiates an effective and quick competitive re- sponse, the effectiveness of the firmʼs action will disappear (Smith et al., 1991). Smith et al. (1991) empiri- cally demonstrate that airlinesʼ quick responses to competitorʼs action reduced the competitorʼs perform- ance in the U.S. domestic airline industry. Likewise, in reaction to competitorsʼ strategic actions, airlinesʼ strategic responses recorded higher performance than did tactical responses. Therefore, if a firm initiates intensive competitive actions and its rival cannot effectively or quickly react to it, the firm can achieve higher performance.
Although firms tend to pursue their own profit maximization, recent studies have started to shed light on the role of shareholders as principals of competing firms in the context of competitive dynamics. As agency theory proposes, the managers of a firm cannot freely decide its competitive activity at manage- rial discretion ; managers are agents of capital providers (i.e., principals) and agents are supposed to en- gage in meeting their principalsʼ interests (Fama & Jensen, 1983 ; Jensen & Meckling, 1976 ; Jensen, 1986).
Since principals of a firm can control it by verifying and monitoring agentsʼ plans and actions, the princi- pals can influence managerial decisions for their own interests. Based on this logic, competitive activity of competing firms would reflect their capital providersʼinterests. Recent studies have provided empirical evidence supporting this statement. For example, Connelly et al. (2010) empirically demonstrate that insti- tutional investors influence the frequency of strategic or tactical actions of firms based on their prefer- ences for the temporality of investment. Likewise, Zhang and Gimeno (2010) also show that earning pres- sures from the capital market on an electric company to increase the capacity utilization level against its competitors.
If large shareholders have more power over firms, they can exercise more influence on the firmsʼ com- petitive behavior to satisfy their interests (Hansen & Hill, 1991 ; Kochhar & David, 1996 ; Shleifer &
Vishny, 1986). Large shareholdersʼ power over firms and their managers is endorsed by voting and control rights based on levels of equity ownership. Power is defined as “asymmetric control over valued resources in social relations” (Magee & Galinsky, 2008 : 361). Large shareholders with power have multiple means to influence managers in order to navigate their firms to the shareholdersʼ goals. For example, large share- holders can dispatch their representatives to a firmʼs board of directors in order to verify and monitor managerial decisions and actions (Adams, Hermalin, & Weisback, 2010 ; Demb & Neubauer, 1992 ; Mace, 1971). Likewise, large shareholders can take actions to put pressure on managers by taking political means, such as public announcements, direct negotiations, shareholder proposals, and proxy fights (David, Hitt, & Gimeno, 2001 ; Shleifer & Vishny, 1997). Additionally, large shareholders can align managerial deci- sions with their interests by setting executive compensation (Devers, Cannella, Reilly, & Yoder, 2007 ; Sanders & Hambrick, 2007). Furthermore, large shareholders can threaten disobedient managers by indi- cating an option of selling their firmʼs shares in the capital market (Pfeffer & Salancik, 1978).
Shareholder Overlap between Competing Firms and Its Effect on Competitive Activity
Overlapping shareholders of two firms are defined as those who simultaneously own both firmsʼ shares.1 As discussed above, large shareholders can wield influence on firmsʼ competitive activity. Since overlap- ping shareholders of two competing firms, by definition, own the firmsʼ shares, they can simultaneously manipulate the competitive activity of the competing firms such that their competitive activity will jointly meet the overlapping shareholdersʼ interests.
Provided that large shareholders pursue profit maximization from their investments, they will aim to manipulate firmsʼcompetitive activity for their own profits. Overlapping shareholders can maximize re- turns from their investments in competing companies by pacifying the firmsʼ competitive activity. Mild competition between firms increases producersʼeconomic surplus (DʼAveni, 1994 ; DʼAveni, Dagnino, &
Smith, 2010 ; Porter, 1980). Because shareholders are legally defined as residual claimants of the firmʼs profit (Shleifer & Vishny, 1997), the increase in the firmsʼ net income derived from mild competition con- tributes to shareholdersʼ income. This negative effect of shareholder overlap on competitive intensity has been found at the industry level. Trivieri (2007) empirically demonstrates that Italian banks involved in crossownership tended to engage in less competition between 1996 and 2000.
Based on the argument above, overlapping shareholders would intend to pacify the interfirm rivalry be- tween competing firms by influencing their awareness, motivation, and capability for competitive activity in multiple ways. As for the awareness aspect, overlapping shareholders can assist the managers of a firm to analyze its competing firmʼs competitive actions through their representative directors with knowledge of the competing firm, which is limited to the overlapping shareholders. Likewise, overlapping sharehold- ers force the managers to notice the strategic importance of the competing firmʼs action by public an- nouncements or shareholder proposals (Shleifer & Vishny, 1986). As a result, the managers of a firm can instantly recognize its competing firmʼs competitive actions in the way as its overlapping shareholders want. If two competing firms find that the levels of their awareness about rivalry are closely equal, they are less likely to start intensive competitive interactions for fear of possible effective and quick competi- tive responses (Chen, 1996 ; Smith et al., 1991). Therefore, the firms owned by overlapping shareholders will seriously consider taking less intensive competitive actions and responses, which are desirable for the
overlapping shareholders.
In terms of the motivation aspect, the overlapping shareholders can provide managers with incentives to initiate competitive responses. According to expectancy theory, explicit relationships among effort, per- formance, and outcome tend to enhance human motivation (Vroom, 1964). Therefore, overlapping share- holders can set the executive compensation such that managers of a firm will be rewarded for taking less intensive competitive actions and responses toward its competing firm. Likewise, overlapping sharehold- ers can demote or dismiss existing managers of the competing firms if their competitive actions are not desirable for overlapping shareholders. Consequently, the managers will have higher motivation to take less intensive competitive actions, which satisfy the overlapping shareholdersʼ expectations.
Finally, overlapping shareholders can encourage managers of a focal firm to take less intensive competi- tive actions and responses toward its competing firm by equalizing the focal firmʼs and its competing firmʼs capability for competitive activity in two ways. First, overlapping shareholders can adjust financial resources provided for competing firms, which are highly versatile in corporate operations (Barney, 1986, 1991). Second, because overlapping shareholders can obtain private information about competitive activity from their representative directors of both competing firms, they can advise the firms about each otherʼs competitive activity. In other words, the overlapping shareholders of two competing firms work as the conduits for their information (Gnyawali & Madhavan, 2001). If two competing firms are equipped with similar resources and knowledge, they are less likely to engage in intensive competitive interactions be- cause effective and quick competitive responses can be initiated (Chen, 1996). Accordingly, the managers of the firm controlled by its overlapping shareholders will conduct less intensive competitive actions for their competing firmʼs actions.
These overlapping shareholdersʼ influence on awareness, motivation, and capability for competing firmsʼ competitive activity depends on their power over the firms. If the overlapping shareholders have more power over the competing firms, they can use more influential means of encouraging managers to take desirable competitive actions. Thus, when overlapping shareholders have more power over competing firms, their competitive activity tends to become less intensive in terms of action frequency and magni- tude.
.
.
3. Research Methods
Sample and Data Collection
I tested for the proposed relationships by using the sample of the competitive interactions of pairs of leaders (i.e., the firms with the largest market share) and challengers (i.e., the firms with the second largest market share) in 13 almostduopolistic industries in Japan from 1997 through 2006. I focused on the com- petitive interactions between the leaders and challengers because they engage in headtohead competi- tion ; therefore, their competitive behavior has a direct impact on firm performance, such as market share
(Ferrier et al., 1999). In addition, if multiple firms compete in an industry, it is difficult to find the link be- tween overlapping shareholdersʼ effects and other firmsʼ competitive activity because other competing firmsʼ competitive actions might work as confounding factors. Accordingly, in industries in which leaders and challengers stably maintain their positions, the impact of overlapping shareholders on competing firmsʼcompetitive activity could be more easily identified than in crowded industries.
This Japanese context is particularly suitable to test for the suggested hypotheses because the competi- tive activities of competing firms can be easily observed. Japanese firms intensively competed with each other in the 1990 s and 2000 s. After the burst of the bubble economy in the 1990 s, Japanese firms became pessimistic about future market growth. Because of the stagnant market growth in the late 1990 s, Japa- nese firms engaged in fierce competition with each other to gain and protect market share.
I collected data on competitive actions, following the procedures of Ferrier et al. (1999). First, I selected Japanese listed firms that are considered distinct singleor dominantbusiness entities in a focal industry (i.e., 70 percent or more of the sales of the firm come from the industry [Rumelt, 1982]). Industries are clas- sified based on the fourdigit Japanese Standard Industrial Classification code, which is the equivalent to the North American Industry Classification. By adopting this criterion, I ensured that firms in the same in- dustry were competing directly with each other. If firms did not report details of sales and if the reported information on sales did not fit the fourdigit classification, I excluded the firms from the sample.
Second, from the list of single and dominantbusiness firms, I chose the pairs of leaders and challeng- ers within industries. A leader is the firm with the largest market share in the focal industry and a chal- lenger is the firm with the secondlargest market share in the focal industry. Third, when the leaders and challengers were dominant or singlebusiness firms in an industry for at least four consecutive years from 1997 to 2006, the industry was included in the sample of this study. The number of the sampled in- dustries is 13.
The unit of analysis of this study is . Since some independent variables were lagged by one year to avoid simultaneous bias, the number of observations is 64 industryyear observations. Table 1 shows the names of firms and industries during the period. I collected firm data from the
.
Variables and Measures
. The dependent variables in this study are the
and the . Following the procedures adopted in a series of
previous studies by Chen and by Ferrier, I collected competitive actions from articles in business newspa- pers and trade magazines through content analysis. According to Ferrier et al. (1999), competitive actions are “all externally directed, specific, and observable newly created moves initiated by a firm to enhance its competitive position” (Ferrier et al., 1999 : 378). The sources of the articles are and , Japanese general and manufacturing business newspapers published from April 1, 1997, to March 31, 2007. I considered the period from April 1 to March 31 as a fiscal year because most Japanese firms traditionally use this period as their fiscal year. The articles were collected from
, the comprehensive electronic archives of Japanese business newspapers.
I identified and coded the competitive actions of each firm by using structured content analysis of the
articles about the firm (Jauch, Osborn, & Martin, 1980). First, I collected the headlines of all articles that re- ported the names of the firms in the sample in Table 1. There were 18,590 such articles. Second, from the collected headlines, I selected those reporting the competitive actions of the firms in the focal industries. If a certain action of a firm did not fall within the focal industry of the firm, the action was not counted. Fi- nally, with the second coder, I checked the reliability of distinguishing competitive actions from noncom- petitive actions. The second coder, who works for an investment bank and who is familiar with multiple industries because of her experience with financial auditing, independently classified 1,000 articles that were randomly selected from the pool of collected articles. This number of articles reviewed by the inde- pendent coder is sufficiently large to ensure the reliability of the content analysis (Neuendorf, 2002). I used Cohenʼs , an index of intercoder reliability (Cohen, 1968) in order to check whether competitive and noncompetitive actions were consistently classified. The value of Cohenʼs was 0.92, which is above the general cutoff point of reliability (0.80). All disagreement on coding was solved through discussion, and
TABLE 1 List of Industries and Firms in the Sample
Industry Firm Year
1. Automobile tires and tubes Bridgestone
1997−2006 Sumitomo Rubber Industries
2. Cloths for sports, health, and work Mizuno
1997−2005 Goldwin
3. Fireproof brick Shinagawa Refractories
2001−2005 Kurosaki Harima
4. Broadcasting−Television Nippon Television Network
1998−2004 Fuji Television Network
5. Gasoline station Showa Shell Sekiyu
1999−2005 Cosmo Oil Company
6. Office machines and equipment Canon
1997−2002 RICOH Company
7. Cold rolling Toyo Kohan
2002−2005 Nippon Kinzoku
8. Light bulbs Ushio
1997−2000 Iwasaki Electric
9. Special civil engineering works Toa Corporation
2000−2005 Raito Kogyo
10. Frozen food Nichirei
1997−2000 Katokichi
11. Storage batteries Japan Storage Battery
1997−2002 YUASA
12. Menʼs clothing stores Aoki International
2000−2004 Aoyama Trading
13. Printing Toppan Printing
1997−2000 Dai Nippon Printing
the reliability of coding competitive actions was assured.
After identifying competitive actions, I classified competitive actions into action types based on those defined by Derfus, Maggitti, Grimm, and Smith (2008). Derfus et al. (2008) identify five types of competitive actions (i.e., pricing actions, capacity actions, geographic actions, marketing actions, and product introduc- tions) within 11 diverse industries. Consequently, their action types comprehensively cover the competi- tive actions of most industries. Among the five action types, I identified four action types : pricing actions, capacity actions, internationally expansion actions, and new product/process introductions. Unfortunately, marketing actions could not be precisely identified because marketing activities were extremely diverse among the sampled industries. The same second coder independently classified the competitive actions into the four action categories. The value of Cohenʼs was 0.88. After computing Cohenʼs , the author and coder discussed and solved the disagreement. The number of competitive actions in the sam- ple is 793.
was measured as the number of competitive actions taken by the two competing firms in an industry. reflects a firmʼs propensity for total competitive actions during a certain period. Based on previous studies (e.g., Smith et al., 1991 ; Young et al., 2000), I measured a firmʼs action frequency by the number of competitive actions of the firm within a year. The oneyear duration was frequently used in previous studies. Then, I summed up the action frequency of the two competing firms in an industry in a year in order to calculate the total action frequency of the firms in the industry in the year. I did not use the average score for the sake of obtaining integer values in action frequency.
, the level of action magnitude taken by the two competing firms in an indus- try, was calculated as follows. Since indicates a firmʼs propensity for strategic actions (Smith et al., 1991), the variable is measured by the proportion of the number of strategic actions to that of all actions (i.e., including strategic and tactical actions). Strategic actions involve significant investment in fixed assets, people, and structure (e.g., Chen et al., 1992 ; Hambrick et al, 1996 ; Miller & Chen, 1994 ; Smith et al., 1991). I followed the procedure of Miller and Chen (1994), which classifies strategic actions ac- cording to action types (e.g., mergers and acquisitions are always considered strategic actions). Capacity actions and geographic expansion actions were counted as strategic actions because they always entail ir- reversible largescale resource commitment. Other action types, price actions and product introductions, were counted as tactical actions. Action magnitude in a given year was calculated by dividing the number of strategic actions by that of total actions in that year. Then, I averaged the action magnitude of the two competing firms in an industry in a year as the measure of .
. The independent variable, the , was created
based on ownership of competing firmsʼ equity. Since shareholdersʼpower primarily depends on their eq- uity ownership levels, I created the measure of the variable based on equity ownership. First, I identified the ten largest shareholders of all the firms in the sample and calculated their equity ownership levels.
Second, I identified the shareholders that own the equity of both competing firms in an industry as over- lapping shareholders. Overlapping shareholdersʼ equity ownership levels were summed by firm.
Third, I calculated the mean of the overlapping shareholdersʼ equity ownership share of the two com- peting firms and divided the value by the absolute value of their difference plus one. This measure is com- posed of two parts. The numerator of the measure represents joint potential power over two competing
firms because, as discussed, shareholdersʼ power is primarily based on their equity ownership. The de- nominator of the measure reflects the difference in overlapping shareholdersʼ power over two competing firms. If overlapping shareholders own the majority of one competing firmʼs equity, but only a small por- tion of the other firmʼs, they cannot easily manipulate firmsʼ competitive activity to pacify their ri- valry, because the other firm may not follow the overlapping shareholdersʼ order owing to their small power. If overlapping shareholders own two firmsʼ equity at the same levels, the value of the absolute dif- ference will be equal to 0. In order to define this variable even in that case, I added 1 to the denominator.
In summary, overlapping shareholdersʼ power over two competing firms was measured as follows :
Overlapping shareholdersʼpower over competing firms
= Mean of overlapping shareholdersʼownership share of competing firmsʼequity
1+ Difference between overlapping shareholdersʼownership share of competing firmsʼequity.
The higher value of this measure indicates that the overlapping shareholders have larger power over the competing firms.
. In order to avoid possible alternative explanations, I enter several control variables in estima- tion models. Based on Ferrier et al. (1999), which analyze dyadic interfirm rivalry between pairs of the leaders and challengers in industries and use control variables of the leaders and challengersʼ characteris- tics, these control variables are defined at the firm level. Since two competing firms existed in each indus- try, for the sake of clarity, I classified them into large and small firms in each industry based on the value of their total asset in the first year included in the sample.
First, the of two competing firms was entered in estimation be-
cause the independent variable, overlapping shareholdersʼ power, will naturally increase as the number of overlapping shareholders arises. I used the logtransformed number of the overlapping shareholders of the two competing firms in an industry as the measure of this variable.
Second, firm performance was controlled because lower firm performance urges a firm to improve its competitive position through competitive actions (Ferrier, 2001 ; Miller & Chen, 1994 ; Porter, 1980). The performance of a firm in a given year is measured by the recurring profits of the firm in that year. In or- der to avoid positive biases in estimation caused by ratio measures (Wiseman, 2009), I did not divide the profits by the total asset of the firm, but entered the variable as a control of firm size. Third, in the com- petitive dynamics literature, firm size has been reported to cause structural and competitive inertia (e.g., Miller & Chen, 1994). Firm size of was calculated using total asset.
Fourth, the influence of the large shareholdersʼ ownership level of a firm might spuriously appear in that of overlapping shareholdersʼ power. In order to control for the pure influence of the large sharehold- ers, I included the variable in the statistical models, which was measured by summing up the equity own- ership share of the ten largest shareholders of a focal firm. Fifth, a firmʼs position in a product market might affect the intensity of its competitive activity (Ferrier et al., 1999). Accordingly, I controlled for the firmʼs market share, which was calculated by the firmʼs sales in the focal industry divided by the indus- tryʼs total sales.
Sixth, the action frequency and action magnitude of each competing firm were controlled for both the estimation models for the effects on total action frequency and average action magnitude. This is because
firms tend to react to their rivalsʼ competitive actions in the same way (Chen, 1996 ; Chen & MacMillan, 1992). Accordingly, by including these variables, I can exclude the impact of rivalry in previous years on that in a given year.
Finally, to control for the unobserved yearspecific effects, which potentially reside within panel data (Certo & Semadeni, 2006), I included dummy variables of years in the model. For the sake of clarity in the table of regressions, I omitted the coefficients of the year dummy variables from the table.
For clear understanding of the regression results, all the independent and control variables except dummy variables were standardized. The measures of all the variables in this study are summarized in Table 2.
TABLE 2 Description of Variables
Category Description Type
Dependent variables
Total action frequency of two competing firms The total of the numbers of competitive actions of
two competing firms continuous
Average action magnitude of two competing firms
{(one firmʼs strategic actions/its total actions)+
(the otherʼs strategic actions/its total actions)}/2 continuous Independent variable
Overlapping shareholdersʼ power over competing firms
Mean of overlapping shareholdersʼ ownership share of competing firmsʼ equity
/{1+|Difference between overlapping sharehold- ersʼ ownership share of competing firmsʼ equity|}
continuous
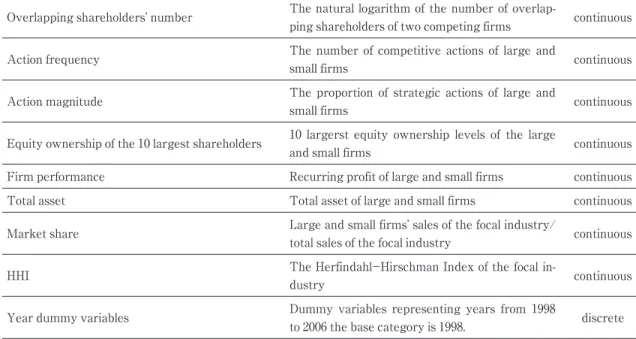
Controls
Overlapping shareholdersʼ number The natural logarithm of the number of overlap-
ping shareholders of two competing firms continuous
Action frequency The number of competitive actions of large and
small firms continuous
Action magnitude The proportion of strategic actions of large and
small firms continuous
Equity ownership of the 10 largest shareholders 10 largerst equity ownership levels of the large
and small firms continuous
Firm performance Recurring profit of large and small firms continuous
Total asset Total asset of large and small firms continuous
Market share Large and small firmsʼ sales of the focal industry/
total sales of the focal industry continuous
HHI The HerfindahlHirschman Index of the focal in-
dustry continuous
Year dummy variables Dummy variables representing years from 1998
to 2006 the base category is 1998. discrete
Statistical Analysis
The statistical specification used in this study is twofold : fixedeffects Poisson regressions for total ac- tion frequency and fixedeffects linear regressions for average action magnitude. I used a Poisson regres- sion model to estimate the effects on total action frequency because the dependent variable is a count number of competitive actions, which takes only integers. Since the dataset of the study is an unbalanced panel, correlations between the regressors and error terms might exist. Accordingly, I chose fixedeffects models as statistical specification, which successfully controls for firm and industryspecific effects on the dependent variables. In order to consider the possible lagged effects of independent variables, I lagged independent variables by 1 year. 1year lag has been commonly used in the competitive dynamics litera- ture. The analysis was conducted on version 12.1.
4. Results
The descriptive statistics and correlation matrix of the sampled are shown in Tables 3 and 4. Anotewor- thy finding is the number of overlapping shareholders. Since the average of the variable is 1.89 and its maximum is 5, these values indicate that this variable has the wide range of values sufficient to conduct meaningful statistical analysis.
In Table 4, several variables, such as total asset and recurring profit, are highly correlated with one an- other. Nonetheless, multicollinearity in regressions derived from such high correlations tends to inflate standard errors of regression coefficients. In other words, the estimated regression coefficients are more
TABLE 3 Descriptive Statistics
Variables Mean S.D. Min. Max.
1. Total action frequency t 9.94 8.81 0 40
2. Average of action magnitude 0.24 0.27 0.00 1.00
3. Power of overlapping shareholders1 0.06 0.05 0.00 0.18
4. ln (Number of overlapping shareholders)1 0.92 0.56 0 1.79
Large firm
5. Action frequency1 4.80 4.94 0 25
6. Action magnitude1 0.28 0.34 0 1.00
7. Equity ownership of the 10 largest shareholders1 0.41 0.11 0.29 0.73
8. Recurring profit1(billion yen) 10×5.44 10×7.71 0.17 102×2.82
9. Total asset1(billion yen) 102×8.64 102×9.15 10×7.28 103×2.86
10. Market share1 0.58 0.12 0.31 0.76
Small firm
11. Action frequency1 6.05 5.83 0 25
12. Action magnitude1 0.30 0.32 0 1.00
13. Equity ownership of the 10 largest shareholders1 0.45 0.14 0.27 0.72
14. Recurring profit1(billion yen) 10×2.27 10×2.87 5.51 102×1.14
15. Total asset1(billion yen) 102×4.52 102×4.93 10×6.35 103×1.83
16. Market share1 0.31 0.12 0.10 0.48
Market
17. HHI1 0.46 0.11 0.28 0.64
=64.
TABLE4CorrelationMatrix Variables12345678910111213141516 1.Totalactionfrequency 2.Averageofactionmagnitude0.08 3.Powerofoverlappingshareholders−10.28* 0.10 4.ln(Numberofoverlappingshareholders) −10.160.080.91* Largefirm 5.Actionfrequency−10.70*0.070.170.00 6.Actionmagnitude−10.120.42*0.110.070.01 7.Equityownershipofthe10largestshare- holders−10.34* 0.36* 0.35* 0.41* 0.150.13 8.Recurringprofit−1(billionyen)0.60*0.060.30*0.230.47*0.010.25* 9.Totalasset−1(billionyen)0.68*0.120.40*0.31*0.55*0.110.35*0.92* 10.Marketshare−10.100.210.230.40*0.060.190.26*0.070.08 Smallfirm 11.Actionfrequency−10.75*0.010.190.060.60*0.080.29*0.72*0.69*0.08 12.Actionmagnitude−10.170.040.100.110.190.110.44*0.090.030.040.02 13.Equityownershipofthe10largestshare- holders10.040.010.31* 0.29* 0.020.010.120.150.32* 0.060.050.11 14.Recurringprofit−1(billionyen)0.50*0.030.35*0.27*0.49*0.060.010.68*0.70*0.180.50*0.240.08 15.Totalasset−1(billionyen)0.69*0.010.29*0.210.61*0.030.30*0.74*0.82*0.190.69*0.030.130.86* 16.Marketshare−10.040.28*0.070.080.070.25*0.040.25*0.190.55*0.110.180.130.29*0.24 Market 17.HHI−10.110.190.210.38*0.12*0.160.28*0.100.040.89*0.010.040.030.180.160.20 =64.*for<.05.
TABLE 5 Estimation for the Effects on Total Action Frequency and Average Action Magnitude Total Action
Frequency+1
Average Action Magnitude+1
Model 1 Model 2 Model 3 Model 4
Intercept 0.36 0.41
(0.13) (0.12)
Power of overlapping shareholders 0.38* 0.23*
(0.22) (0.12)
Control : Interfirm
ln (Number of overlapping shareholders) 0.26* 0.66* 0.04 0.20†
(0.12) (0.26) (0.07) (0.14)
Controls : Large firm
Equity ownership of the 10 l argest shareholders 0.09 0.11 0.18† 0.19†
(0.28) (0.28) (0.14) (0.13)
Recurring profit 0.07 0.12 0.20 0.07
(0.26) (0.28) (0.17) (0.18)
Total asset 0.81 1.42* 0.58† 1.00*
(0.59) (0.68) (0.42) (0.45)
Market share 0.53† 0.61† 0.35 0.56†
(0.79) (0.80) (0.40) (0.40)
Action frequency 0.14* 0.15**
(0.06) (0.06)
Action magnitude 0.04 0.05†
(0.04) (0.04) Controls : Small firm
Equity ownership of the 10 largest shareholders 0.30 0.51† 0.05 0.20
(0.39) (0.36) (0.21) (0.21)
Recurring profit 0.57* 0.63* 0.08 0.16
(0.32) (0.33) (0.13) (0.17)
Total asset 0.33 1.36† 0.52 0.09
(0.77) (0.98) (0.45) (0.48)
Market share 0.43 0.51 0.05 0.00
(0.36) (0.36) (0.21) (0.18)
Action frequency 0.03 0.08
(0.11) (0.11)
Action magnitude 0.06† 0.06*
(0.04) (0.04) Control : Market
HHI 0.04 0.21 0.03 0.26
(0.68) (0.69) (0.32) (0.33)
Controls : Dummies
Year dummies Included Included Included Included
Wald Chi2 32.72* 34.92*
Log likelihood 128.10 126.63
2 delta (log likelihood) 2.94†
Within 2 0.49 0.55†
Delta within 2 0.06†
=64.** for <.01,* for p<.05, and for p<.10. All t tests are onetailed tests. Standard errors are in parentheses.
likely to be (Kennedy, 2008). Therefore, I will have to check and remedy multicollinearity hypothesisrelated variables are nonsignificant.
Table 5 illustrates the estimation for effects on total action frequency (Models 1 and 2) and average ac- tion magnitude (Models 3 and 4) between competing firms. Values in the columns in the tables are regres- sion coefficients and standard errors. Since I have directional hypotheses, I used onetailed tests for hy- pothesisrelated variables and twotailed tests for control variables in all models.
Model 1 in Table 5 includes only control variables. In Model 2, the variable of overlapping sharehold- ersʼpower was added to test for Hypothesis 1. The hypothesis predicts that overlapping shareholdersʼ power decreases the total action frequency between competing firms. Its estimated regression coefficient is negative and statistically significant ( =−0.38, .=0.22, < 0.05). Since this result indicates that the power of overlapping shareholders decreases the total action frequency, it shows support to Hypothesis 1.
In terms of average action magnitude, in Hypothesis 2, I predicted that the power of their overlapping shareholders decreases the average action magnitude between competing firms. According to the results in Model 4 in Table 5, which includes overlapping shareholdersʼpower and control variables, the estimated regression coefficient for the concerned variable is negative and statistically significant ( =−0.23, .=
0.12, <0.05) ; therefore, it can be concluded that Hypothesis 2 was supported.
5. Discussion and Conclusions
This study sought to reveal the impact of overlapping shareholders of two competing firms on their in- terfirm rivalry. Borrowing insight from the AMC perspective and agency theory, I theorized that the overlapping shareholders of two competing firms manipulate the firmsʼ competitive activity by influenc- ing their awareness, motivation, and capability for competitive activity such that its intensity level will be equalized, because such parity of competitive activity possibly maximizes the overlapping shareholdersʼ returns.
The empirical findings from data on 13 almost duopolistic industries in Japan provide support for all the hypotheses. Overlapping shareholdersʼ power over two competing firms significantly decreases the com- peting firmsʼ action frequency and magnitude. This finding is clearly consistent with the Hypotheses 1 and 2. Pacifying competitive interactions between competing firms possibly maximizes their overlapping shareholdersʼ return. Therefore, when the overlapping shareholders have more power over the compet- ing firms, they will manipulate the firmsʼ competitive activity such that their action frequency and magni- tude will be reduced.
Theoretical and Practical Implications
The findings of this study provide several implications that expand the theoretical horizons of competi- tive dynamics and agency theory. First, the empirical findings of this study indicate that interfirm rivalry of competing firms is influenced by their overlapping shareholders. As Connelly et al. (2010) and Zhang and Gimeno (2010)indicated, the influence from the capital market is one of driving forces for competitive behavior. However, although the pioneering studies found that firms determine their competitive activity following capital providersʼ preferences, their research focus has been limited to capital providersʼ influ- ence on a firm. This study further developed the theory by focusing on the context of dyadic rivalry
between two competing firms and their shareholder overlapʼs simultaneous influence on firms.
Second, from the agency perspective, this study presented a theoretical model regarding why and how overlapping shareholders manipulate their competing firmsʼ competitive activity. Although previous stud- ies have empirically shown that shareholder overlap among firms tends to reduce competitive intensity at the industry level (e.g., Trivieri, 2007), no empirical evidence for the influence of shareholder overlap on dyadic interfirm rivalry has been provided. As the first attempt, this study found a positive relationship between the power of overlapping shareholders and the stability of competing firmsʼ competitive interac- tions. This finding implies that principals (i.e., shareholders) aim to control multiple agentsʼ (i.e., firmsʼ) ac- tivity to maximize joint returns from the agents. Accordingly, the findings of this study suggest that, when researchers investigate the relationship between a principal and an agent, they also consider other agents whose activities are potentially interactive with the agentʼs. In addition to this theoretical implica- tion, this study proposes a novel measure of the power of overlapping shareholders over their competing firms, which can be used for future studies in this field.
This study also provides useful implications for practice because it is the first empirical test for the im- pact of shareholder overlap on interfirm rivalry. From the viewpoint of industrial policy, shareholder over- lap between competing firms should be legally restricted because it might attenuate competition among firms, which results in reduction of the consumer surplus. By using power over competing firms, overlap- ping shareholders can create a kind of tacit collusion between firms. Such collusion may impede fair com- petition, which is necessary for the healthy growth of industry.
For managers, it should be noted that overlapping shareholders of competing firms may advise the firms with the intent to pacify their competitive activity, rather than to help them beat their rivals. As dis- cussed above, overlapping shareholders can maximize the expected returns from their investment in competing firms through the stability of the firmsʼ competitive interactions. Therefore, the overlapping shareholders intend to avoid the situation that one competing firm completely beats the other, which will not necessarily contribute to the overlapping shareholdersʼ return. For example, although a firmʼs radical product introduction could expel its competing firms from a market, overlapping shareholders might put pressures on the firm to deter the radical product introduction in order to maintain the stability of their competitive activity. Accordingly, managers of a firm should take managerial advice from its overlapping shareholders with caution.
Limitations and Future Directions
The implications of this study should be interpreted with caution because this study has some inevita- ble limitations, which can be addressed in future studies. First, the study has exclusively focused on over- lapping shareholdersʼ influence, but has not considered other overlapping stakeholdersʼ influence on com- peting firms. Large shareholders are generally recognized as one of primary stakeholders because they are providers of financial resources, which are vital for firm survival (Donaldson & Preston, 1995 ; Mitchell, Agle, & Wood, 1997 ; Pfeffer & Salancik, 1978) ; therefore, it is reasonable to expect that overlap- ping shareholders have a major impact on firmsʼ competitive activity. However, other stakeholders might have power over firms to some degree because of their resources. For example, creditors are another ma- jor capital provider for firms. Likewise, overlapping suppliers could affect firmsʼ competitive activity by
controlling supplies of goods and services. Future studies should investigate the impact of other overlap- ping stakeholders on competitive activity.
Second, this study has not addressed the possibility that overlapping shareholders may have different preferences for payoff horizon. For example, Connelly et al. (2010) showed that institutional investorsʼpref- erence for payoff horizons appears in firmsʼ choice between strategic and tactical actions. Based on their findings, it can be inferred that two competing firmsʼ overlapping shareholdersʼ preference for a payoff horizon influences the intensity of their competitive activity. If the majority of the overlapping sharehold- ers of competing firms are dedicated institutional investors, who tend to prefer a longer payoff horizon, the stability of competitive interactions can be more readily achieved because they are willing to own the firmsʼ shares for long periods. In actuality, in this Japanese context between 1997 and 2006, there were much fewer transient institutional investors than in the US ; therefore, the empirical results of this study might be derived from the dedicated institutional investorsʼ preference for a longer payoff horizon.
Third, only 13 industries were covered in this study. Although the sample in this study only covers some of the industries in the business world, it should be emphasized that, compared to prior studies in the competitive dynamics literature, the number of industries included in this sample is not small (e.g., 13 industries in Ferrier, 2001, and 11 industries in Derfus et al., 2006). Additionally, ranging from classics to recently published works, most studies in the literature analyze rivalries in industries (e.g., Boyd &
Bresser, 2008 ; Chen & MacMillan, 1992 ; Smith et al., 1991 ; Marcel et al., 2011 ; Young et al., 2000). None- theless, although 13 may be an acceptable number of industries in the competitive dynamics literature, in- vestigation into more diverse industries would confirm the findings of this study.
Finally, the national context of the sample, Japan, would potentially lower the generalizability of empiri- cal findings. Japanese firms often compete intensely with one another because of a strong tendency to imi- tate competitors, but the Japanese societal culture emphasizes collectivism and cooperation (Hofstede, 1984). Therefore, since the stability of competitive interactions is a kind of cooperation between firms, it can be more easily achieved in Japan. Although I found empirical evidence that the power of overlapping shareholders pacifies the intensity of competing firmsʼ competitive activity, this relationship would appear weaker in countries in which firms tend to engage in more intense competition with one another, such as the US. To confirm the generalizability of this studyʼs findings and to ascertain the national effects on the relationship, comparative studies based on the same research design should be conducted in different na- tional contexts.
Overall, this study examined the impact of shareholder overlap of two competing firms, which is fre- quently observed in the business world, on their interfirm rivalry by borrowing insights from competitive dynamics and agency theory. The study successfully extended the horizons of the two theories. Before this study, we knew only that large shareholders wield influence over a firmʼs competitive behavior, but we now know that overlapping shareholders jointly pacify multiple firmsʼ competitive behavior in order to maximize their own returns.
Notes
1. In this study, I do not consider individual investors with a small number of shares of two competing firms because they have only negligible influence on the firms and are not motivated to control their competitive activity. The term,
“overlapping shareholders,” means “large overlapping shareholders” in this study.
References
ADDIN EN.REFLIST Adams, R. B., Hermalin, B. E., & Weisbach, M. S. (2010). The role of boards of directors in corpo-
rate governance : A conceptual framework and survey. (1), 58107.
Alchian, A. A., & Demsetz, H. (1972). Production, information costs, and economic organization.
(5), 777795.
Amit, R., & Schoemaker, P. J. H. (1993). Strategic assets and organizational rent. (1), 33
46.
Barney, J. (1991). Firm resources and sustained competitive advantage. (1), 99120.
Barney, J. B. (1986). Strategic factor markets : Expectations, luck, and business strategy. (10), 12311241.
Barney, J. B. (1989). Asset stock accumulation and sustained competitive advantage : A comment.
, 15111513.
Boyd, J. L., & Bresser, R. K. F. (2008). Performance implications of delayed competitive responses : Evidence from the U.
S. retail industry. , 10771096.
Carroll, G. R., & Hannan, M. T. (2000). . Princeton, New Jersey : Princeton University Press.
Certo, S. T., & Semadeni, M. (2006). Strategy research and panel data : Evidence and implications.
(3), 449471.
Chen, M.J. (1996). Competitor analysis and interfirm rivalry : Toward a theoretical integration.
(1), 100134.
Chen, M.J., & MacMillan, I. C. (1992). Nonresponse and delayed response to competitive moves : The roles of competi-
tor dependence and action irreversibility. (3), 539570.
Chen, M.J., & Miller, D. (1994). Competitive attack, retaliation and performance : An expectancyvalence framework.
(2), 85102.
Chen, M.J., Smith, K. G., & Grimm, C. M. (1992). Action characteristics as predictors of competitive responses.
, 439455.
Chen, M.J., Su, K.H., & Tsai, W. (2007). Competitive tension : The awarenessmotivationcapability perspective.
(1), 101118.
Cohen, J. (1968). Weighted kappa : Nominal scale agreement with provision for scaled disagreement or partial credit.
, 213220.
Connelly, B. L., Tihanyi, L., Certo, S. T., & Hitt, M. A. (2010). Marching to the beat of different drummers : The influence
of institutional owners on competitive actions. (4), 723742.
DʼAveni, R. A. (1994). . New York : Free Press.
DʼAveni, R. A., Dagnino, G. B., & Smith, K. G. (2010). The age of temporary advantage. , 13711385.
Dalton, D. R., Hitt, M. A., Certo, T., & Dalton, C. M. (2007). The fundamental agency problem and its mitigation.
, 164.
David, P., Hitt, M. A., & Gimeno, J. (2001). The influence of activism by institutional investors on R&D.
(1), 144157.
Demb, A., & Neubauer, F. F. (1992). . New York : Oxford University
Press.
Derfus, P. J., Maggitti, P. G., Grimm, C. M., & Smith, K. G. (2008). The red queen effect : Competitive actions and firm per-
formance. (1), 6180.
Devers, C. E., Cannella, A. A., Reilly, G. P., & Yoder, M. E. (2007). Executive compensation : A multidisciplinary review of
recent developments. (6), 10161072.
Donaldson, T., & Preston, L. E. (1995). The stakeholder theory of the corporation : Concepts, evidence, and implications.
(1), 6591.
Fama, E. F., & Jensen, M. C. (1983). Separation of ownership and control. (2), 301325.
Ferrier, W. J. (2001). Navigating the competitive landscape : The drivers and consequences of competitive aggressive-
ness. (4), 858877.
Ferrier, W. J., Smith, K. G., & Grimm, C. M. (1999). The role of competitive action in market share erosion and industry dethronement : A study of industry leaders and challengers. (4), 372388.
Fershtman, C., & Judd, K. L. (1987). Equilibrium incentives in oligopoly. (5), 927940.
Frooman, J. (1999). Stakeholder influence strategies. (2), 191205.
Gnyawali, D. R., & Madhavan, R. (2001). Cooperative networks and competitive dynamics : A structural embeddedness
perspective. (3), 431445.
Hambrick, D. C., Cho, T. S., & Chen, M.J. (1996). The influence of top management team heterogeneity on firmsʼ com-
petitive moves. (4), 659684.
Hansen, G. S., & Hill, C. W. (1991). Are institutional investors myopic? A timeseries study of four technologydriven in-
dustries. , 116.
Hofstede, G. (2001).
(2 nd ed.). Thousand Oaks, CA : Sage.
Jauch, L. R., Osborn, R. N., & Martin, T. N. (1980). Structured content analysis of cases : A complementary method for
organizational research. (4), 517525.
Jensen, M. C. (1986). Agency costs of free cash flow, corporate finance, and takeovers.
(2), 323329.
Jensen, M. C., & Meckling, W. H. (1976). Theory of the firm : Managerial behavior, agency costs, and ownership struc-
ture. , 305360.
Kennedy, P. (2008). (6 th ed.). Malden, MA : Blackwell.
Kochhar, R., & David, P. (1996). Institutional investors and firm innovation : A test of competing hypotheses.
, 7384.
Mace, M. (1971). . Boston, MA : Harvard Business School Press.
Magee, J. C., & Galinsky, A. D. (2008). Social hierarchy : The selfreinforcing nature of power and status.
(1), 351398.
Marcel, J. J., Barr, P. S., & Duhaime, I. M. (2010). The influence of executive cognition on competitive dynamics.
(2), 115138.
Miller, D., & Chen, M.J. (1994). Sources and consequences of competitive inertia : A study of the U.S. airline industry.
(1), 123.
Mitchell, R. K., Agle, B. R., & Wood, D. (1997). Toward a theory of stakeholder identification and salience : Defining the
principle of who and what really counts. (4), 853886.
Neuendorf, K. (2002). . Thousand Oaks, CA : Sage.
Penrose, E. (1959). . New York : John Wiley & Sons.
Pfeffer, J., & Salancik, G. R. (1978). New York :
Harper & Row.
Porter, M. E. (1980). . New York : Free Press.
Rindova, V. P., Becerra, M., & Contardo, I. (2004). Enacting competitive wars : Competitive activity, language games,
and market consequences. (4), 670686.
Rumelt, R. P. (1982). Diversification strategy and profitability. (4), 359369.
Sanders, W. G., & Hambrick, D. C. (2007). Swinging for the fences : The effects of CEO stock options on company risk
taking and performance. (5), 10551078.
Shleifer, A., & Vishny, R. (1986). Large shareholders and corporate control. , 461488.
Shleifer, A., & Vishny, R. W. (1997). A survey of corporate governance. (2), 737783.
Smith, K. G., Ferrier, W., & Ndofor, H. (2001). Competitive dynamics research : Critique and future directions. In M. Hitt, R. Freeman & J. Harrison (Eds.), . London : Blackwell.
Smith, K. G., Grimm, C. M., Gannon, M. J., & Chen, M.J. (1991). Organizational information processing, competitive re- sponses, and performance in the U.S. domestic airline industry. (1), 6085.
Trivieri, F. (2007). Does crossownership affect competition? Evidence from the Italian banking industry.
(1), 79101.
Vroom, V. H. (1964). . New York : Wiley.
Wiseman, R. M. (2009). On the use and misuse of ratios in strategic management research. In D. D. Bergh & D. J.
Ketchen (Eds.), (Vol. 5, pp. 75110). San Diego, CA : JAI Press.
Wooldridge, J. M. (2002). . Cambridge, MA : MIT Press.
Young, G., Smith, K. G., Grimm, C. M., & Simon, D. (2000). Multimarket contact and resource dissimilarity : A competi-
tive dynamics perspective. (6), 12171236.
Yu, T., & Cannella, A. A. (2007). Rivalry between multinational enterprises : An event history approach.
(3), 665686.
Zhang, Y., & Gimeno, J. (2010). Earnings pressure and competitive behavior : Evidence from the U.S. electricity indus-
try. (4), 743768.